

Anesthetic effects on electrophysiological responses across the visual pathway
- PMID: 39537872
- PMCID: PMC11561267
- DOI: 10.1038/s41598-024-79240-2
Anesthetic effects on electrophysiological responses across the visual pathway
Abstract
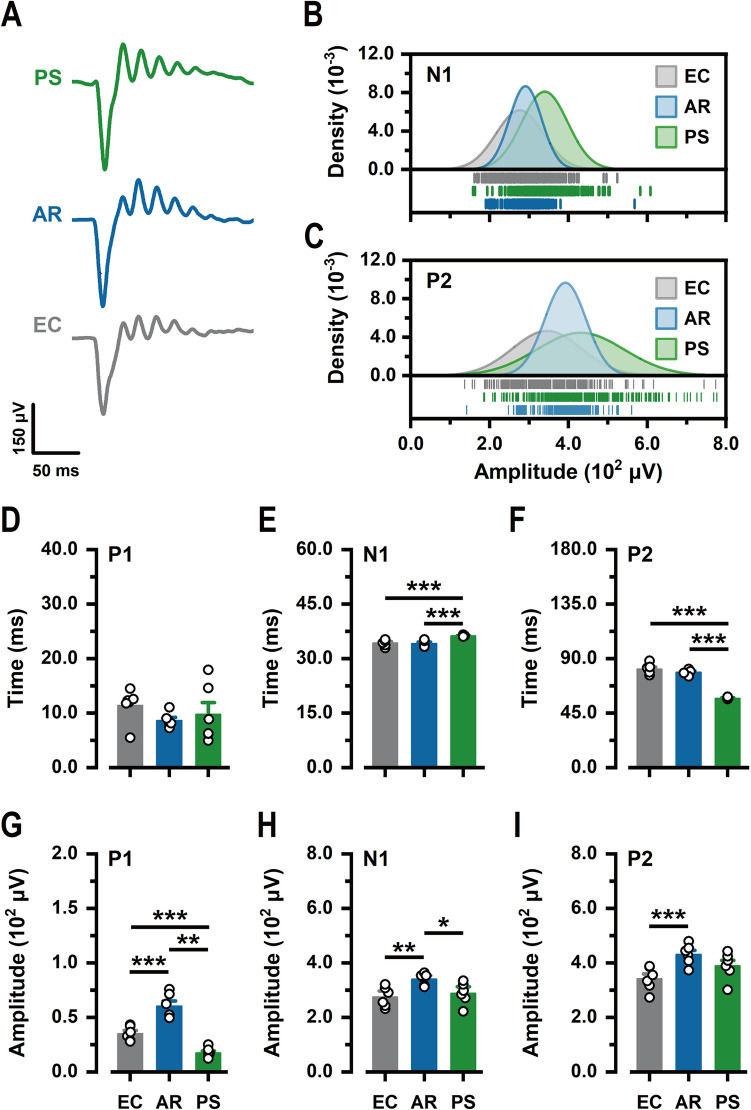
Anesthetics are widely used in electrophysiological tests to assess retinal and visual system functions to avoid experimental errors caused by movement and stress in experimental animals. To determine the most suitable anesthetic for visual electrophysiological tests, excluding ketamine and chloral hydrate due to regulatory and side effect concerns, this study investigated the effects of ethyl carbamate (EC), avertin (AR), and pentobarbital sodium (PS) on visual signal conduction in the retina and primary visual cortex. Assessments included flash electroretinogram (FERG), pattern electroretinogram (PERG), pattern visual evoked potentials (PVEP), and flash visual evoked potentials (FVEP), FERG and FVEP were used to evaluate the responses of the retina and visual cortex to flash stimuli, respectively, while PERG and PVEP assessed responses to pattern stimuli. The research showed that AR demonstrates the least disruption to the visual signal pathway, as evidenced by consistently high characteristic peaks in the AR group across various tests. In contrast, mice given EC exhibited the lowest peak values in both FERG and FVEP, while subjects anesthetized with PS showed suppressed oscillatory potentials and PERG responses. Notably, substantial PVEP characteristic peaks were observed only in mice anesthetized with AR. Consequently, among the three anesthetics tested, AR is the most suitable for visual electrophysiological studies.
© 2024. The Author(s).
Conflict of interest statement
Figures


Similar articles
-
A chronic implant to record electroretinogram, visual evoked potentials and oscillatory potentials in awake, freely moving rats for pharmacological studies.Neural Plast. 2004;11(3-4):241-50. doi: 10.1155/NP.2004.241. Neural Plast. 2004. PMID: 15656271 Free PMC article.
-
Clinical and experimental evidence that the pattern electroretinogram (PERG) is generated in more proximal retinal layers than the focal electroretinogram (FERG).Ann N Y Acad Sci. 1982;388:580-607. doi: 10.1111/j.1749-6632.1982.tb50818.x. Ann N Y Acad Sci. 1982. PMID: 6953889
-
Effects of common anesthetics on eye movement and electroretinogram.Doc Ophthalmol. 2011 Jun;122(3):163-76. doi: 10.1007/s10633-011-9271-4. Epub 2011 Apr 26. Doc Ophthalmol. 2011. PMID: 21519880 Free PMC article.
-
Visual electrophysiological responses in persons with type 1 diabetes.Diabetes Metab Res Rev. 2001 Jan-Feb;17(1):12-8. doi: 10.1002/dmrr.177. Diabetes Metab Res Rev. 2001. PMID: 11241887 Review.
-
The importance of the electrophysiological tests in the early diagnosis of ganglion cells and/or optic nerve dysfunction coexisting with pituitary adenoma: an overview.Doc Ophthalmol. 2018 Dec;137(3):193-202. doi: 10.1007/s10633-018-9659-5. Epub 2018 Oct 29. Doc Ophthalmol. 2018. PMID: 30374652 Free PMC article. Review.
Cited by
-
The Role of Non-coding RNAs in Diabetic Retinopathy: Mechanistic Insights and Therapeutic Potential.Mol Neurobiol. 2025 Aug;62(8):9829-9860. doi: 10.1007/s12035-025-04863-z. Epub 2025 Apr 1. Mol Neurobiol. 2025. PMID: 40164888 Review.
References
-
- Baden, T., Euler, T. & Berens, P. Understanding the retinal basis of vision across species. Nat. Rev. Neurosci.21, 5–20. 10.1038/s41583-019-0242-1 (2020). - PubMed
-
- Diamond, J. S. Inhibitory interneurons in the retina: Types, circuitry, and function. Annu. Rev. Vis. Sci.3, 1–24. 10.1146/annurev-vision-102016-061345 (2017). - PubMed
-
- Ernst, M. O. & Bulthoff, H. H. Merging the senses into a robust percept. Trends Cogn. Sci.8, 162–169. 10.1016/j.tics.2004.02.002 (2004). - PubMed
-
- Zhang, W. H. Decentralized neural circuits of multisensory information integration in the brain. Adv. Exp. Med. Biol.1437, 1–21. 10.1007/978-981-99-7611-9_1 (2024). - PubMed
MeSH terms
Substances
Grants and funding
- 2020CFA069/Department of Science and Technology, Hubei Provincial People's Government
- 2018CFB434/Department of Science and Technology, Hubei Provincial People's Government
- 1180002/Wuhan University of Science and Technology
- 1180030/Wuhan University of Science and Technology
- 2023H20134/Wuhan University of Science and Technology
LinkOut - more resources
Full Text Sources
Research Materials
