. 2024 Dec;21(12):1522-1534.
doi: 10.1038/s41423-024-01237-8. Epub 2024 Nov 13.

Alternative mRNA polyadenylation regulates macrophage hyperactivation via the autophagy pathway

Affiliations

Alternative mRNA polyadenylation regulates macrophage hyperactivation via the autophagy pathway

Yunzhu Chen et al. Cell Mol Immunol. 2024 Dec.

Abstract

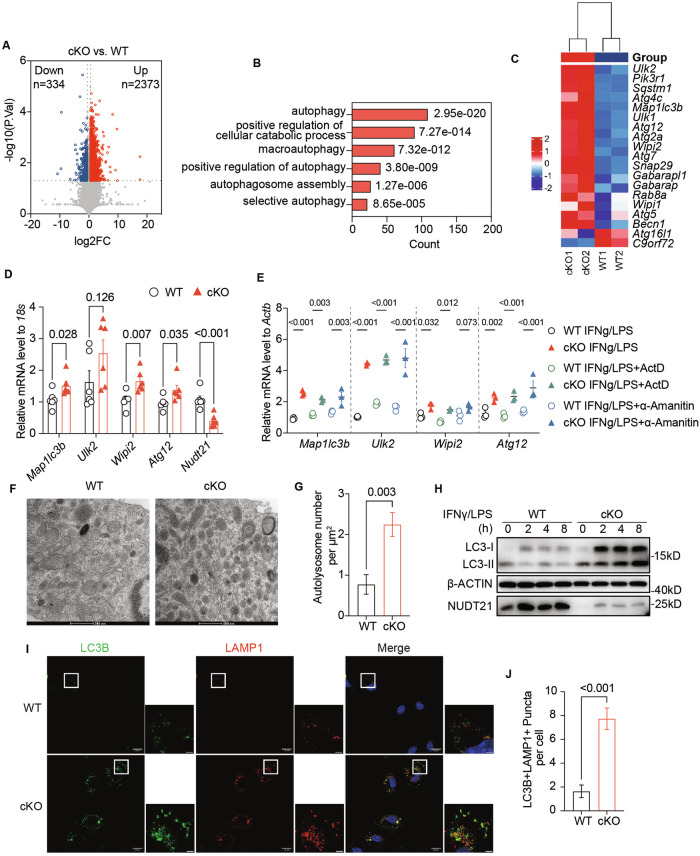
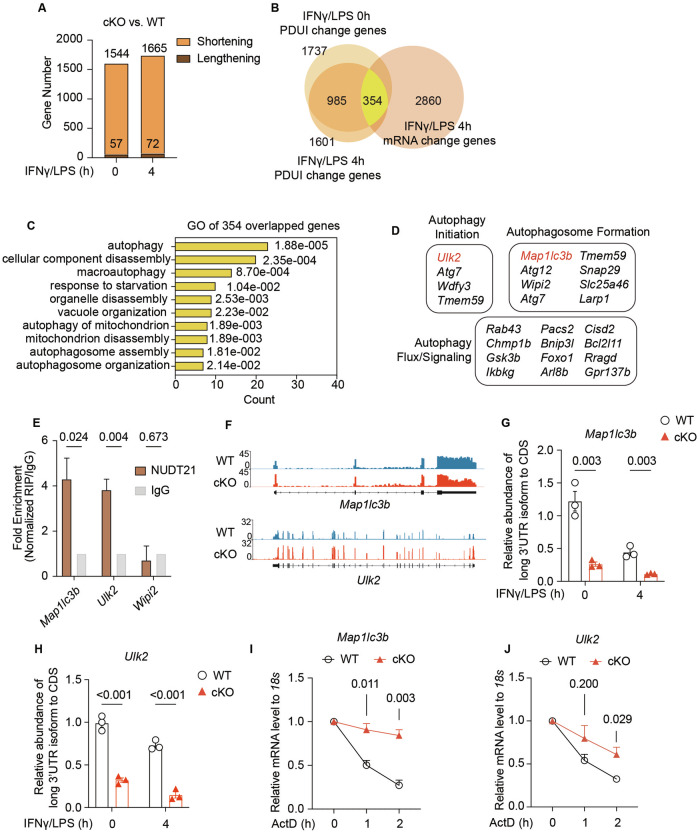
Macrophage hyperactivation is a hallmark of inflammatory diseases, yet the role of alternative polyadenylation (APA) of mRNAs in regulating innate immunity remains unclear. In this study, we focused on 3'UTR-APA and demonstrated that Nudt21, a crucial RNA-binding component of the 3'UTR-APA machinery, is significantly upregulated in various inflammatory conditions. By utilizing myeloid-specific Nudt21-deficient mice, we revealed a protective effect of Nudt21 depletion against colitis and severe hyperinflammation, primarily through diminished production of proinflammatory cytokines. Notably, Nudt21 regulates the mRNA stability of key autophagy-related genes, Map1lc3b and Ulk2, by mediating selective 3'UTR polyadenylation in activated macrophages. As a result, Nudt21-deficient macrophages display increased autophagic activity, which leads to reduced cytokine secretion. Our findings highlight an unexplored role of Nudt21-mediated 3'UTR-APA in modulating macrophage autophagy and offer new insights into the modulation of inflammation and disease progression.

Keywords: Nudt21; alternative polyadenylation; autophagy; inflammation; macrophage.


Conflict of interest statement

Competing interests: The authors declare no competing interests.

Figures

Fig. 1
Fig. 1
Increased NUDT21 expression in inflammatory diseases and its protective role against colitis in Nudt21-deficient macrophages. mRNA expression levels of NUDT21 in inflamed tissues from patients with inflammatory bowel disease (IBD) (GSE179285) (A), psoriasis (GSE13355) (B), rheumatoid arthritis (RA) and osteoarthritis (OA) (GSE236924) (C) and sepsis (GSE95233) (D). UC-un = uninflamed tissue from ulcerative colitis patients; UC = inflamed tissue from ulcerative colitis patients; CD-un = uninflamed tissue from Crohn’s disease patients; CD = inflamed tissue from Crohn’s disease patients; NN = normal skin from controls; PN = uninvolved skin from psoriatic patients; PP = involved skin from psoriatic patients; RA = rheumatoid arthritis; OA = osteoarthritis. Group sizes: (A) UC-un = 32; UC = 23, CD-un = 121, CD = 47, (B) NN = 64, PN = 58, PP = 58, C Control = 7, RA = 36, OA = 89, D Sepsis Nonsurvivor = 34, Sepsis Survivor = 68. Wild-type (WT) and Nudt21-cKO mice were treated with 3% dextran sulfate sodium (DSS) for 5 days followed by access to regular drinking water for 3 days. Body weight changes (E), representative images of the large intestine (F), colon length measurements (G), representative hematoxylin and eosin (H&E)-stained colon sections (H), and histological scoring (I) from both groups of mice were analyzed on day 8 after DSS treatment. Scale bars: 100 μm in H. The arrows indicate edema (yellow), lymphocytes (black), and neutrophils (green). The error bars represent the standard errors of the means (SEMs). P values were determined by unpaired Student’s t-test or one-way ANOVA
Fig. 2
Fig. 2
Loss of Nudt21 in Macrophages Alleviates Excessive Inflammation in an HLH Model. A Survival curves of WT and Nudt21-cKO mice in the hemophagocytic lymphohistiocytosis (HLH) model, with polyI:C (10 mg/kg) followed by lipopolysaccharide (LPS) (5 mg/kg) injections (n = 5 per group). Survival curves were analyzed via the log-rank (Mantel‒Cox) test. Analyses conducted 6 hours post-LPS injection included rectal temperature changes (B), body weight changes (C), white blood cell counts in peripheral blood (D), representative H&E-stained spleen sections and spleen injury scores (E) (n = 3 per group), the ratio of spleen weight to body weight (F), and the mRNA expression levels of Il6 and Il1β in spleen tissues (G). P values were determined by unpaired Student’s t test. (H) Survival curves of WT and Nudt21-cKO mice following the indicated treatments (n = 6 per group). Survival curves were analyzed via the log-rank (Mantel‒Cox) test. The error bars represent the standard errors of the means (SEMs)
Fig. 3
Fig. 3
Reduced proinflammatory traits in Nudt21-deficient monocyte-derived macrophages. A Histogram illustrating the geometric mean fluorescence intensity (gMFI) of IL6 and quantification of the gMFI in splenic macrophages from WT and Nudt21-cKO mice in the HLH model (6 h, n = 5 per group). B Histogram displaying the gMFI of TNFα and quantification of the gMFI in splenic macrophages from WT and Nudt21-cKO mice in the HLH model (6 h, n = 3 per group). C Percentages of TNFα-positive macrophages in the spleens of WT and Nudt21-cKO mice in the HLH model (6 h, n = 3 per group). ELISA results showing IL6 (D) and TNFα (E) levels in the supernatants of splenic macrophages from HLH-WT and HLH-cKO mice 6 hours after LPS injection. F RT‒qPCR analysis of Il6, Tnfα, and Il1β in bone marrow monocytes from WT and Nudt21-cKO mice in the HLH model (6 h, n = 4 per group). Percentages of Ly6Clo cells among monocyte-derived macrophages (G) and the ratio of Ly6Chi to Ly6Clo monocyte-derived macrophages (H) in the peritoneal cavities of WT and Nudt21-cKO mice in the HLH model (2 h, n = 4 per group). Histograms showing the gMFI of IL6 (I) and TNFα (J), along with the quantification (K) of bone marrow-derived macrophages (BMDMs) from WT and Nudt21-cKO mice primed with 50 ng/ml IFNγ overnight and 50 ng/ml LPS for 8 hours (n = 3 per group). L RT‒qPCR analysis of Il6, Tnfα, and Il1β in BMDMs from WT and Nudt21-cKO mice primed with 50 ng/ml IFNγ overnight and 50 ng/ml LPS for 8 hours (n = 3 per group). The error bars represent the standard errors of the means (SEMs). P values were determined by unpaired Student’s t-test
Fig. 4
Fig. 4
Enhanced Autophagy in Nudt21-Ablated Macrophages Following Inflammatory Activation. A Volcano plot showing DEGs in Nudt21-cKO BMDMs compared with WT BMDMs after treatment with IFNγ (50 ng/ml) overnight, followed by LPS (50 ng/ml) stimulation for 4 hours. Genes with a fold change greater than 1.5 and P < 0.05 are highlighted; upregulated genes are shown in red, and downregulated genes are shown in blue. B Gene Ontology (GO) enrichment analysis of transcripts upregulated in Nudt21-cKO BMDMs relative to WT controls after treatment with IFNγ (50 ng/ml) overnight and LPS (50 ng/ml) for 4 hours. C Heatmap displaying the expression profiles of genes associated with autophagy pathways in WT and Nudt21-cKO BMDMs following treatment with IFNγ (50 ng/ml) overnight and LPS (50 ng/ml) for 4 hours. D RT‒qPCR analysis of autophagy-related gene expression in bone marrow monocytes from WT and Nudt21-cKO mice in the HLH model (6 h, n = 6 per group). E RT‒qPCR analysis of the mRNA levels of autophagy-related genes in BMDMs from WT and Nudt21-cKO mice following treatment with IFNγ (50 ng/mL) overnight and LPS (50 ng/mL) for 4 hours, with or without 5 μM actinomycin D (ActD) or 5 μg/mL α-amanitin. Representative transmission electron microscopy (TEM) images (F) and quantification of autolysosomes (G) in BMDMs primed with 50 ng/ml IFNγ overnight and 50 ng/ml LPS for 4 hours. Scale bar: 500 nm. Images represent macrophages pooled from 2–3 mice per genotype and condition, with at least 6 images analyzed per genotype. H Immunoblot analysis showing the LC3 protein levels in WT and Nudt21-cKO BMDMs following overnight stimulation with IFNγ (50 ng/mL) and LPS (50 ng/mL) for the indicated durations. I Fluorescence microscopy images of LC3B and LAMP1 staining, along with DAPI counterstaining, in WT and Nudt21-cKO BMDMs primed with 50 ng/ml IFNγ overnight and 50 ng/ml LPS for 2 hours. Scale bar in the zoomed image: 2 µm. Captions represent at least two independent experiments. J Quantification of colocalized puncta of LC3 and LAMP1 across 50 cells per group. The error bars represent the standard errors of the means (SEMs). P values were determined by unpaired Student’s t-test
Fig. 5
Fig. 5
Nudt21 Directs PolyA Site Selection and Represses the mRNA Stability of Autophagy-Related Genes. A Histogram summarizing the number of genes associated with changes in the percent distal polyA site usage index (PDUI) in WT and Nudt21-cKO BMDMs primed with 50 ng/ml IFNγ overnight and 50 ng/ml LPS for the indicated durations. B Venn diagram showing the overlap of genes with changes in both 3’UTR length and mRNA expression levels in Nudt21-cKO BMDMs primed with 50 ng/ml IFNγ overnight and 50 ng/ml LPS for 4 hours. C Histogram of Gene Ontology (GO) enrichment analysis identifying autophagy-related pathways among the 354 genes with changes in PDUI and mRNA levels in Nudt21-cKO BMDMs compared with WT controls. D List of autophagy-related genes from the overlapping set shown in B. E RNA immunoprecipitation (RIP)-qPCR analysis showing the binding of Nudt21 to the mRNAs of Map1lc3b and Ulk2 in WT BMDMs primed with 50 ng/ml IFNγ overnight and 50 ng/ml LPS for 4 hours. F RNA-seq reads across the Map1lc3b and Ulk2 loci in WT (blue) and Nudt21-cKO (red) BMDMs primed with 50 ng/ml IFNγ overnight and 50 ng/ml LPS for 4 hours. G, H RT‒qPCR analysis of distal polyA site usage in the 3’UTRs of Map1lc3b (G) and Ulk2 (H) in WT and Nudt21-cKO BMDMs primed with 50 ng/ml IFNγ overnight and 50 ng/ml LPS for the indicated durations. I, J RT‒qPCR analysis of Map1lc3b (J) and Ulk2 (K) mRNA decay in WT and Nudt21-cKO BMDMs at multiple time points (1 hour and 2 hours) after 5 μM actinomycin D (ActD) treatment (n = 3 per group). The error bars represent the standard errors of the means (SEMs). P values were determined by unpaired Student’s t-test
Fig. 6
Fig. 6
Nudt21 Impedes Autophagy’s Role in Reducing Inflammatory Cytokine Production. A, B Histograms displaying cytokine levels in BMDMs from WT and Nudt21-cKO mice primed with 50 ng/ml IFNγ overnight and 50 ng/ml LPS for 8 hours (n = 3 per group): (A) IL6 gMFI. (B) TNFα gMFI. ELISA results showing the IL6 (C) and TNFα (D) levels in the supernatants of the cultures primed with 50 ng/ml IFNγ overnight and 50 ng/ml LPS for 12 hours, with or without 100 nM BafA1. (n = 5 per group). RT‒qPCR analysis of cytokine mRNA levels in BMDMs primed with 50 ng/ml IFNγ overnight and 50 ng/ml LPS for 8 hours: (E) IL6 mRNA levels (n = 3 per group). (F) TNFα mRNA levels (n = 3 per group). G Immunoblot analysis of phosphorylated IKKα/β, total IKKα, total IKKβ, phosphorylated NF-κB p65 (p-p65), total p65, p62, LC3, and NUDT21 levels in WT and Nudt21-cKO BMDMs primed with 50 ng/ml IFNγ overnight and 50 ng/ml LPS, with or without 100 nM BafA1, for the indicated durations. β-ACTIN was used as the loading control. The error bars represent the standard errors of the means (SEMs). P values were determined by unpaired Student’s t-test

References

    1. Meizlish ML, Franklin RA, Zhou X, Medzhitov R. Tissue homeostasis and inflammation. Annu Rev Immunol 2021;39:557–81. - PubMed
    1. McInnes IB, Gravallese EM. Immune-mediated inflammatory disease therapeutics: past, present and future. Nat Rev Immunol 2021;21:680–6. - PMC - PubMed
    1. Grom AA, Horne A, De Benedetti F. Macrophage activation syndrome in the era of biologic therapy. Nat Rev Rheumatol 2016;12:259–68. - PMC - PubMed
    1. Soy M, Atagündüz P, Atagündüz I, Sucak GT. Hemophagocytic lymphohistiocytosis: a review inspired by the COVID-19 pandemic. Rheumatol Int 2021;41:7–18. - PMC - PubMed
    1. Austermann J, Roth J, Barczyk-Kahlert K. The good and the bad: monocytes’ and macrophages’ diverse functions in inflammation. Cells. 2022;11:1979. - PMC - PubMed