. 2024 Dec;636(8041):172-181.
doi: 10.1038/s41586-024-08163-9. Epub 2024 Nov 13.

Adult skull bone marrow is an expanding and resilient haematopoietic reservoir

Affiliations

Adult skull bone marrow is an expanding and resilient haematopoietic reservoir

Bong Ihn Koh et al. Nature. 2024 Dec.

Abstract

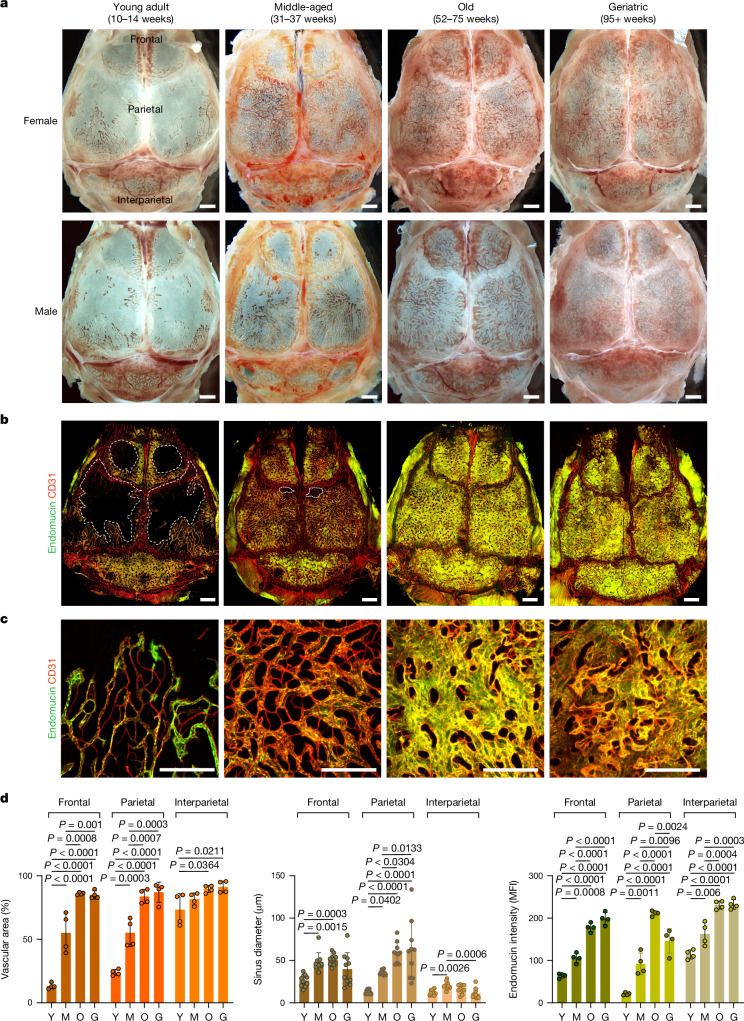
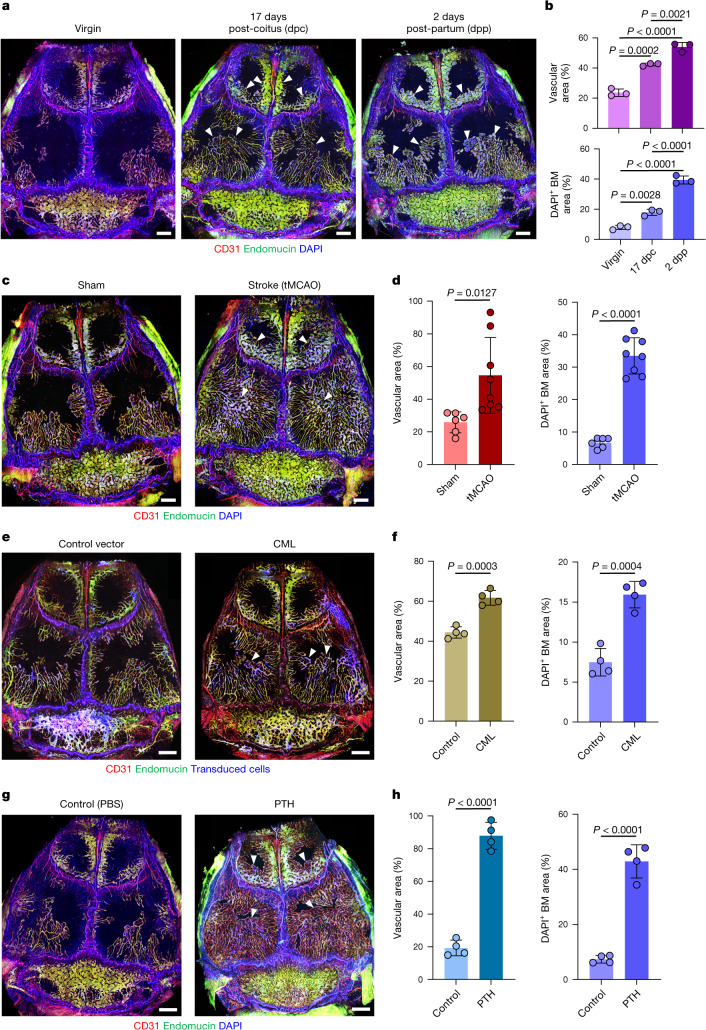
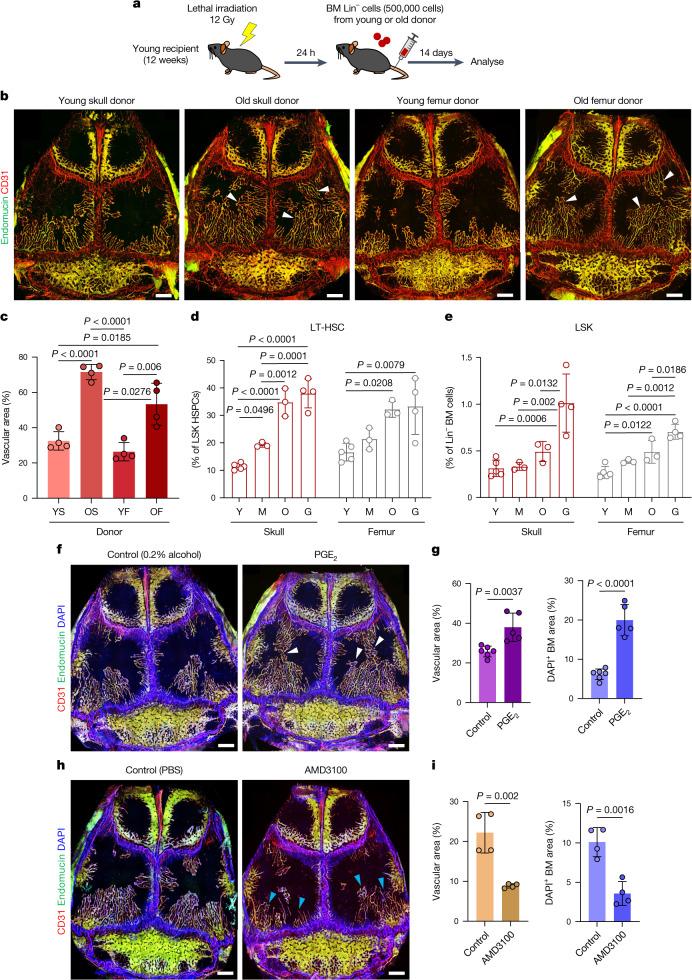
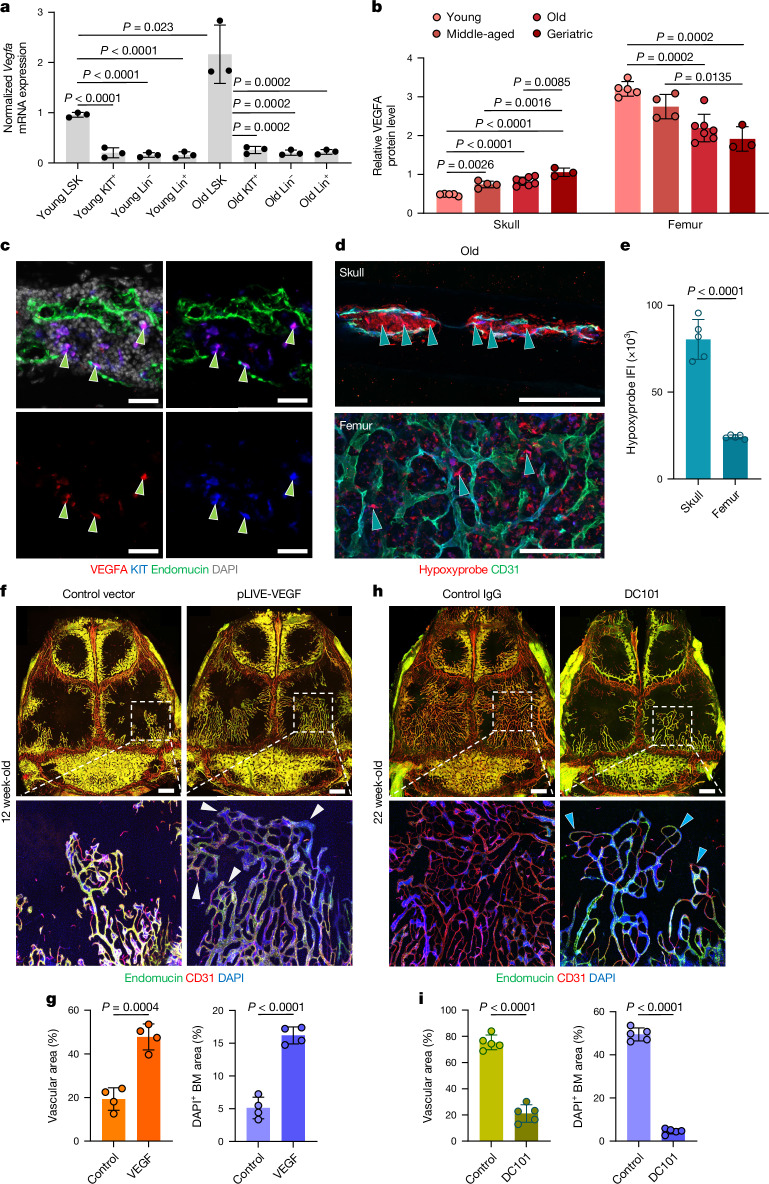
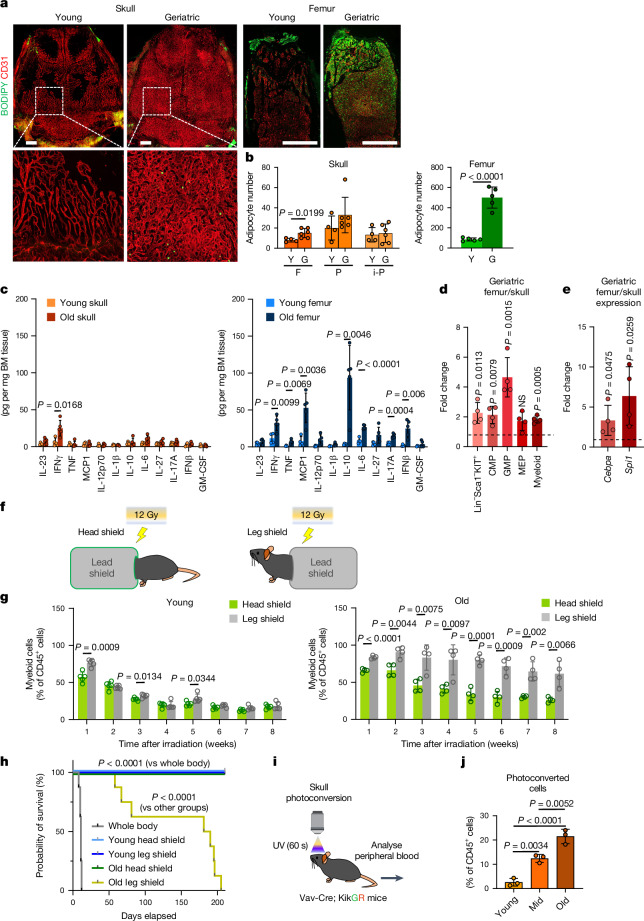
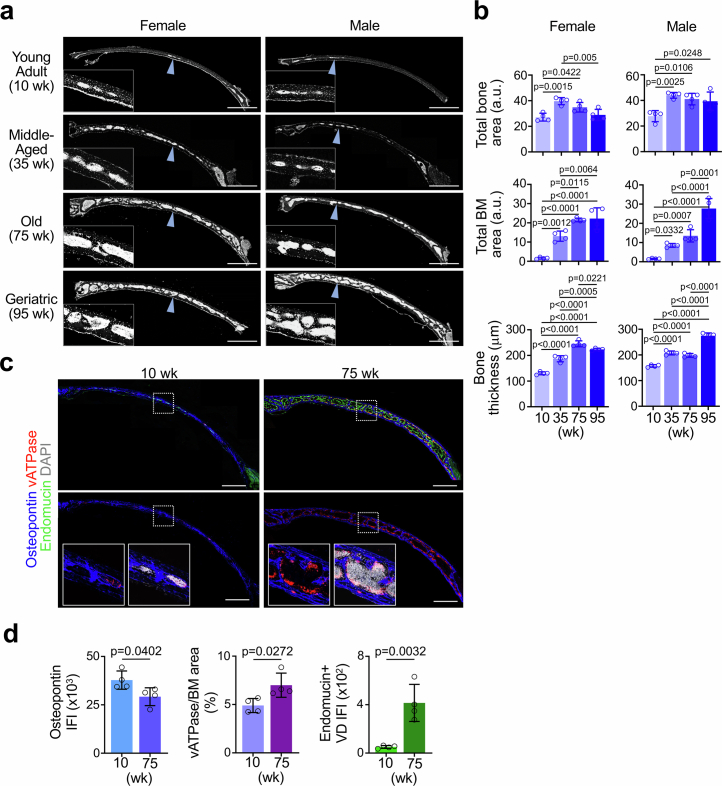
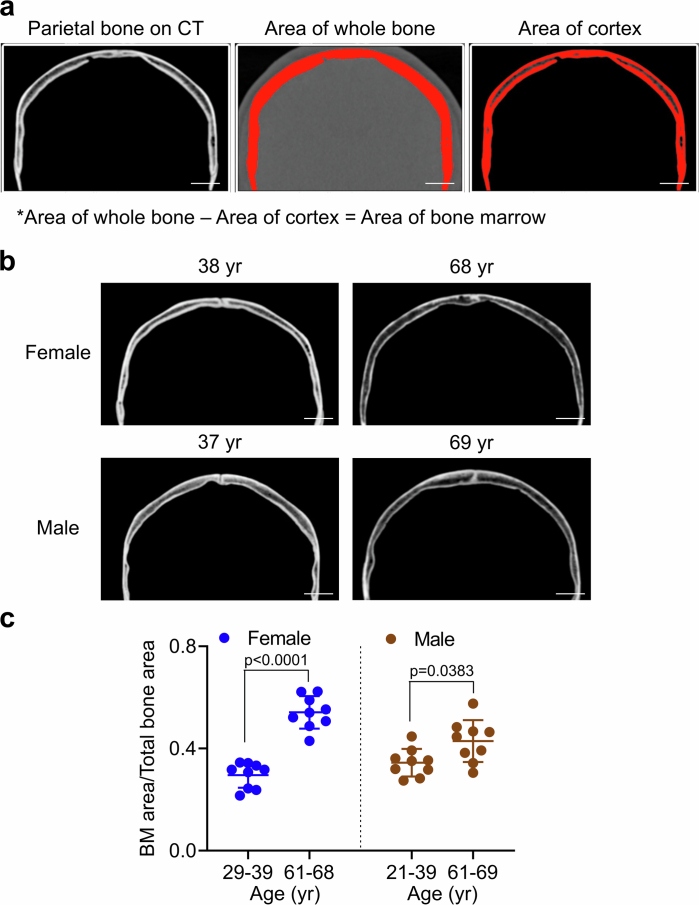
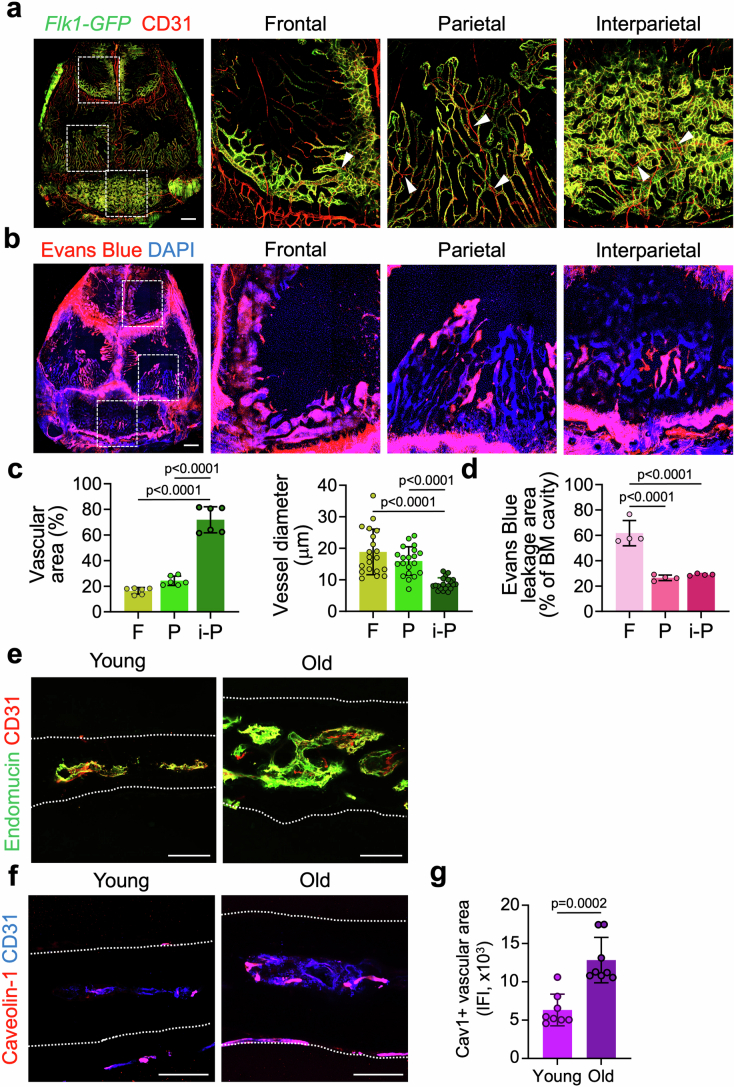
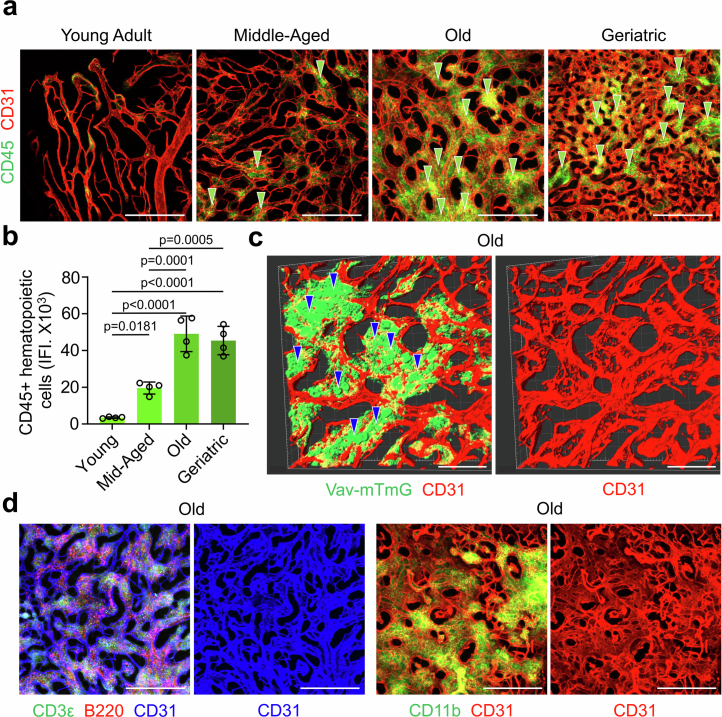
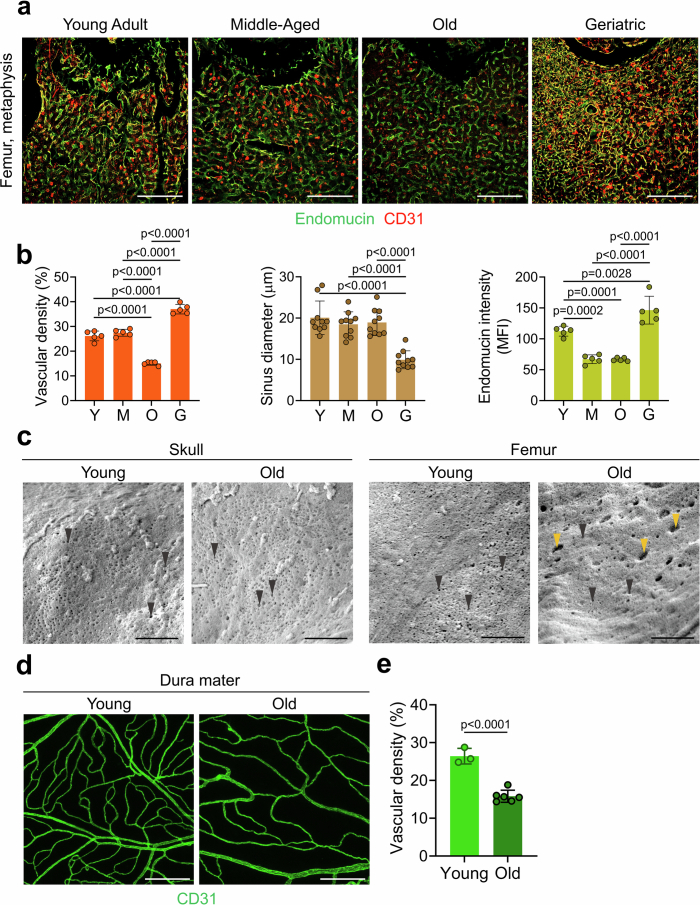
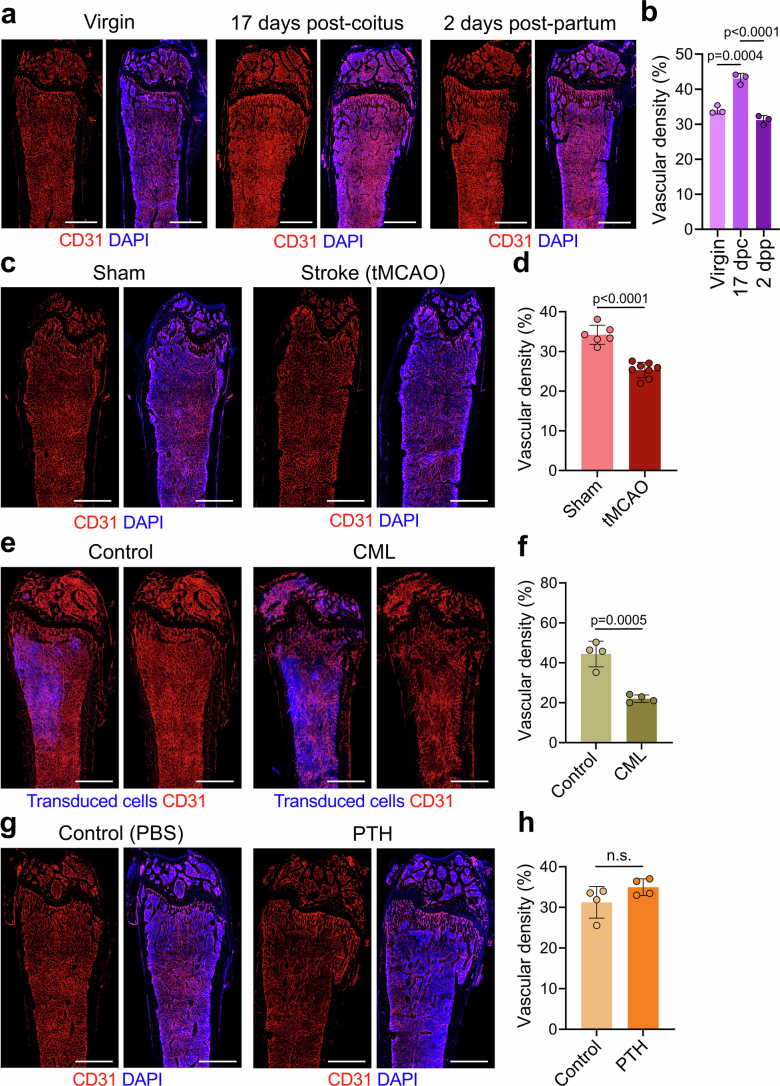
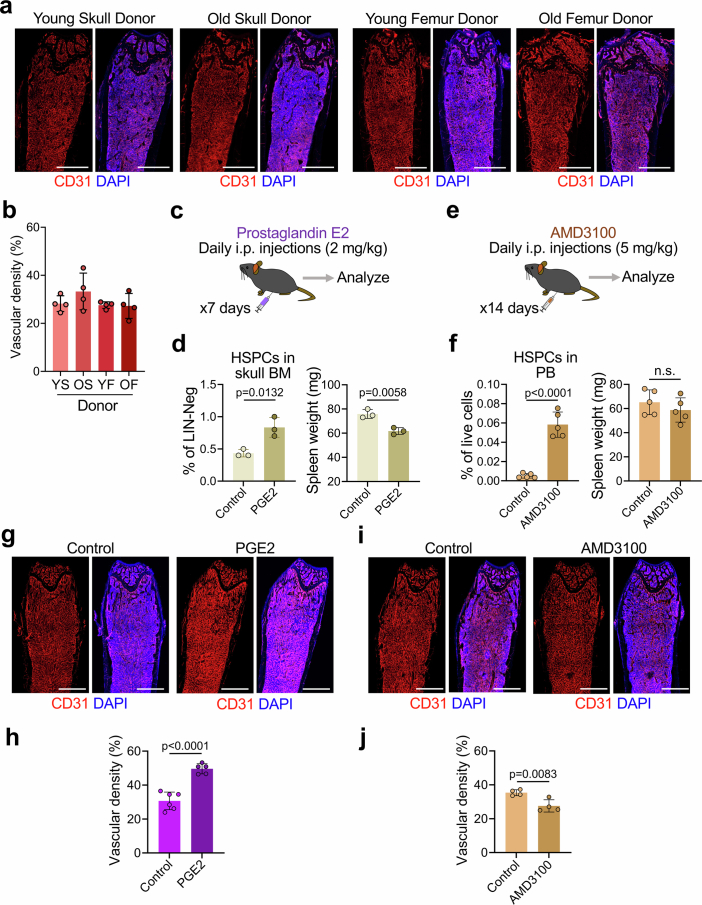
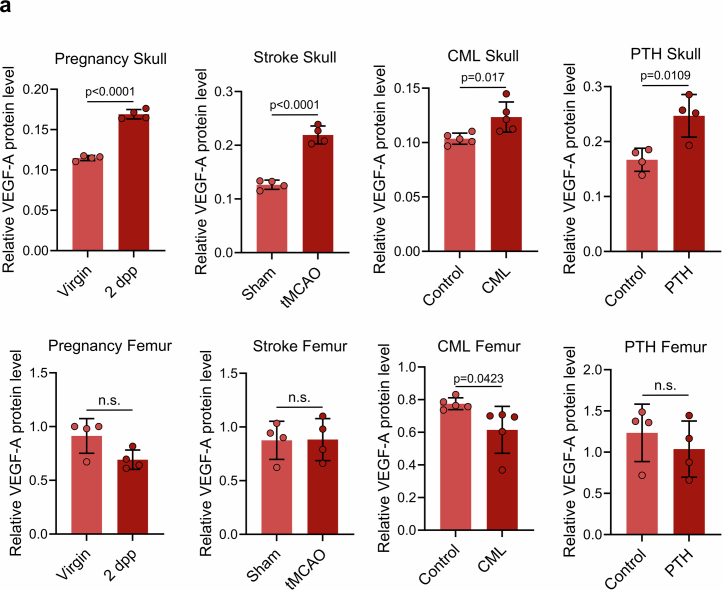
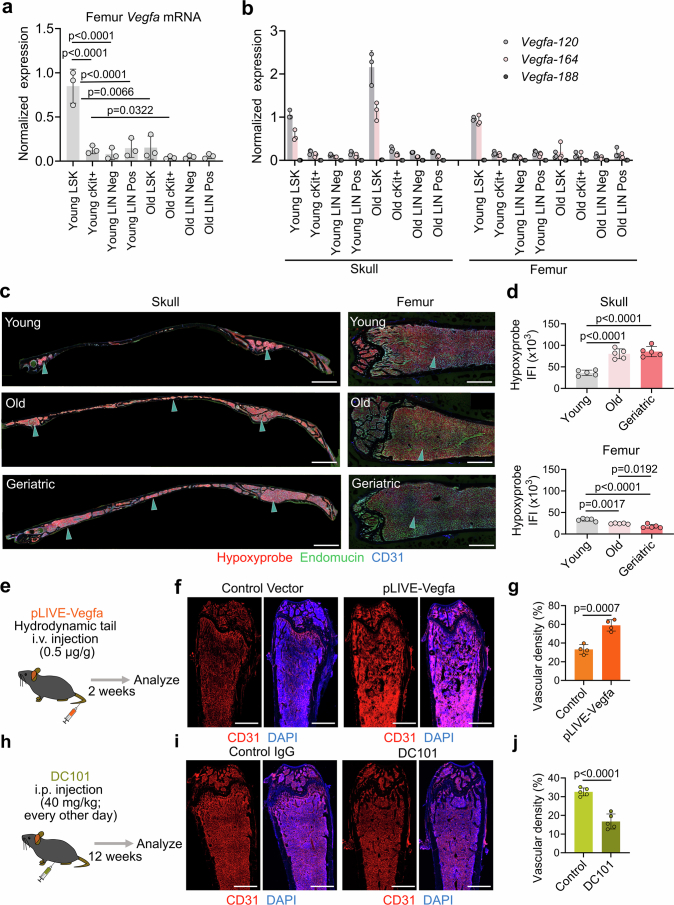
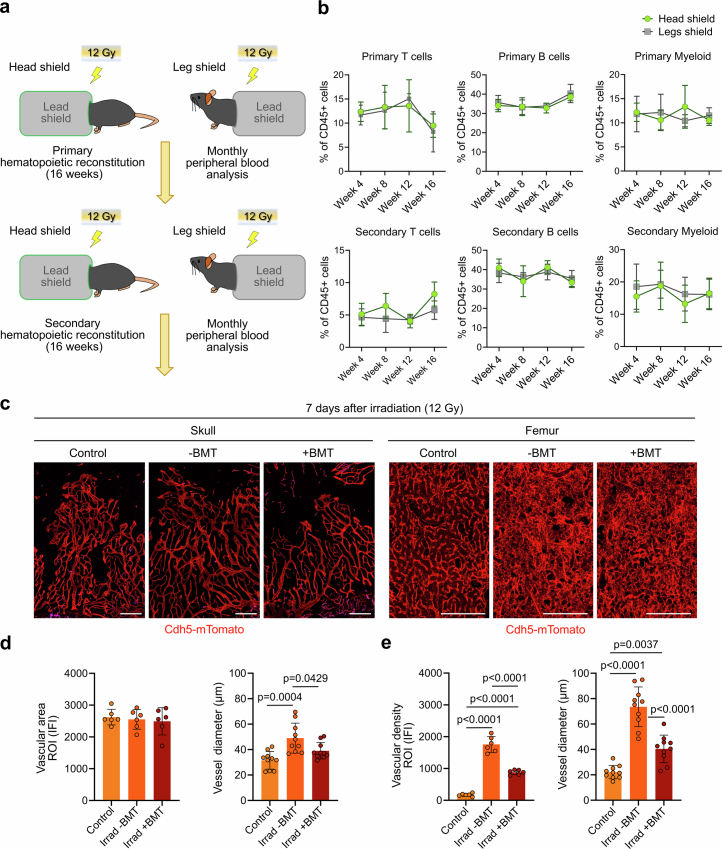
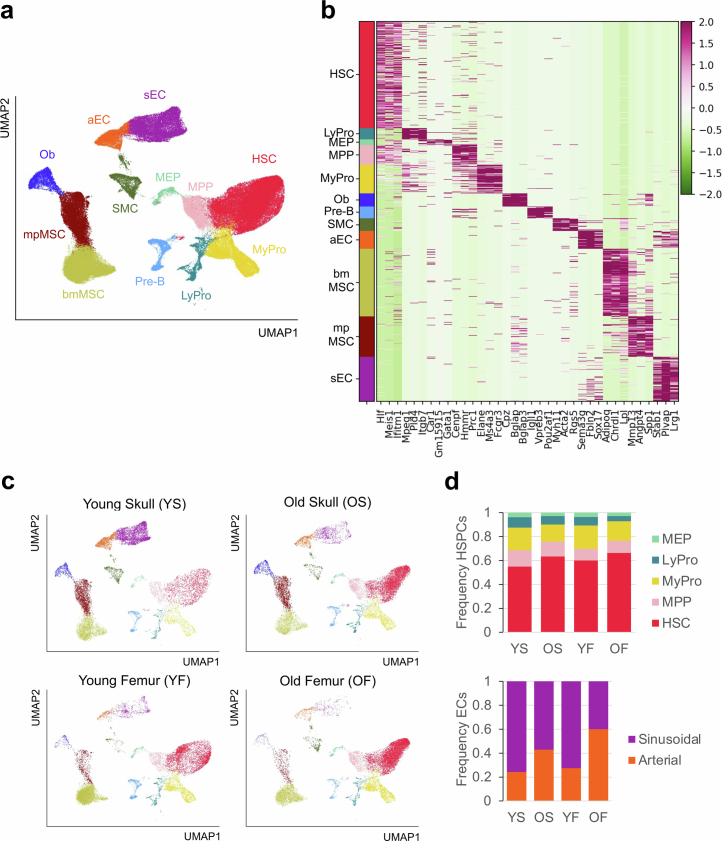
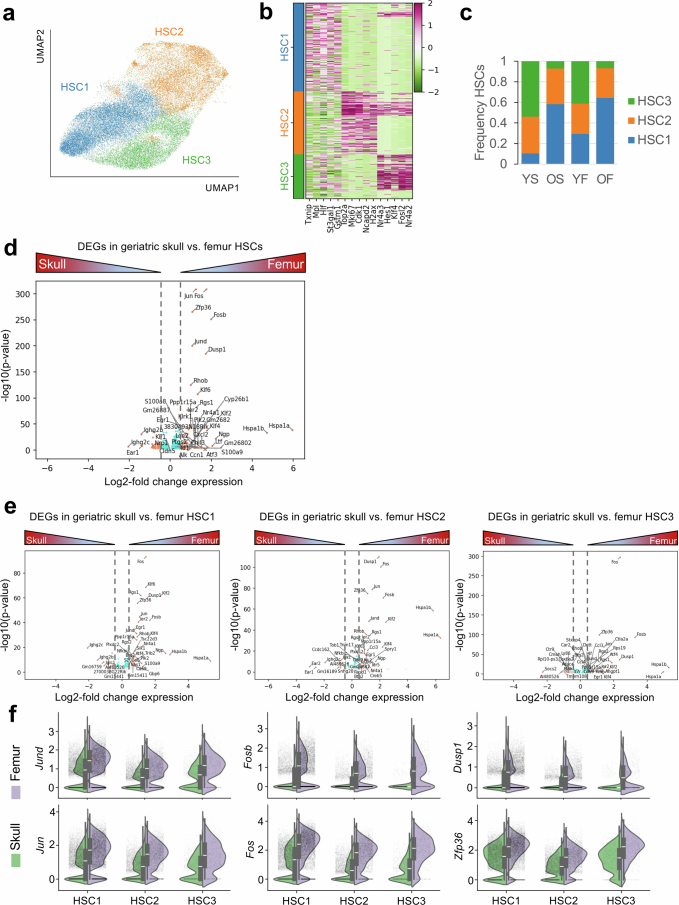
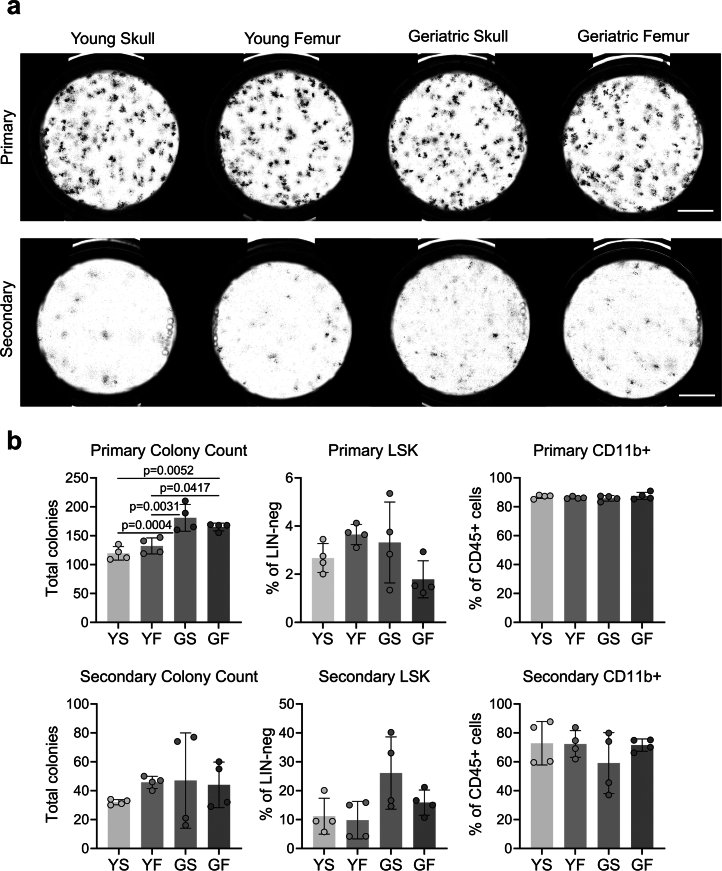
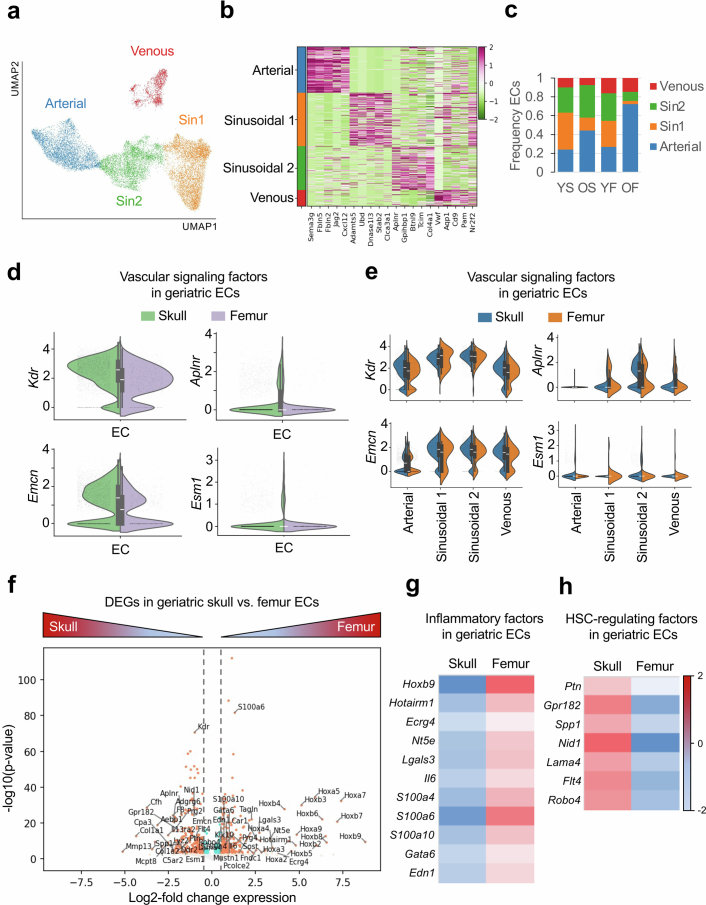
The bone marrow microenvironment is a critical regulator of haematopoietic stem cell self-renewal and fate1. Although it is appreciated that ageing, chronic inflammation and other insults compromise bone marrow function and thereby negatively affect haematopoiesis2, it is not known whether different bone compartments exhibit distinct microenvironmental properties and functional resilience. Here we use imaging, pharmacological approaches and mouse genetics to uncover specialized properties of bone marrow in adult and ageing skull. Specifically, we show that the skull bone marrow undergoes lifelong expansion involving vascular growth, which results in an increasing contribution to total haematopoietic output. Furthermore, skull is largely protected against major hallmarks of ageing, including upregulation of pro-inflammatory cytokines, adipogenesis and loss of vascular integrity. Conspicuous rapid and dynamic changes to the skull vasculature and bone marrow are induced by physiological alterations, namely pregnancy, but also pathological challenges, such as stroke and experimental chronic myeloid leukaemia. These responses are highly distinct from femur, the most extensively studied bone marrow compartment. We propose that skull harbours a protected and dynamically expanding bone marrow microenvironment, which is relevant for experimental studies and, potentially, for clinical treatments in humans.


Conflict of interest statement

Competing interests: The authors declare no competing interests.

Figures

Fig. 1
Fig. 1. Age-related expansion of blood vessels in adult skull.
a. Transverse view of mouse skull at the indicated stages of adulthood and ageing. Scale bars, 1 mm. b,c, In vivo immunofluorescence staining of blood vessels in skull showing substantial vascular expansion (b) and changes in vessel branching and morphology (c). Representative images from three independent experiments. Scale bars, 1 mm (b) and 500 μm (c). d, Quantification of vascular area, diameter and endomucin expression in different skull parts from young (Y), middle-aged (M), old (O) and geriatric (G) mice. For vascular area and endomucin expression, each dot indicates a value from 1 mouse and n = 4 mice per group from 3 independent experiments. For sinus diameter, each dot indicates a randomly selected vessel from all four mice. Data are mean ± s.d. P values from Tukey multiple comparison test (one-way analysis of variance (ANOVA)). MFI, mean fluorescence intensity. Source Data
Fig. 2
Fig. 2. Pathophysiological regulation of vessel growth and BM expansion in adult skull.
a,b, In vivo immunofluorescence (a) and quantification (b) of skull blood vessels and BM in pregnant (17 dpc) and postpartum (2 dpp) female mice. n = 3 mice per group from 3 independent experiments. c,d, In vivo immunofluorescence (c) and quantification (d) of skull blood vessels and BM in mice 7 days after transient mid-cerebral artery occlusion. n = 6 (sham) and n = 8 (tMCAO) mice per group from 3 independent experiments. e,f, In vivo immunofluorescence (e) and quantification (f) of skull blood vessels and BM in mice with CML. n = 4 mice per group from 3 independent experiments. g,h, In vivo immunofluorescence (g) and quantification (h) of skull blood vessels and BM in mice with 28-day sustained PTH treatment. n = 4 mice per group from 3 independent experiments. Arrowheads indicate areas of substantial expansion. Scale bars, 1 mm. Data are mean ± s.d. P values by Tukey multiple comparison test (one-way ANOVA) and two-tailed unpaired Student’s t-test. Source Data
Fig. 3
Fig. 3. Regulation of calvarial vessels by haematopoietic cells.
a, Experimental scheme for lethal irradiation and transplantation of haematopoietic lineage-depleted BM population isolated from young or old donor mice. b,c, In vivo immunofluorescence (b) and quantification (c) of skull blood vessels and BM in transplanted mice showing increased vascular expansion in recipients receiving Lin cells from old donors. n = 4 mice per group from 3 independent experiments. Arrowheads indicate areas of substantial BM vascular expansion. YS, young adult skull; OS, old skull; YF, young adult femur; OF, old femur. d,e, Quantification of HSPCs in young adult, middle-aged, old and geriatric skull and femur by FACS. n = 5 (young adult), n = 3 (middle-aged and old) and n = 4 (geriatric) mice per group from 3 independent experiments. fi, In vivo immunofluorescence staining (f,h) and quantification (g,i) of skull blood vessels and BM in mice treated with PGE2 or AMD3100 to promote HSPC expansion or mobilization, respectively. n = 6 (PGE2 control), n = 5 (PGE2) and n = 4 (all other groups) mice per group from 3 independent experiments. Arrowheads indicate areas of substantial BM expansion (white) and regression (blue). Scale bars, 1 mm. Data are mean ± s.d. P values by two-tailed unpaired Student’s t-test and Tukey multiple comparison test (one-way ANOVA). Source Data
Fig. 4
Fig. 4. Role of VEGF in calvarial vascular growth.
a, RT–qPCR analyses of Vegfa mRNA expression in FACS-sorted LSK (LinSca1+KIT+), KIT+ (LinSca1KIT+), lineage-negative (LinSca1KIT) and lineage-positive (Lin+) populations isolated from young or old skull BM. n = 5 pooled mice per sample from 3 independent experiments. b, VEGFA protein concentrations in total BM lysates from skull or femur isolated at various stages of adulthood and ageing. n = 5 young, n = 4 middle-aged, n = 7 old and n = 3 geriatric mice per group from 3 independent experiments. c, Immunofluorescence of skull BM sections showing high anti-VEGFA signal in KIT+ HSPCs (arrowheads). Representative images from three independent experiments. Scale bars, 20 μm. d,e, Immunofluorescence (d) and quantification (e) of intravenously injected Hypoxyprobe in old skull or femoral BM. n = 5 mice per group from 2 independent experiments. Arrowheads indicate labelled cells. Scale bars, 200 μm. IFI, integrated fluorescence intensity. f,g, In vivo immunofluorescence (f) and quantification (g) of calvarial blood vessels in mice expressing bone-homing VEGFA. Note the substantial increase in BM and expansion of vessels (arrowheads) and vascular area. n = 4 mice per group from 3 independent experiments. Scale bars, 1 mm. h,i, In vivo immunofluorescence (h) and quantification (i) of calvarial blood vessels in mice treated with VEGFR2 blocking antibody (DC101) for 12 weeks, showing profound inhibition of BM expansion, suppressed vessel growth (arrowheads) and with decrease in vascular diameter. n = 5 mice per group from 2 independent experiments. Scale bars, 1 mm. Data are mean ± s.d. P values by Tukey multiple comparison test (one-way ANOVA) and two-tailed unpaired Student’s t-test. Source Data
Fig. 5
Fig. 5. Properties and function of ageing skull marrow.
a,b, Staining (a) and quantification (b) of adipocytes (BODIPY) and blood vessels (CD31) in skull or femoral BM of young or geriatric mice. Scale bars, 1 mm. n = 4 (young skull), n = 6 (old skull), n = 5 (all other groups) mice per group from 4 independent experiments. F, frontal; P, parietal; i-P, interparietal. c, Quantification of inflammatory cytokines by multiplex array analysis of total BM lysates from young or old skull or femur. n = 4 (young skull), n = 5 (old skull), n = 4 (young femur), n = 5 (old femur) mice per group from 2 independent experiments. d,e, Quantification of myeloid progenitors and progeny by FACS (d; difference in percentage of live cells) and RT–qPCR analyses of myeloid determination factors (e) of geriatric skull versus femur BM. LinSca1KIT+, common myeloid progenitor (CMP), granulocyte-monocyte progenitor (GMP), megakaryocyte-erythrocyte progenitor (MEP). Each value is the fold change difference between geriatric femur sample and corresponding skull sample from the same mouse. n = 4 mice per group from 2 independent experiments. f,g, Scheme of shielding experiments (f) and FACS analysis of CD11b+ myeloid cells in peripheral blood (g) isolated from mice with head versus leg shielding. n = 5 (young) and n = 4 (old) mice per group from 3 independent experiments. h, Kaplan–Meier survival plot showing survival of mice after whole-body irradiation or shielding skull or hindlimbs. n = 8 mice per group from 2 independent experiments. i, Schematic showing skull BM photoconversion in Vav-cre;Rosa26-KikGR mice. j, FACS analysis of photoconverted CD45+ haematopoietic cells in peripheral blood. n = 3 mice per group from 3 independent experiments. Data are mean ± s.d. P values by two-tailed unpaired Student’s t-test, log-rank test and Tukey multiple comparison test (one-way ANOVA). Source Data
Extended Data Fig. 1
Extended Data Fig. 1. Age-dependent expansion of BM in skull.
a, b. DAPI staining and quantification of mouse skull coronal cryosections showing expansion of BM cellular content during adulthood and aging (n = 4 mice/group from three independent experiments). Blue arrowheads indicate location of magnified inset. c, d. IF staining and quantification of skull coronal cryosections showing increased vATPase+ activated osteoclasts attached to Osteopontin+ bone surfaces in old versus young specimen (n = 4 mice/group from two independent experiments). Scale bars, 1 mm. Vertical bars indicate mean ± SD. P values were calculated using Tukey multiple comparison test (one-way ANOVA) and two-tailed unpaired Student’s t-test. Source Data
Extended Data Fig. 2
Extended Data Fig. 2. Age-related expansion of diploic space in human skull.
a. Method for quantification of whole bone, cortex and bone marrow areas in human patient CT scans. b, c. Representative coronal CT images (b) and quantification (c) of young (21–40 years old) and old (61–69 years old) female and male human skulls showing enlargement of diploic space with aging (n = 9 patients/group). Scale bars, 2 cm. Vertical bars indicate mean ± SD. P values were calculated using two-tailed unpaired Student’s t-test. Source Data
Extended Data Fig. 3
Extended Data Fig. 3. Regional differences and expansion of skull BM.
a, c. In vivo IF staining (a) and quantification of BM vessels (c) in Flk1-GFP reporter mice showing distinct blood vessel architecture in frontal (F), parietal (P) and interparietal (i-P) skull. Arrowheads indicate Flk1low/− CD31+ arterioles. n = 6 mice/group for vascular area, n = 20 randomly selected vessels from all samples/group for vessel diameter from two independent experiments. Boxed areas in overview image (left) indicate location of magnified images. Scale bar, 1 mm. b, d. Imaging (b) and quantification (d) of Evans Blue vascular leakage in different skull bone parts (n = 4 mice/group from three independent experiments). Boxed areas in overview image (left) indicate location of magnified images. Scale bar, 1 mm. e. IF staining of skull BM blood vessels showing increase in vascular network complexity with aging. Dotted lines demarcate dorsal and ventral skull boundaries. Representative images from four independent experiments. Scale bars, 100 μm. f, g. IF staining and quantification of caveolin-1-positive (Cav1+) blood vessels showing an increase with aging (n = 8 mice/group from two independent experiments). Dotted lines demarcate dorsal and ventral boundaries of the skull. Scale bars, 100 μm. Vertical bars indicate mean ± SD. P values were calculated using Tukey multiple comparison test (one-way ANOVA) and two-tailed unpaired Student’s t-test. Source Data
Extended Data Fig. 4
Extended Data Fig. 4. Association of vessels and hematopoietic cells in skull BM.
a, b. In vivo IF staining (a) and quantification (b) of CD45+ hematopoietic cells in skull BM during aging (n = 4 mice/group from three independent experiments). Green arrowheads indicate dense clusters of CD45+ cells. Scale bars, 500 μm. c. Genetic labeling of hematopoietic cells in Vav-Cre Rosa26-mTmG mice (Vav-mTmG) shows association (arrowheads) of GFP-expressing cells with large CD31+ vessels. Representative images from three independent experiments. Scale bars, 150 μm. d. Confocal images showing association of CD3ɛ+ T lymphocytes (green), B220+ B lymphocytes (red) and CD11b+ cells (green) with large-caliber CD31+ BM vessel in aged skull. Representative images from three independent experiments. Vertical bars indicate mean ± SD. P values were calculated using Tukey multiple comparison test (one-way ANOVA). Scale bars, 500 μm. Source Data
Extended Data Fig. 5
Extended Data Fig. 5. Age-related changes in the BM vasculature.
a, b. In vivo IF staining (a) and quantification (b) of femoral BM vessels showing vascular deterioration during aging by comparing young (Y), middle-aged (M), old (O), and geriatric (G) specimen (n = 5 mice/group for vascular density and Endomucin intensity, n = 10 randomly selected vessels from all samples/group from three independent experiments). Scale bars, 500 μm. c. Electron micrographs showing the surface of BM endothelial cells in young vs. old skull or femur, as indicated. Note regular pattern of fenestrations (black arrowheads) in young and old skull but disorganized pattern with larger gaps (yellow arrowheads) in old femur. Representative images from three independent experiments. Scale bars, 1 μm. d, e. IF staining (d) and quantification (e) of dural blood vessels revealing substantial decrease in vascular density with aging. n = 3 (young), n = 6 (old) mice/group from three independent experiments. Scale bars, 250 μm. Vertical bars indicate mean ± SD. P values were calculated using Tukey multiple comparison test (one-way ANOVA) and two-tailed unpaired Student’s t-test. Source Data
Extended Data Fig. 6
Extended Data Fig. 6. Pathophysiological changes in the femoral BM vasculature.
a, b. In vivo IF staining (a) and quantification (b) of femoral BM blood vessels in pregnant (17 dpc) and post-partum (2 dpp) female mice. n = 3 mice/group from three independent experiments. c, d. In vivo IF staining (c) and quantification (d) of femoral BM blood vessels in mice 7 days after transient mid-cerebral artery occlusion (tMCAO). n = 6 (sham), n = 8 (tMCAO) from three independent experiments. e, f. In vivo IF staining (e) and quantification (f) of femoral BM blood vessels in mice with chronic myeloid leukemia. n = 4 mice/group from three independent experiments. g, h. In vivo IF staining (g) and quantification (h) of femoral BM blood vessels in mice with 28-day sustained parathyroid hormone (PTH) treatment. n = 4 mice/group from three independent experiments. Scale bars, 1 mm. Vertical bars indicate mean ± SD. P values were calculated using Tukey multiple comparison test (one-way ANOVA) and two-tailed unpaired Student’s t-test. Source Data
Extended Data Fig. 7
Extended Data Fig. 7. Effect of treatments affecting HSPCs.
a, b. In vivo IF staining (a) and quantification (b) of femoral BM blood vessels in recipient mice receiving hematopoietic lineage-negative cells isolated from young or old donors (young skull (YS), old skull (OS), young femur (YF), old femur (OF)). n = 4 mice/group from three independent experiments. Scale bars, 1 mm. c, d. Diagram showing experimental scheme for PGE2 treatment for HSPC expansion (c) and quantification (d) of HSPCs in skull BM and spleen weight with PGE2 treatment (n = 3 mice/group from three independent experiments). e, f. Diagram showing experimental scheme for AMD3100 treatment for HSPC mobilization (e) and quantification (f) of HSPCs in peripheral blood and spleen weight with AMD3100 treatment (n = 5 mice/group from three independent experiments). g-j. In vivo IF staining (g, i) and quantification (h, j) of femoral BM blood vessels in mice treated with PGE2 (g, h) or AMD3100 (i, j) for HSPC expansion or mobilization, respectively. n = 6 (PGE2 Control), n = 5 (PGE2), n = 4 (all other groups) mice/group from three independent experiments. Scale bars, 1 mm. Vertical bars indicate mean ± SD. P values were calculated using two-tailed unpaired Student’s t-test. Source Data
Extended Data Fig. 8
Extended Data Fig. 8. VEGF-A response to pathophysiological conditions.
a. VEGF-A protein concentrations in total BM lysates from skull or femur isolated from mice in various pathophysiological conditions, including pregnancy, stroke, chronic myeloid leukemia and sustained PTH treatment. n = 4 (Pregnancy, Stroke and PTH) and n = 5 (CML) mice/group from two independent experiments. Vertical bars indicate mean ± SD. P values were calculated using two-tailed unpaired Student’s t-test. Source Data
Extended Data Fig. 9
Extended Data Fig. 9. VEGF expression and hypoxia in BM compartments.
a. qRT-PCR analyses of Vegfa mRNA in FACS-sorted LSK (LIN- Sca1+ cKit+), cKit+ (LIN- Sca1- cKit+), Lin neg (LIN- Sca1- cKit-) and Lin pos (LIN+) populations isolated from femur BM of young or old mice (n = 5 mice pooled/sample from three independent experiments). b. qRT-PCR analyses of Vegfa mRNA isoforms in populations shown in (a) isolated from skull or femur BM of young or old mice (n = 5 mice pooled/sample from three independent experiments). c, d. IF staining (c) and quantification (d) of IV-injected Hypoxyprobe in young, old and geriatric skull and femoral BM, as indicated. Note increase of Hypoxyprobe signal in skull but not in femur (arrowheads, n = 5 mice/group from two independent experiments). Scale bars, 1 mm. Vertical bars indicate mean ± SD. **P < 0.01, ***P < 0.001 versus Young LSK (a) or Young (d), #P < 0.05 versus Old by Tukey multiple comparison test (one-way ANOVA). e, h. Diagram showing experimental scheme for Vegfa overexpression or anti-VEGFR2 blocking antibody DC101 treatment. f-j. In vivo IF staining (f, i) and quantification (g, j) of femoral BM blood vessels in mice after hydrodynamic injection of bone-homing Vegfa construct (n = 4 mice/group from three independent experiments) (f, g) or treatment with anti-VEGFR2 blocking antibody (DC101) for 12 weeks (n = 5 mice/group from two independent experiments) (i, j). Scale bars, 1 mm. Vertical bars indicate mean ± SD. P values were calculated using two-tailed unpaired Student’s t-test. Source Data
Extended Data Fig. 10
Extended Data Fig. 10. Long-term reconstitution potential of skull HSCs.
a. Diagram showing experimental scheme for serial hematopoietic reconstitution following serial partial irradiation with shielding. b. Monthly FACS analysis of T, B, and myeloid cells in peripheral blood isolated from animals with head versus leg shielding during primary and secondary hematopoietic reconstitution (n = 5 (Head shield), n = 4 (Leg shield) mice/group from two independent experiments). Vertical bars indicate mean ± SD. c-e. Fluorescence imaging (c) and quantification (d, e) of skull or femoral BM blood vessels in Cdh5-mTnG (mTomato, red) reporter mice at 7 days after lethal irradiation with (+) or without (-) bone marrow transplantation (BMT), as indicated. Note minimal vascular alterations in the skull BM compared to substantial vascular changes in femoral BM (n = 6 mice/group for vascular area/density, n = 10 randomly selected vessels from all samples/group for vessel diameter from three independent experiments). Vertical bars indicate mean ± SD. P values were calculated using Tukey multiple comparison test (one-way ANOVA). Source Data
Extended Data Fig. 11
Extended Data Fig. 11. Single-cell RNA-sequencing analysis of HSPCs and stromal cells in skull and femur bone marrow during aging.
a. UMAP plot showing color-coded merged cell clusters of FACS-sorted cKit+ HSPCs and hematopoietic lineage-depleted bone marrow cells. Hematopoietic stem cell (HSC), multi-potent progenitor (MPP), myeloid progenitor (MyPro), lymphoid progenitor (LyPro), megakaryocyte-erythrocyte progenitor (MEP), pre-B-cell (Pre-B), sinusoidal endothelial cell (sEC), arterial endothelial cell (aEC), bone marrow mesenchymal stromal cell (bmMSC), metaphyseal mesenchymal stromal cell (mpMSC), smooth muscle cell (SMC), osteoblast (Ob). b. Heat map showing top cell marker genes of each cell population shown in (a). c. Group-selected color-coded cell clusters from young or old, skull or femur as indicated. d. Frequency plots of color-coded HSPCs (top) and endothelial cells (bottom) from young skull (YS), old skull (OS), young femur (YF), old femur (OF).
Extended Data Fig. 12
Extended Data Fig. 12. Single-cell RNA-sequencing analysis of HSCs in skull and femur bone marrow during aging.
a. UMAP plot showing color-coded merged cell clusters of HSCs identified in Extended Data Fig. 11. b. Heat map showing top cell marker genes of each cell population shown in (a). c. Frequency plots of color-coded HSCs from young skull (YS), old skull (OS), young femur (YF), old femur (OF). d. Differentially expressed genes (DEG) analysis comparing HSCs from geriatric skull versus femur. e. DEG analysis comparing each HSC subcluster from geriatric skull versus femur. f. Violin plots showing the expression of selected genes with log normalized values for inflammatory and myeloid determination factors in each HSC subcluster identified in (a). Skull HSC1 (n = 6216 cells), HSC2 (n = 3713 cells), HSC3 (n = 768 cells) and Femur HSC1 (n = 6726 cells), HSC2 (n = 3006 cells), HSC3 (n = 719 cells) isolated from n = 5 mice from two independent experiments. The box of each boxplot starts in the first quartile and ends in the third, with the line inside representing the median. Blue dots, p-adjusted value < 0.01 and Log2 fold change <0.5; orange dots, p-adjusted value < 0.01 and Log2 fold change > 0.5 by two-tailed unpaired Student’s t-test.
Extended Data Fig. 13
Extended Data Fig. 13. HSPCs are dependent on microenvironment during aging.
a, b. Brightfield image (a) and quantification (b) of primary and secondary colony forming unit (CFU) assays of 500 FACS-sorted LSK cells isolated from young or geriatric skull or femur bone marrow (n = 4 mice/group from two independent experiments). Scale bar, 5 mm. Vertical bars indicate mean ± SD. P values were calculated using Tukey multiple comparison test (one-way ANOVA). Source Data
Extended Data Fig. 14
Extended Data Fig. 14. Single-cell RNA-sequencing analysis of ECs in skull and femur bone marrow during aging.
a. UMAP plot showing color-coded merged cell clusters of ECs identified in Extended Data Fig. 11. b. Heat map showing top cell marker genes of each cell population shown in (a). c. Frequency plots of color-coded ECs from young skull (YS), old skull (OS), young femur (YF), old femur (OF). d, e. Violin plots showing the expression of selected genes with log normalized values for vascular signaling factors in ECs (d) and each EC subcluster (e) from geriatric skull versus femur. Skull ECs (n = 2414 cells), Arterial (n = 1070 cells), Sinusoidal 1 (n = 329 cells), Sinusoidal 2 (n = 833 cells), Venous (n = 182 cells) and Femur ECs (n = 594 cells), Arterial (n = 430 cells), Sinusoidal 1 (n = 19 cells), Sinusoidal 2 (n = 58 cells), Venous (n = 87 cells) isolated from n = 5 mice from two independent experiments. The box of each boxplot starts in the first quartile and ends in the third, with the line inside representing the median. f. Differentially expressed genes (DEG) analysis comparing ECs from geriatric skull versus femur. g, h. Heat map showing the expression of selected genes with log normalized values for inflammatory factors (g) and HSC-regulating factors (h) identified in (f). Blue dots, p-adjusted value < 0.01 and Log2 fold change <0.5; orange dots, p-adjusted value < 0.01 and Log2 fold change > 0.5 by two-tailed unpaired Student’s t-test.

References

    1. Hoggatt, J., Kfoury, Y. & Scadden, D. T. Hematopoietic stem cell niche in health and disease. Annu. Rev. Pathol.11, 555–581 (2016). - PubMed
    1. Verovskaya, E. V., Dellorusso, P. V. & Passegue, E. Losing sense of self and surroundings: hematopoietic stem cell aging and leukemic transformation. Trends Mol. Med.25, 494–515 (2019). - PMC - PubMed
    1. Comazzetto, S., Shen, B. & Morrison, S. J. Niches that regulate stem cells and hematopoiesis in adult bone marrow. Dev. Cell56, 1848–1860 (2021). - PMC - PubMed
    1. van den Bos, T., Speijer, D., Bank, R. A., Bromme, D. & Everts, V. Differences in matrix composition between calvaria and long bone in mice suggest differences in biomechanical properties and resorption: Special emphasis on collagen. Bone43, 459–468 (2008). - PubMed
    1. Sivaraj, K. K. & Adams, R. H. Blood vessel formation and function in bone. Development143, 2706–2715 (2016). - PubMed

MeSH terms