. 2024 Nov;635(8039):647-656.
doi: 10.1038/s41586-024-08186-2. Epub 2024 Nov 13.

Releasing a sugar brake generates sweeter tomato without yield penalty

Affiliations

Releasing a sugar brake generates sweeter tomato without yield penalty

Jinzhe Zhang et al. Nature. 2024 Nov.

Abstract

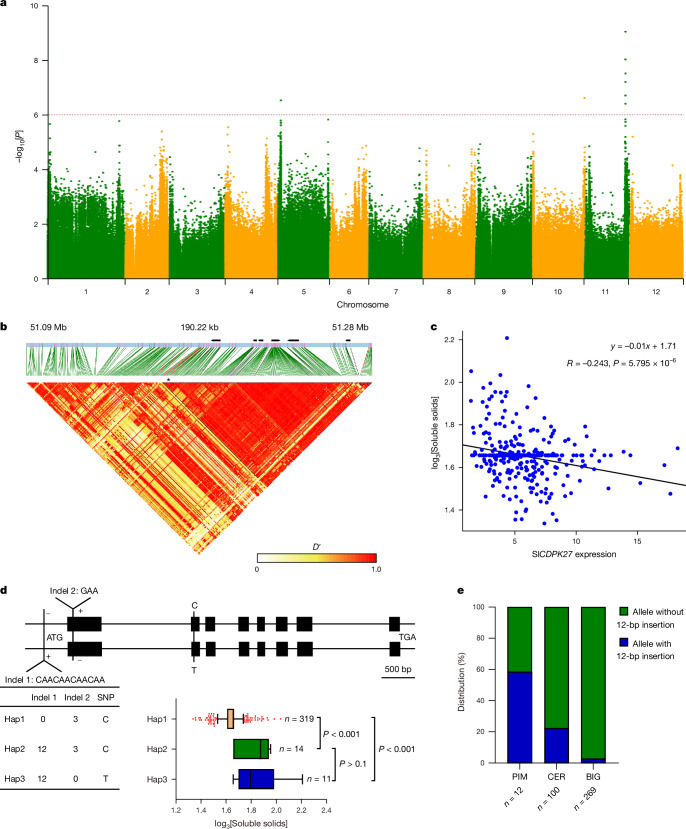
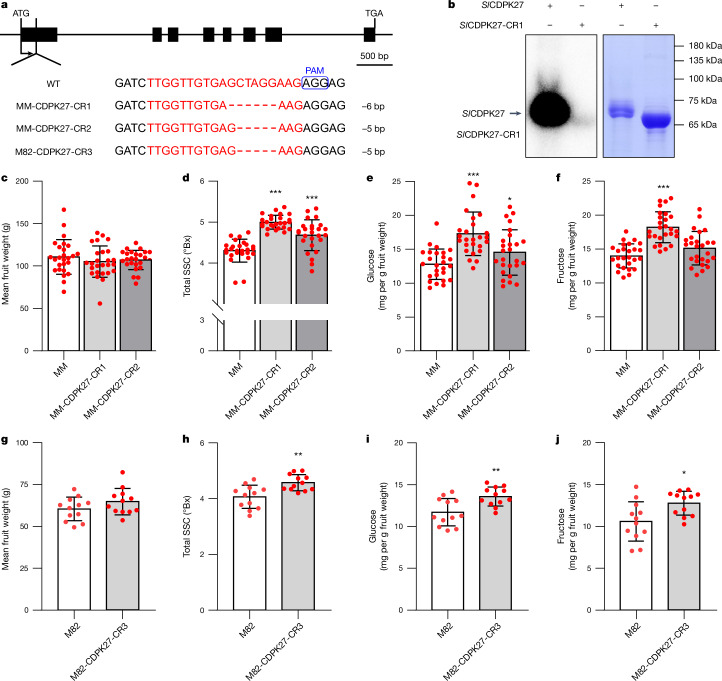
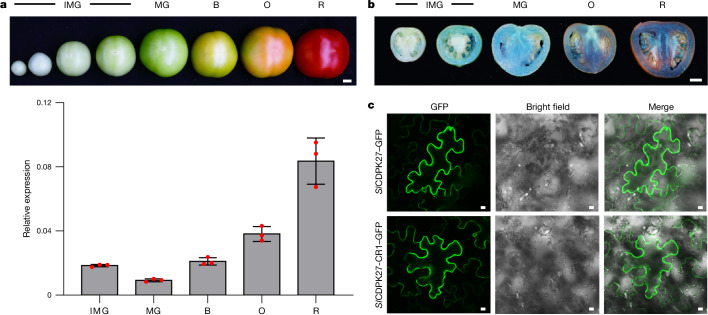
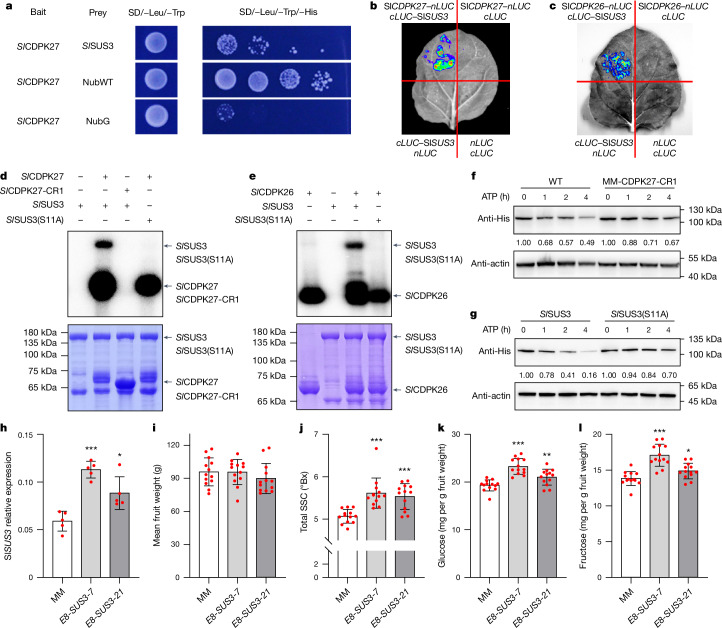
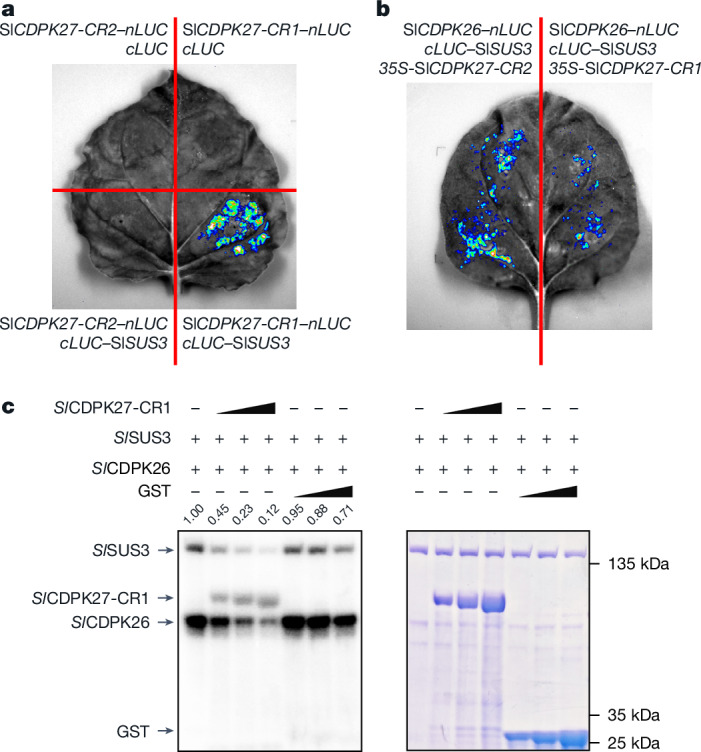
In tomato, sugar content is highly correlated with consumer preferences, with most consumers preferring sweeter fruit1-4. However, the sugar content of commercial varieties is generally low, as it is inversely correlated with fruit size, and growers prioritize yield over flavour quality5-7. Here we identified two genes, tomato (Solanum lycopersicum) calcium-dependent protein kinase 27 (SlCDPK27; also known as SlCPK27) and its paralogue SlCDPK26, that control fruit sugar content. They act as sugar brakes by phosphorylating a sucrose synthase, which promotes degradation of the sucrose synthase. Gene-edited SlCDPK27 and SlCDPK26 knockouts increased glucose and fructose contents by up to 30%, enhancing perceived sweetness without fruit weight or yield penalty. Although there are fewer, lighter seeds in the mutants, they exhibit normal germination. Together, these findings provide insight into the regulatory mechanisms controlling fruit sugar accumulation in tomato and offer opportunities to increase sugar content in large-fruited cultivars without sacrificing size and yield.


Conflict of interest statement

Competing interests: A patent on the use of SlCDPK27 and SlCDPK26 to improve fruit sugar content has been filed by S.H., J.Z., H.L., J.C. and G.Z. (CN202211616622.8; PCT/CN2023/138699). The other authors declare no competing interests.

Figures

Fig. 1
Fig. 1. Identification and characterization of SlCDPK27.
a, Manhattan plot of SNPs associated with total SSC. The y axis shows the −log scale of P values, which was determined using a mixed linear model with a binomial test, implemented in EMMAX. The dotted line denotes the threshold for statistical significance: 1.0 × 10−6 for GWAS. b, Linkage disequilibrium plot for SNPs in the 190-kb interval surrounding the leading SNP. Black bars, genes. Asterisk, position of the leading SNP. The colour key (white to red) represents linkage disequilibrium values (D′). c, Correlation between SlCDPK27 expression levels and total SSCs in tomato. The Pearson correlation coefficient (R) and its corresponding P value, which was calculated from a two-sided test, are indicated at the top. d, Haplotypes of SlCDPK27 among tomato natural variations. In the box plots, the boxes represent the interquartile range, the line in the middle of each box represents the median, the whiskers represent the interquartile range and the dots represent outlier points; n indicates the number of accessions belonging to each haplotype. P values were derived by one-way analysis of variance. e, Allele distribution of the 12-bp insertion in PIM, CER and BIG groups. n indicates the number of accessions in each group. Source data
Fig. 2
Fig. 2. SlCDPK27 regulates tomato fruit sugar content.
a, Generation of mutations in SlCDPK27 by CRISPR–Cas9, using a single-guide RNA. Sequences of SlCDPK27 in wild-type (WT) and MM-CDPK27-CR1, MM-CDPK27-CR2 and M82-CDPK27-CR3 mutant plants are shown. The sequences targeted by the single-guide RNA are indicated in red, and the protospacer adjacent motif (PAM) sequence is outlined in blue. The deletion is indicated by a dashed line. b, In vitro kinase assays verified SlCDPK27 is a bona fide kinase, and the L62 and G63 residues absent in SlCDPK27-CR1 would disrupt its kinase activity. Left, autoradiograph; right, Coomassie brilliant blue staining. c, Fruit weight of MM-CDPK27-CR1 and MM-CDPK27-CR2 was not significantly different from that of wild-type plants. df, Both MM-CDPK27-CR1 and MM-CDPK27-CR2 exhibited increased total SSC (d) and glucose (e) and fructose (f) contents, compared to wild-type plants. Values are means ± s.d. (n = 26 independent replicates). g, Fruit weight of M82-CDPK27-CR3 was not significantly different from that of wild-type plants. hj, M82-CDPK27-CR3 exhibited increased total SSC (h) and glucose (i) and fructose (j) contents. Values are means ± s.d. (n = 12 independent replicates). In cj, a two-tailed Student’s t-test was used to determine P values. *P < 0.05, **P < 0.01, ***P < 0.001, compared to wild-type (MM or M82) plants. Source data
Fig. 3
Fig. 3. The expression pattern and subcellular localization of SlCDPK27.
a, Relative expression of SlCDPK27 at different fruit developmental stages (shown at the top), as calculated relative to the internal reference (SlACTIN). R, ripe; O, orange; B, breaker; MG, mature green; IMG, immature green. Scale bar, 1 cm. Values are means ± s.d. (n = 3 independent replicates). b, Analysis of SlCDPK27 expression pattern based on GUS staining. SlCDPK27 was expressed at the highest level in the ripe fruits. Scale bar, 1 cm. c, Subcellular localization of transiently expressed SlCDPK2–GFP and SlCDPK27-CR1–GFP fusion protein in N.benthamiana leaves. Scale bars, 10 μm. The subcellular localization assay was repeated three times with similar results. Source data
Fig. 4
Fig. 4. SlCDPK26 is functionally redundant to SlCDPK27.
a, Phylogenetic analysis of SlCDPK class III family members, based on the maximum-likelihood method. b, Relative SlCDPK26 expression at different fruit developmental stages, as calculated relative to the internal reference (SlACTIN). Values are means ± s.d. (n = 3 independent replicates). c, Fruits of wild-type, MM-CDPK27-CR1, MM-CDPK27-CR2 and MM-CDPK27-CR2/MM-CDPK26-CR1 double-mutant plants at different fruit developmental stages. Scale bar, 1 cm. dg, Comparison of fruit weight (d), total SSC (e), fruit yield (f) and fruit number (g) between wild-type, MM-CDPK27-CR1, MM-CDPK27-CR2 and MM-CDPK27-CR2/MM-CDPK26-CR1 double-mutant plants, grown in a greenhouse in Beijing in the spring of 2022. h,i, Comparison of glucose (h) and fructose (i) contents between wild-type and SlCDPK-knockout mutant plants, which were used for the sensory evaluation panel organized in July 2022, in Beijing. Values are means ± s.d.; n represents numbers of biologically independent samples. In di, a two-tailed Student’s t-test was used to determine P values. *P < 0.05, **P < 0.01, ***P < 0.001, compared to the wild-type (MM) plants. Source data
Fig. 5
Fig. 5. SlCDPK27 and SlCDPK26 interact with and phosphorylate SlSUS3.
a, Yeast two-hybrid assay indicates that SlCDPK27 and SlSUS3 interact in yeast. The N-terminal half of ubiquitin (NubWT) was used as the positive control; the N-terminal half of ubiquitin with I13 substituted to glycine (NubG) was used as the negative control. Transformed yeasts were spotted on the control medium SD/−Leu/−Trp (medium lacking leucine and tryptophan) or the selective medium SD/−Leu/−Trp/−His (medium lacking leucine, tryptophan and histidine). b,c, Split firefly LUC complementation imaging assay, performed in mature N.benthamiana leaves, shows that SlCDPK27 (b) and SlCDPK26 (c) interact with SlSUS3 in planta. d,e, SlCDPK27 (d) and SlCDPK26 (e) phosphorylate SlSUS3 at the S11 residue, in vitro. Top, autoradiograph; bottom, Coomassie brilliant blue staining. f, Mutation of SlCDPK27 attenuates SlSUS3 degradation in a cell-free assay. g, SlSUS3(S11A) degraded at a slower rate than SlSUS3 in a cell-free assay. h, Relative expression of SlSUS3. Values are means ± s.d. (n = 5 independent replicates). il, Comparison of fruit weight (i), total SSC (j) and glucose (k) and fructose (l) contents between wild-type and SlSUS3-overexpressing plants. Values are means ± s.d. (n = 13 independent replicates). In hl, a two-tailed Student’s t-test was used to determine P values. *P < 0.05, **P < 0.01, ***P < 0.001, compared to the wild-type (MM) plants. Source data
Fig. 6
Fig. 6. SlCDPK27-CR1 suppresses the SlCDPK26-mediated SlSUS3 phosphorylation.
a, Split firefly LUC complementation assay shows that SlCDPK27-CR1, but not SlCDPK27-CR2, interacts with SlSUS3 in mature N.benthamiana leaves. b, SlCDPK27-CR1 interferes with the interaction between SlCDPK26 and SlSUS3, in vivo. Fluorescent signals were much weaker in leaf halves co-transformed with cLUC–SlSUS3, SlCDPK26–nLUC and 35S-SlCDPK27-CR1, compared with cLUC–SlSUS3, SlCDPK26–nLUC and 35S-SlCDPK27-CR2. c, SlCDPK27-CR1 inhibits the phosphorylation of SlSUS3 by SlCDPK26. Relative protein abundance of phosphorylated SlSUS3 is indicated at the top of the gel. Left, autoradiograph; right, Coomassie brilliant blue staining. The in vitro kinase competition experiment was repeated four times with similar results.
Extended Data Fig. 1
Extended Data Fig. 1. Roles of the three key variations in total soluble solids content.
a-c, Haplotype analysis of the 3-bp deletion (a), SNP (b) and 12-bp insertion (c), based on the total soluble solids content. Box plots represent the interquartile range, the line in the middle of each box represents the median, the whiskers represent the interquartile range, and the dots represent outlier points. Significant difference was determined by the two-tailed Student’s t test. Source data
Extended Data Fig. 2
Extended Data Fig. 2. Amino acid alignment of SlCDPK27 in MM-CDPK27-CR1, MM-CDPK27-CR2 and M82-CDPK27-CR3 compared to the wild-type tomato line.
The MM-CDPK27-CR1 lost two key amino acids in the kinase domain. The protein translation of MM-CDPK27-CR2 and M82-CDPK27-CR3 was premature. The kinase domain is underlined in red. Asterisks above the alignment represent 18 conserved residues that compose the feature of the ATP binding site in the kinase domain.
Extended Data Fig. 3
Extended Data Fig. 3. Single deficiency in SlCDPK26 had little effects on sugar content.
a, Generation of SlCDPK26 mutant. Sequences of SlCDPK26 in wild type and MM-CDPK26-CR1 mutants are shown. The sgRNA-targeted sequences are indicated in red, and the protospacer adjacent motif (PAM) sequence is highlighted in a blue rectangle. The deletion is indicated by a dashed line. b, Amino acid alignment of SlCDPK26 in MM-CDPK26-CR1 compared to the wild-type tomato line. The protein translation of MM-CDPK26-CR1 was premature. c-f, MM-CDPK26-CR1 exhibited comparable fruit weight (c), total soluble solids (d), glucose (e) and fructose (f) contents, compared to wild-type plants. Values are means ± SD, n represents numbers of biologically independent samples. In c-f, a two-tailed Student’s t-test was used to determine P values (see Source Data). Source data
Extended Data Fig. 4
Extended Data Fig. 4. Deficiency in SlCDPK26 enhances the effects of SlCDPK27 on sugar content.
a-b, Fruit weight of slcdpk mutant plants was not significantly different from that of wild-type plants. c-g, Comparison of total soluble solids (c to e), glucose (f), and fructose contents (g) between wild-type and slcdpk mutant plants. h-i, The slcdpk mutant plants exhibited comparable fruit yield (h), and fruit number (i) with wild-type plants. SG, Shouguang (Shandong, China); BJ, Beijing. Values are means ± SD, n represents numbers of biologically independent samples. In a-i, a two-tailed Student’s t-test was used to determine P values (see Source Data). **P < 0.01, ***P < 0.001, compared to the wild-type (Money Maker) plants. Source data
Extended Data Fig. 5
Extended Data Fig. 5. Cell-free degradation assays.
a, Compared with wild type, SlSUS3 showed obvious slower degradation rate in the extracts of MM-CDPK27-CR2/MM-CDPK26-CR1 double mutant. b-cSlSUS3 showed slight slower degradation rate in the extracts of MM-CDPK27-CR2 (b) or MM-CDPK26-CR1 (c) single mutants, compared to the wild-type extracts. All of these cell-free degradation assays were repeated three times with similar results.
Extended Data Fig. 6
Extended Data Fig. 6. SlCDPK mutants contain fewer, lighter seeds, without influencing photosynthesis.
a-c, Comparison of seed number (a), 1000-seed weight (b), and seed germination rate (c) between wild-type, MM-CDPK27-CR1, MM-CDPK27-CR2 and MM-CDPK27-CR2/MM-CDPK26-CR1 double mutant plants. d, Net photosynthesis rate (Pn) measured with the LICOR-6800 XT instrument. In a-d, values are means ± SD, n represents numbers of biologically independent samples. Two-tailed Student’s t-test was used to determine P values (see Source Data). ***P < 0.001, compared to the wild-type (Money Maker) plants. e, Relative carbon assimilation rate of the slcdpk mutants, as calculated relative to wild-type (Money Maker) plants during a 20 min 13CO2 labeling process. Values are means ± SD (n = 5 independent replicates). RUBP, ribulose-1,5-bisphosphate; RU5P, ribulose-5-phosphate; F6P, fructose-6-phosphate; G6P, glucose-6-phosphate; G1P, glucose-1-phosphate; 27-CR1, MM-CDPK27-CR1; 27-CR2, MM-CDPK27-CR2; 26-CR1, MM-CDPK26-CR1. Source data
Extended Data Fig. 7
Extended Data Fig. 7. Co-evolution of the SSC11.1 and fw loci.
a, Differences in soluble solids content and fruit weight between the wild (PIM) and cultivated (BIG) populations. Box plots represent the interquartile range; the line in the middle of each box represents the median, the whiskers represent the interquartile range, and the dots represent outlier points. Significant difference was determined by the two-tailed Student’s t test. Number of accessions in each group is indicated by n. b, Haplotype frequencies of SSC11.1 and fw11.3 among PIM and BIG populations. High represented the high-SSC allele, Low represented the low-SSC allele. Big indicates the allele associated with big fruit, Small indicates the allele associated with small fruit. The striking haplotypes (frequency > 30%) are highlighted. c, Phylogenetic analysis of the SSC11.1 (ch11_51.180–51.205 Mb; SL2.50) and fw11.3 (ch11_55.250–55.290 Mb; SL2.50) loci. SSC11.1 is about 4.3 Mb from fw11.3. d, Genetic statistics of Tajima’s D, differentiation (FST) and per-generation, per-base recombination rate (r) in the ch11_48.0–56.3 Mb (SL2.50). e, Distribution of nucleotide diversity (π) of the PIM (green) and BIG (blue) lines. SlCDPK27 is located within the large selective sweep region harboring three fruit mass QTLs on the end of chromosome 11. f, Genome-wide ROHs analysis of accessions among the PIM and BIG populations. The x-axis indicates the number of ROHs, y-axis indicates the total length of genomic ROHs. The dotted line was estimated based on the PIM population. Source data
Extended Data Fig. 8
Extended Data Fig. 8. Phylogenetic analysis of SlCDPK27 and SlCDPK26.
a, Phylogenetic tree of CDPK orthologs across 12 plant genomes, including a fern (Azolla filiculoides), a gymnosperm (Ginkgo biloba) and 10 angiosperm crops (Solanum lycopersicum, Solanum melongena, Solanum tuberosum, Arabidopsis thaliana, Capsicum annuum, Malus domestica, Manihot esculenta, Oryza sativa, Citrus sinensis and Citrullus lanatus). The orthologs used for further sequence alignment in b are marked in red circles. b, Amino acid alignment of SlCDPK27, SlCDPK26 and their orthologs. The kinase domain is underlined in red. The red asterisks above the alignment represent the two amino acids deleted in MM-CDPK27-CR1. Source data

References

    1. Colantonio, V. et al. Metabolomic selection for enhanced fruit flavor. Proc. Natl Acad. Sci. USA119, e2115865119 (2022). - PMC - PubMed
    1. Gough, C. & Hobson, G. E. A comparison of the productivity, quality, shelf-life characteristics and consumer reaction to the crop from cherry tomato plants grown at different levels of salinity. J. Hortic. Sci.65, 431–439 (1990).
    1. Kader, A. A. Flavor quality of fruits and vegetables. J. Sci. Food Agric.88, 1863–1868 (2008).
    1. Beckles, D. M. Factors affecting the postharvest soluble solids and sugar content of tomato (Solanum lycopersicum L.) fruit. Postharvest Biol. Technol.63, 129–140 (2012).
    1. Cong, B., Barrero, L. S. & Tanksley, S. D. Regulatory change in YABBY-like transcription factor led to evolution of extreme fruit size during tomato domestication. Nat. Genet.40, 800–804 (2008). - PubMed

MeSH terms

LinkOut - more resources