. 2024 Dec;636(8043):654-662.
doi: 10.1038/s41586-024-08187-1. Epub 2024 Nov 13.

Structural variation in the pangenome of wild and domesticated barley

Murukarthick Jayakodi #  1   2 Qiongxian Lu #  3 Hélène Pidon #  1   4 M Timothy Rabanus-Wallace #  1 Micha Bayer  5 Thomas Lux  6 Yu Guo  1 Benjamin Jaegle  7 Ana Badea  8 Wubishet Bekele  9 Gurcharn S Brar  10   11 Katarzyna Braune  3 Boyke Bunk  12 Kenneth J Chalmers  13 Brett Chapman  14 Morten Egevang Jørgensen  3 Jia-Wu Feng  1 Manuel Feser  1 Anne Fiebig  1 Heidrun Gundlach  6 Wenbin Guo  5 Georg Haberer  6 Mats Hansson  15 Axel Himmelbach  1 Iris Hoffie  1 Robert E Hoffie  1 Haifei Hu  14   16 Sachiko Isobe  17 Patrick König  1 Sandip M Kale  3   18 Nadia Kamal  6 Gabriel Keeble-Gagnère  19 Beat Keller  7 Manuela Knauft  1 Ravi Koppolu  1 Simon G Krattinger  20 Jochen Kumlehn  1 Peter Langridge  13 Chengdao Li  14   21   22 Marina P Marone  1 Andreas Maurer  23 Klaus F X Mayer  6   24 Michael Melzer  1 Gary J Muehlbauer  25 Emiko Murozuka  3 Sudharsan Padmarasu  1 Dragan Perovic  26 Klaus Pillen  23 Pierre A Pin  27 Curtis J Pozniak  28 Luke Ramsay  5 Pai Rosager Pedas  3 Twan Rutten  1 Shun Sakuma  29 Kazuhiro Sato  17   30 Danuta Schüler  1 Thomas Schmutzer  23 Uwe Scholz  1 Miriam Schreiber  5 Kenta Shirasawa  17 Craig Simpson  5 Birgitte Skadhauge  3 Manuel Spannagl  6 Brian J Steffenson  31 Hanne C Thomsen  3 Josquin F Tibbits  19 Martin Toft Simmelsgaard Nielsen  3 Corinna Trautewig  1 Dominique Vequaud  27 Cynthia Voss  3 Penghao Wang  14 Robbie Waugh  5   32 Sharon Westcott  14 Magnus Wohlfahrt Rasmussen  3 Runxuan Zhang  5 Xiao-Qi Zhang  14 Thomas Wicker  33 Christoph Dockter  34 Martin Mascher  35   36 Nils Stein  37   38
Affiliations

Structural variation in the pangenome of wild and domesticated barley

Murukarthick Jayakodi et al. Nature. 2024 Dec.

Abstract

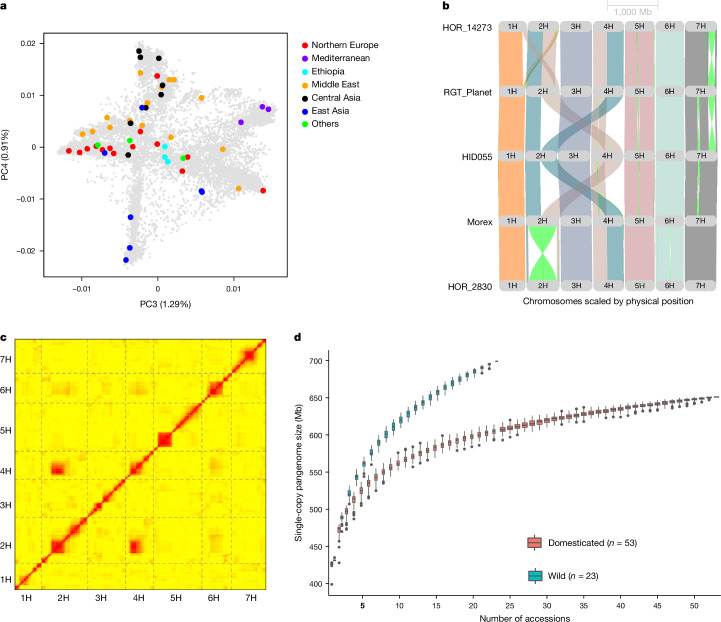
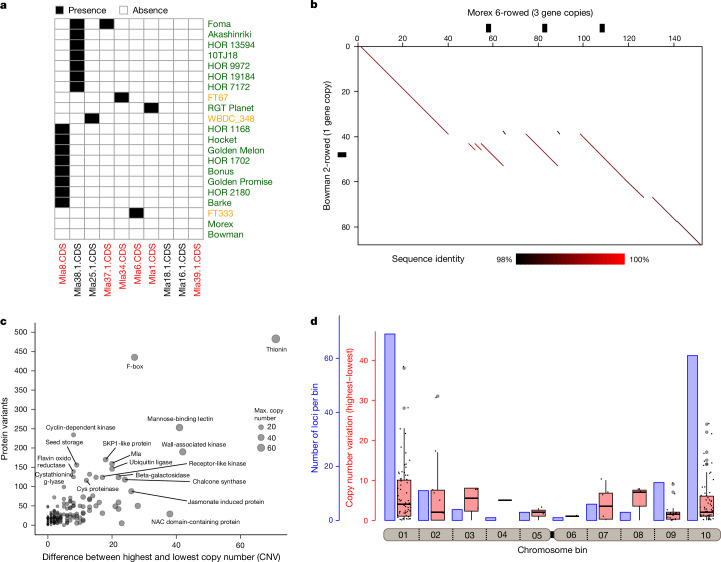
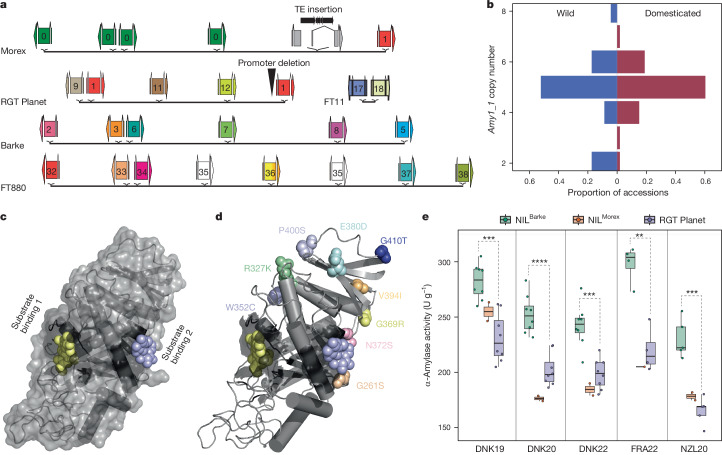
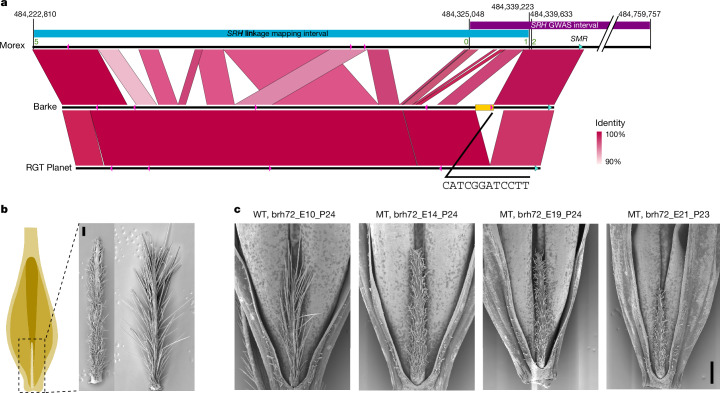
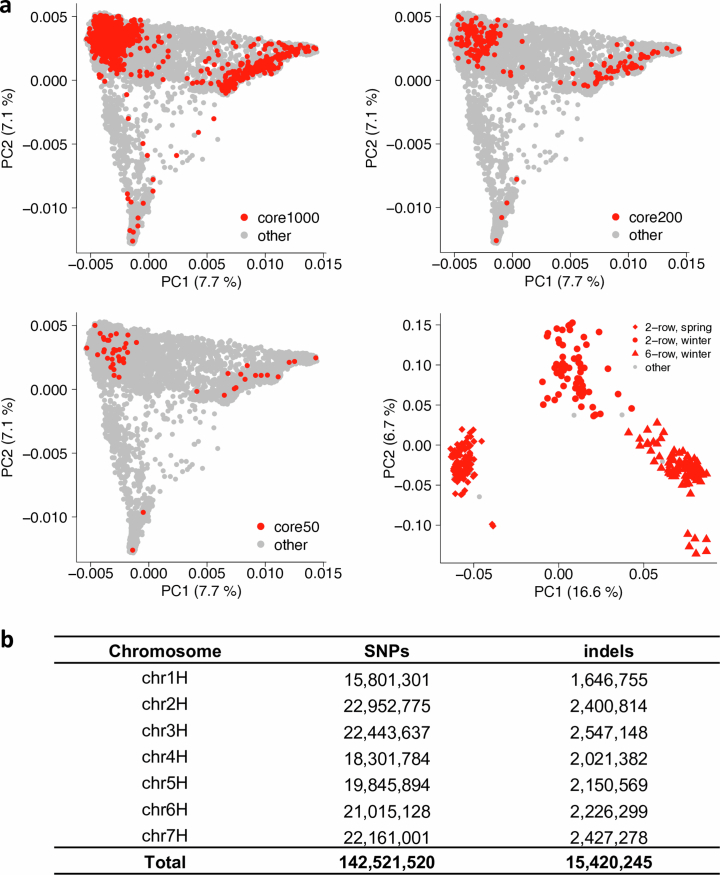
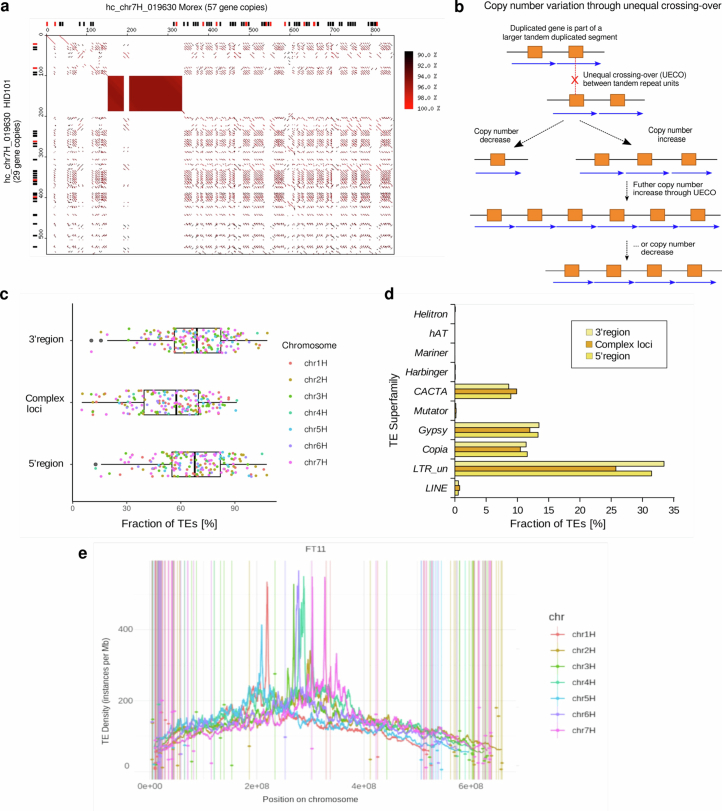
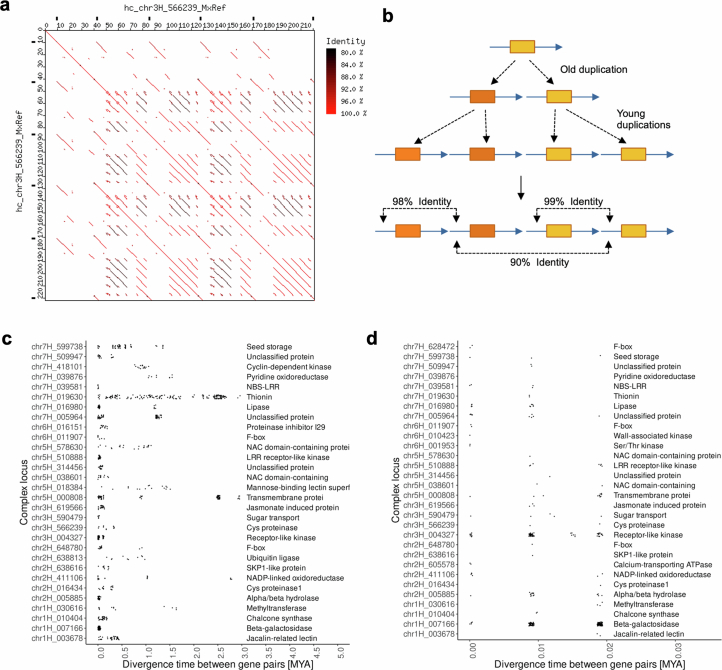
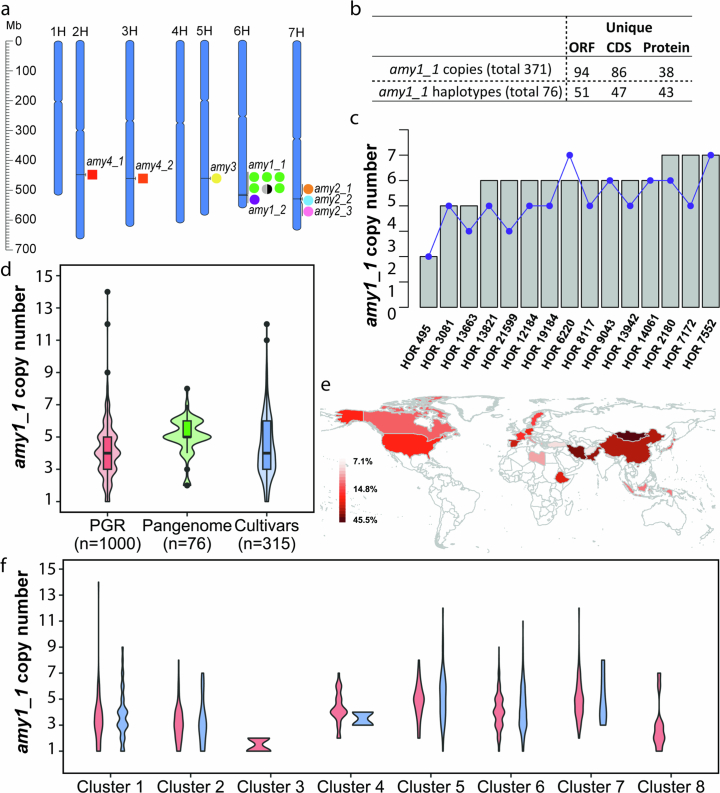
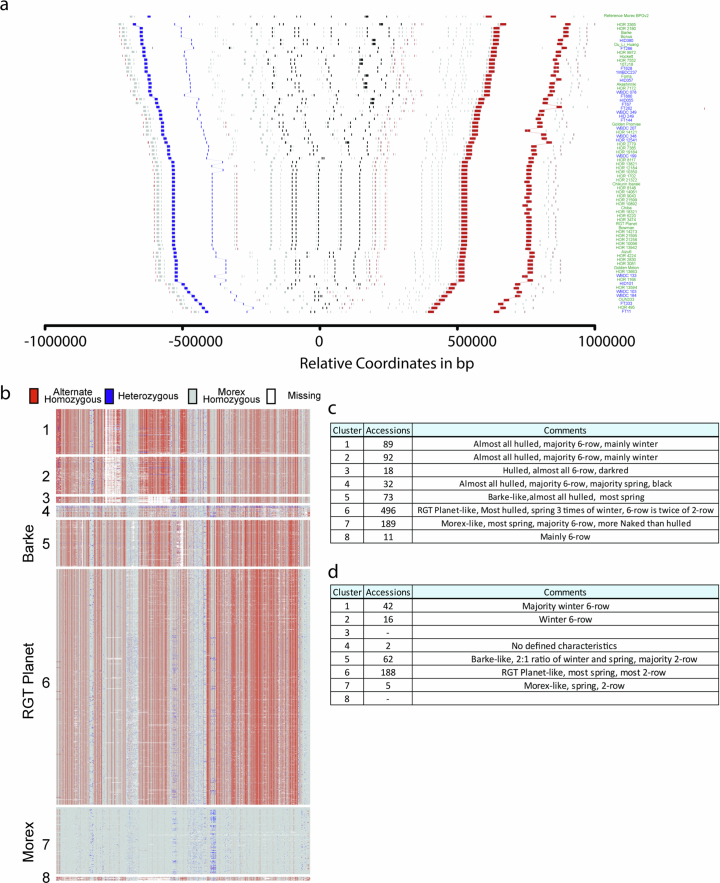
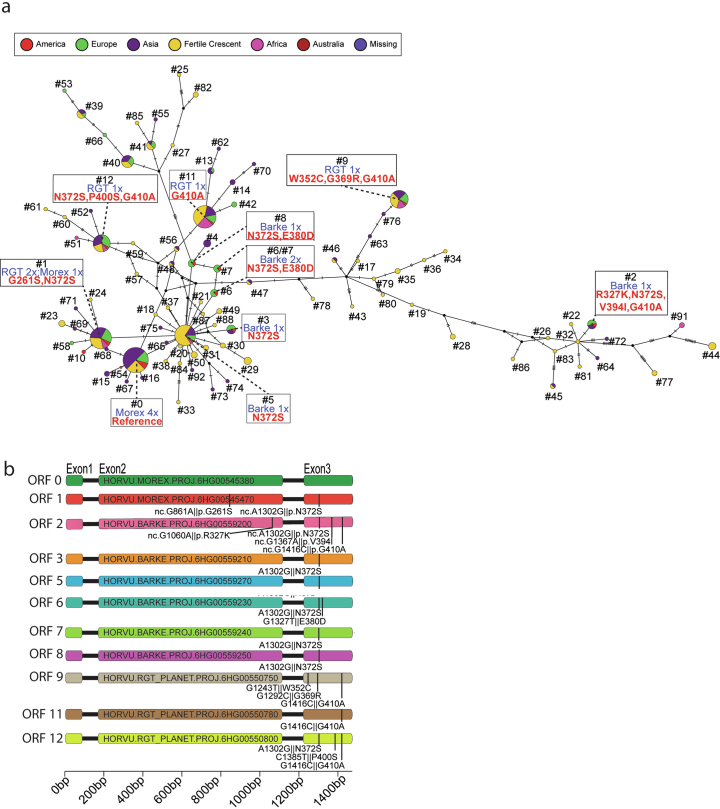
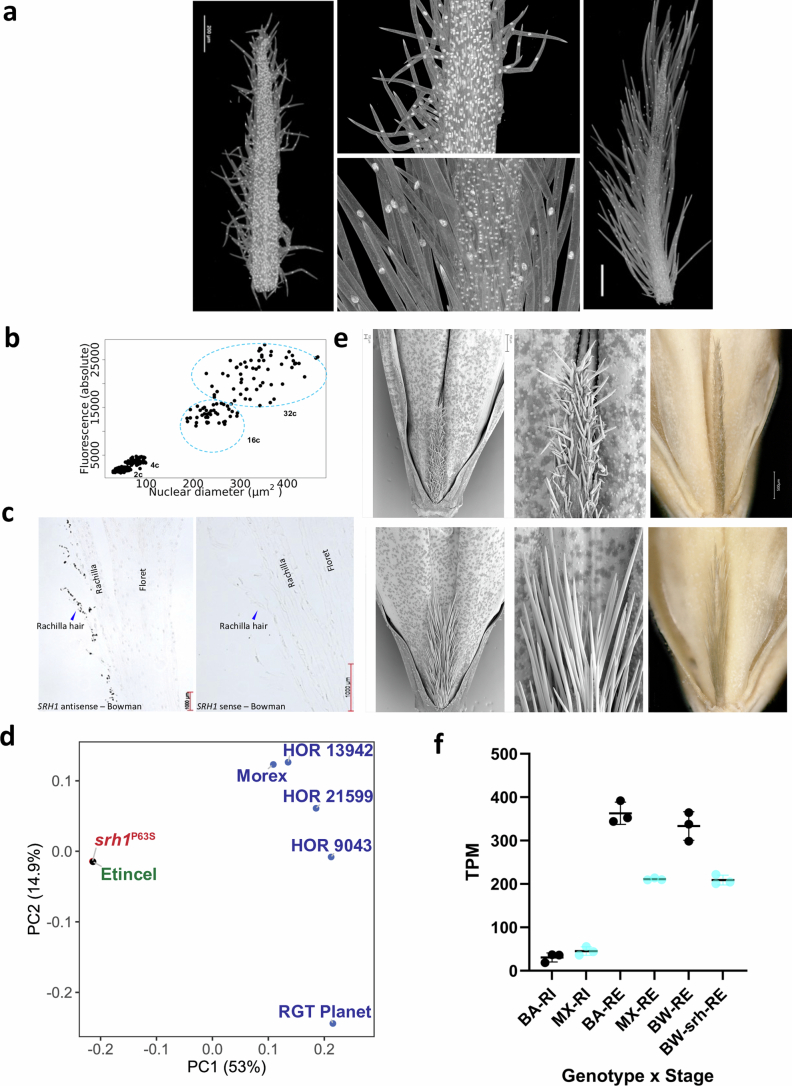
Pangenomes are collections of annotated genome sequences of multiple individuals of a species1. The structural variants uncovered by these datasets are a major asset to genetic analysis in crop plants2. Here we report a pangenome of barley comprising long-read sequence assemblies of 76 wild and domesticated genomes and short-read sequence data of 1,315 genotypes. An expanded catalogue of sequence variation in the crop includes structurally complex loci that are rich in gene copy number variation. To demonstrate the utility of the pangenome, we focus on four loci involved in disease resistance, plant architecture, nutrient release and trichome development. Novel allelic variation at a powdery mildew resistance locus and population-specific copy number gains in a regulator of vegetative branching were found. Expansion of a family of starch-cleaving enzymes in elite malting barleys was linked to shifts in enzymatic activity in micro-malting trials. Deletion of an enhancer motif is likely to change the developmental trajectory of the hairy appendages on barley grains. Our findings indicate that allelic diversity at structurally complex loci may have helped crop plants to adapt to new selective regimes in agricultural ecosystems.


Conflict of interest statement

Competing interests: K.B., C.D., M.E.J., S.M.K., Q.L., E.M., P.R.P., B.S., H.C.T., M.T.S.N., C.V. and M.W.R. are current or previous Carlsberg A/S employees. P.A.P. and D.V. are SECOBRA Recherches employees. The other authors declare no competing interests.

Figures

Fig. 1
Fig. 1. A species-wide pangenome of H. vulgare.
a, Principal component analysis showing domesticated accessions (n = 53) in the pangenome panel in the global diversity space. Regions of origins are colour coded. The proportion of variance explained by each PC in panels is given in the axis labels. Other PCs are shown in Extended Data Fig. 1a. b, Example of large SVs including interchromosomal translocations and inversions between pangenome accessions. c, Interchromosomal LD in segregating offspring derived from a cross between HID055 and Barke. LD is indicated by the intensity of red colour. d, Size of the single-copy pangenome in wild and domesticated barleys as a function of sample size. Boxes indicate the interquartile range (IQR) with the central line indicating the median and whiskers indicating the minimum and maximum without outliers, respectively. Outliers were defined as minimum −1.5 × IQR and maximum +1.5 × IQR, respectively. LD, linkage disequilibrium; PC, principal component.
Fig. 2
Fig. 2. Structurally complex loci in the barley pangenome.
a, Presence/absence of known Mla alleles in the barley pangenome. Black and white squares denote presence and absence, respectively. The names of Mla alleles (y axis) and genotypes (x axis) are coloured according to, respectively, subfamily (red, 1; or black, 2; ref. ) and domestication status (green, domesticated; orange, wild). Only the genomes containing known alleles are shown. Owing to higher SNP numbers and truncations, members of subfamily 2 are expected to be inactive forms. b, Dot plot alignment of complex locus Chr04_015772 which contains Int-c genes. The plot shows an alignment of Morex (six-rowed barley) and Bowman (two-rowed barley). In Morex, Int-c and its surrounding sequence are present in three copies. Genes are indicated as black boxes along the axes of the plot. Individual tandem repeat units are 96–100% identical. c, CNV levels and numbers of encoded protein variants identified in 76 barley accessions. The x axis shows the level of CNV (that is, the difference between the accession with the fewest copies and that with the most copies for each locus). The y axis shows the total number of protein variants identified in all 76 barley accessions. Labels mark gene families with the highest copy numbers or the highest CNV levels. d, Complex loci are enriched in distal chromosomal regions. The seven barley chromosomes were divided into ten equally sized bins, and cumulative data for all chromosomes are shown. AQ15The bar plot indicates the number of loci, whereas the box plot shows the extent of CNV for all loci in the bin. Boxes indicate the IQR with the central line indicating the median and whiskers indicating the minimum and maximum without outliers, respectively. Outliers were defined as minimum −1.5 × IQR and maximum +1.5 × IQR, respectively.
Fig. 3
Fig. 3. Structural diversity at the amy1_1 locus and its importance in malting.
a, Simplified structure of the amy1_1 locus in selected pangenome assemblies. A detailed depiction of the amy1_1 locus across all 76 assemblies is shown in Extended Data Fig. 9a. Identical colours indicate identical ORFs in a and d. b, Distribution of amy1_1 copy numbers (as proportion of wild or domesticated accessions) across 76 assemblies. c,d, X-ray crystal structure (PDB 1BG9, ref. ) of α-amylase bound to acarbose as a substrate analogue (magenta and yellow spheres). In d, amy1_1 amino acid variants (found in Morex, Barke and RGT Planet; Supplementary Table 21) are added as coloured spheres. e, α-Amylase activity of micro-malted grain of RGT Planet compared to RGT Planet near-isogenic lines (NILs) containing amy1_1-Morex and Barke haplotypes. The boxes delimit the 25th and 75th percentiles, and the horizontal line inside the box represents the median. Lower and upper whiskers denote minima and maxima. Two-sided t-test was used in multiple comparison and P value was adjusted with the Holm–Bonferroni method (**P ≤ 0.01, ***P ≤ 0.001, ****≤ 0.0001). n = 8 (Barke), 2 (Morex), 8 (RGT Planet) independent samples examined in 5 independent experiments or environments.
Fig. 4
Fig. 4. A deletion in an enhancer motif is associated with Srh1-dependent trichome branching.
a, Top part, schematic representation of the high-resolution genetic linkage analysis at the Srh1 locus. Blue and purple horizontal bars represent the overlapping biparental and genome-wide association study (Supplementary Fig. 12) mapping intervals in reference to the 160 kb physical interval in the Morex genome (black line below the coloured bars). Note, an SMR-like gene, candidate for the srh1 mutant phenotype, sits outside the high-resolution biparental mapping interval. Bottom part, connector plot showing conserved homologous regions in the genotypes Barke (long hairs) and RGT Planet (short hairs). A region (yellow rectangle) harbouring a conserved enhancer element (pink triangle) is present in Barke, but absent in Morex and RGT Planet. b, Schematic drawing of a hulled and awned barley seed. The rachilla is the secondary axis in a cereal inflorescence, which in barley is reduced to a rudimentary structure densely covered with trichomes and attached to the base of the seed. On the right, scanning electron micrographs are shown of a short-haired and a long-haired rachilla of genotypes Morex and Barke, respectively. c, Rachilla hair phenotype of the Cas9-induced knockout mutants of the SMR-like gene. Panels from left to right show a wild-type segregant from the brhE72_E10 family (Supplementary Table 26) with long rachilla hairs; three representative mutants from three independent T1/M2 families brhE72_E14, _E19, _E24 segregating for different independent mutational events, respectively, all showing the short-hair phenotype (black bar indicates a length of 0.5 mm). MT, mutant; WT, wild type.
Extended Data Fig. 1
Extended Data Fig. 1. A globally representative diversity panel of domesticated and wild barley.
(a) Higher principal components (PC) of the barley diversity space (as defined by the genotyping-by-sequencing data of Milner et al. ) with pangenome accessions highlighted. (b) The first two PCs of the diversity space of 412 wild barley (Hordeum vulgare subsp. spontaneum) with pangenome accessions highlighted. The underlying data were taken from Milner et al. and Sallam et al. (c) Neighbor-joining phylogenetic tree of those wild barleys. The branch tips corresponding to accessions selected for the pangnome are marked with red circles. The proportion of variance explained by each PC in panels (a) and (b) is given in the axis labels. (d) Map showing the collection sites of wild accessions (n = 23) included in the pangenome panel. The map was drawn in R using the package ‘mapdata’.
Extended Data Fig. 2
Extended Data Fig. 2. A pangenomic diversity map of barley.
(a) Assembly statistics of 76 chromosome-scale reference genome sequences. (b) Counts of presence/absence variants. (c) Counts of inversion polymorphisms spanning 2 kb or more. (d) Selection of threshold based on pairwise differences (number of SNPs per Mb) for the binary classification into similar/dissimilar haplotypes. (e) The proportion of samples with a close match to one of the 76 pangenome accessions is shown for plant genetic resources (PGR) and elite cultivars in sliding windows along the genome (size: 1 Mb, shift: 500 kb). (f) Distribution of the share of similar windows in individual PGR and cultivar genomes.
Extended Data Fig. 3
Extended Data Fig. 3. Gene-space collinearity.
(a) Upset plot showing the intersections between cultivars, wild forms and landraces among the shell HOGs. Individual HOGs may contain genes from e.g. all wild barleys, or any subset of wild barley genotypes down to a single wild barley genotype. (b-d) GENESPACE alignments of 76 barley genomes, grouped by cultivars (a) and landraces (c) and wild barley (d).
Extended Data Fig. 4
Extended Data Fig. 4. Graph-based pangenome analysis with Minigraph.
(a) Descriptive statistics per chromosome and for joint graph. (b) Comparative statistics of read mappings from five publicly available Illumina whole genome shotgun sequence read runs against the pan-genome graph, the MorexV3 linear reference sequence and the linearised version of the pan-genome graph. (c) Size distribution of structural variants in graph. (d) Chromosomal distribution of structural variants. Centromere positions are indicated by vertical dashed lines in red. (e) Pangenome graph growth curves generated with the odgi heaps tool. One hundred permutations were computed for each number of genomes included. Values of gamma > 0 in Heaps’ law indicate an open pangenome. Plots shown are for all accessions (left, n = 76), domesticated accessions only (cultivars + landraces, centre, n = 53) and H. spontaneum accessions (right, n = 23).
Extended Data Fig. 5
Extended Data Fig. 5. Short-read data complement the pangenome infrastructure.
(a) Accessions selected for short-read sequencing. Nested coresets of 1000, 200 and 50 accessions (core1000, core200, core50) are shown in the global diversity space of barley as represented by a principal component (PCA). The top-right subpanel shows a PCA of 315 elite cultivars. Accessions are according to genepool (2-rowed spring, 2-rowed winter, 6-rowed winter). The proportion of variance explained by the PCA is shown in the axis labels. (b) Counts of single-nucleotide polymorphisms (SNPs) and short insertions and deletions (indels) detected in those data.
Extended Data Fig. 6
Extended Data Fig. 6. Complex loci are hot spots for copy number variation (CNV).
(a) Dot plot alignment of the example locus chr7H_019630 which contains a cluster of thionin genes. The sequences of Morex (horizontal) and wild barley HID101 (vertical) were aligned. Predicted intact genes are indicated as black boxes along the left and top axes. Predicted pseudogenes are shown in red. The axis scale is kb. The filled rectangle at positions ~150–330 kb in Morex represents an array of short tandem repeats which does not contain annotated thionin genes and does not have sequence homology to the thionin-containing tandem repeats of the locus. (b) The schematic model shows how, once an initial duplication is established, unequal homologous recombination (unequal crossing-over, UECO) between repeat units can lead to rapid expansion and contraction of the loci, thereby leading to CNV of genes. (c) TE content of complex loci. Dots represent the proportion of TEs (in %) in each to 169 complex loci. This is compared to regions of the same size (1 Mb) in the 3′ and 5′ directions. Complex loci have overall slighly lower content of annotated TEs than their flanking region, which is likely due to their higher gene content. Boxes indicate the inter-quartile range (IQR) with the central line indicating the median and whiskers indicating the minimum and maximum without outliers, respectively. Outliers were defined as minimum – 1.5 x IQR and maximum + 1.5 x IQR, respectively. (d) Contribution of TE superfamilies to complex loci and their 5′ and 3′ neigbouring regions. Complex loci contain slightly more CACTA and fewer LTR retroelements than neigbouring regions, a general characteristic of gene containing regions in barley. (e) Overall TE content along barley chromosomes (example accession B1K-04-12 [FT11]) compared to that of complex loci. TE content of complex loci is indicated by coloured dots. Due to the relatively small sizes of the loci, TE content of individual loci, in most cases, differs from that of the overall TE content in the respecive chromosomal regions.
Extended Data Fig. 7
Extended Data Fig. 7. Molecular dating of divergence times between duplicated gene copies in complex loci.
(a) Dot plot example of locus hc_chr3H_566239 which underwent multiple waves of tandem duplications, which is reflected in varying levels of sequence identity between tandem repeats (color-coded). (b) Schematic mechanism for how different levels of sequence identity between tandem repeats evolve. In the example, an ancestral duplication was followed by two independent subsequent duplications, leading to varying levels of sequence identity between tandem repeat units. Genes are indicated as orange boxes while blue arrows indicate the tandem repeats they are embedded in. (c) Divergence time estimates between duplicate gene copies in complex loci. Shown are only those complex loci which have at least six tandem-duplicated genes. Each dot represents one divergence time estimate for a duplicated gene pair from the respective locus. The x-axis shows the estimated divergence time in million years. At the right-hand side, classification of proteins encoded by genes in the locus are shown. Note that several loci had multiple waves of gene duplications over the past 3 million years. (d) Subset of those loci shown in (c) that had at least one gene duplication within the past 20,000 years. The divergence time estimates appear in groups, since they represent the presence of 0, 1 and 2 nucleotide substitutions, respectively, in the approx. 4 kb of aligned sequences that were used for molecular dating.
Extended Data Fig. 8
Extended Data Fig. 8. amy1_1 locus structure and copy number in 76 assemblies and 1,315 whole genome sequenced accessions.
(a) Chromosomal locations of 12 α-amylase genes in the MorexV3 genome assembly. (b) Summary of amy1_1 locus sequence diversity in the 76 pangenome assemblies (Supplementary Tables 14–19). The distribution of unique amy1_1 ORFs, CDS and protein copies and haplotypes (denoting combinations of amy1_1 copies in individual accessions) across the 76 pangenome assemblies. (c) Comparison of amy1_1 copy numbers identified in the pangenome assemblies versus k-mer based estimation from raw reads (Pearson correlation coefficient r = 0.69, two-sided p-value = 0.004). Grey bars denote copy number from pangenome, blue dots denote k-mer estimated copy number. (d) amy1_1 copy number estimation in 76 pangenome assemblies (“Pangenome”), 1,000 whole-genome sequenced plant genetic resources (“PGR”), and 315 whole-genome sequenced European elite cultivars (“Cultivars”) using k-mer based methods. The boxes delimit the 25th and 75th percentile, the horizontal line inside the box represents the median. Lower and upper whiskers denote minima and maxima. (e) Distribution of accessions with amy1_1 copy numbers >5 per country (as percentage of total accessions in country for countries with ≥10 accessions). (f) amy1_1 copy number within each haplotype cluster (see Extended Data Fig. 9b). Red color refers to 1,000 plant genetic resource accessions, green refers to 76 pangenome accessions and blue refers to 315 European elite cultivars in panels d and f. Clusters #5, #6 and #7 in panel f contain Barke, RGT Planet and Morex, respectively.
Extended Data Fig. 9
Extended Data Fig. 9. Haplotype structure of the amy1_1 locus.
(a) Structural diversity in the vicinity of amy1_1 in the 76 pangenome assemblies. Each line shows the gene order in the sequence assembly of one genotype. The MorexV3 reference is shown on top. Coloured rectangles stand for gene models extracted from BLAST alignments against the corresponding gene models in MorexV3. Black rectangles represent amy1_1 homologs and grey rectangles other genes. Blue and red rectangles represent marker genes used to define the synteny, delimit the region and sort the accessions based on the distance between endpoints. Lines connect gene models between different genomes. Accession names are given on the right axis and are coloured according to type (blue – wild, green – domesticated). In HOR 8148, five copies assigned to 6H are shown. Two copies assigned to an unanchored contig are not shown. (b) SNP haplotype clusters at the amy1_1 locus among 1,315 genomes of domesticated and wild barley accessions, including genomes of 315 elite barley cultivars. The 6H:516,385,490-517,116,415 bp in the MorexV3 genome sequence is shown. Haplotype clusters #5, #6 and #7 contain the elite malting cultivars Barke, RGT Planet and Morex, respectively. (c) and (d) description of barley types in haplotype clusters #1-#8 across 315 elite cultivars (c) and 1,000 plant genetic resources (d).
Extended Data Fig. 10
Extended Data Fig. 10. Sequence diversity of the amy1_1 gene.
(a) Median-joining haplotype network of amy1_1 copies in 76 pangenome assemblies. Nodes represent different ORFs and are coloured according to accession origin. The node size is proportional to the number of gene IDs a given node represents (Supplementary Table 14). Nodes containing cultivars Barke, RGT Planet and Morex amy1_1 ORFs are highlighted and the corresponding amino acid variation relative to Morex reference is shown in red. (b) Non-synonymous sequence exchanges in 12 non-redundant amy1_1 ORFs in the malting barleys Morex, Barke and RGT Planet. The positions of sequence variants and respective amino acid variations are marked by black lines. Colouring corresponds to (Fig. 3a). ORF numbers refer to Supplementary Table 14.
Extended Data Fig. 11
Extended Data Fig. 11. Functional dissection of the Srh1 locus.
(a) Light microscopy of short- and long-haired rachillae at Waddington developmental stage W8.5-9 using DAPI staining to visualize the nuclei. Size differences of nuclei in epidermal and trichome cells are very obvious. The shown micrographs are representative of a total of five individual spikes sampled on separate days. (b) Densitometric measurement of DNA content in epidermal and trichome cells of DAPI stained rachillae of genotypes Morex and Barke, respectively. While trichome cells in short-haired rachillae undergo only one cycle of endoreduplication, the cells in long haired trichomes show eight to sixteen-fold higher DNA contents than epidermal cells indicating three to four cycles of endoreduplication. (c) mRNA in situ hybridization of HvSRH1 in longitudinal spikelet sections of Bowman with anti-sense (left) and sense (right) probes. The blue arrow indicates the position of a rachilla hair. Representative micrographs of two independent experiments are shown. (d) Principal coordinate analysis of SNP array genotyping data of different barley genotypes. Etincel and its mutant srh1P63S cluster together, proving their isogenicity. (e) srh1 mutant discovery. FIND-IT screenings identified a mutant with short-fuzzy hairs (top) in the background of the long-haired cultivar Etincel (bottom). The mutants are a P63S non-synonymous sequence exchange. Scale bar - 1 mm. Wildtype and mutant spikes were inspected for the srh phenotype. Spikes showed either the short- or long-hair phenotype (#mutant seeds: 22, #wild type seeds: 21), respectively. Individual representative seeds wer chosen for micrographic documentation. (f) HvSRH1 transcript abundance in RNA sequencing data of rachilla tissue in Barke (BA, long-haired), Morex (MX, short-haired), Bowman (BW, long-haired) and a short-haired near-isogenic line of Bowman (BW-srh). Samples were taken at two developmental stages: rachilla hair initiation (RI) and elongation (RE). Abundance was measured as transcripts per million (TPM). Points stands for individual biological replicates (n = 3). Error bars show the mean and standard error.

References

    1. Schreiber, M., Jayakodi, M., Stein, N. & Mascher, M. Plant pangenomes for crop improvement, biodiversity and evolution. Nat. Rev. Genet.25, 563–577 (2024). - PMC - PubMed
    1. Lei, L. et al. Plant pan-genomics comes of age. Annu. Rev. Plant Biol.72, 411–435 (2021). - PubMed
    1. Komatsuda, T. et al. Six-rowed barley originated from a mutation in a homeodomain-leucine zipper I-class homeobox gene. Proc. Natl Acad. Sci. USA104, 1424–1429 (2007). - PMC - PubMed
    1. Sakuma, S. et al. Divergence of expression pattern contributed to neofunctionalization of duplicated HD-Zip I transcription factor in barley. New Phytol.197, 939–948 (2013). - PubMed
    1. Milner, S. G. et al. Genebank genomics highlights the diversity of a global barley collection. Nat. Genet.51, 319–326 (2019). - PubMed

LinkOut - more resources