. 2024 Nov;635(8040):987-1000.
doi: 10.1038/s41586-024-08207-0. Epub 2024 Nov 13.

NK2R control of energy expenditure and feeding to treat metabolic diseases

Affiliations

NK2R control of energy expenditure and feeding to treat metabolic diseases

Frederike Sass et al. Nature. 2024 Nov.

Abstract

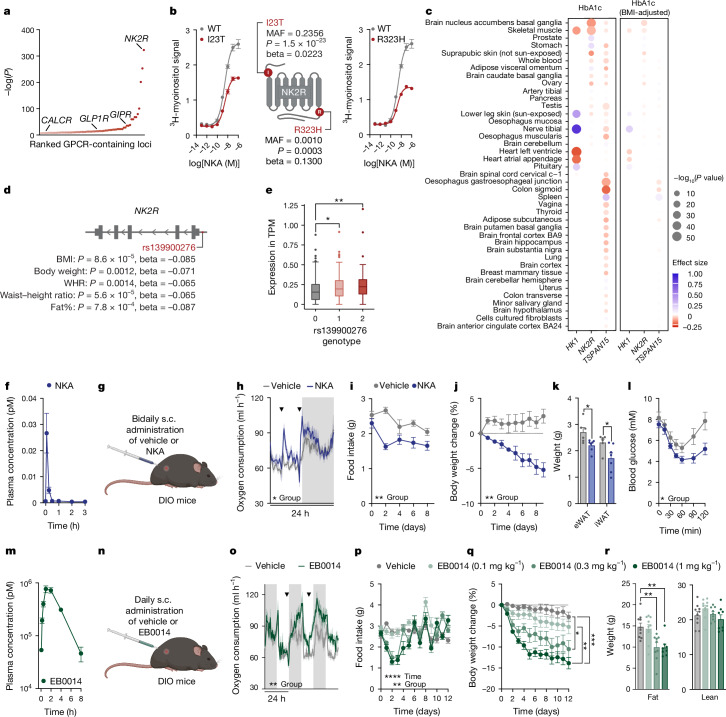
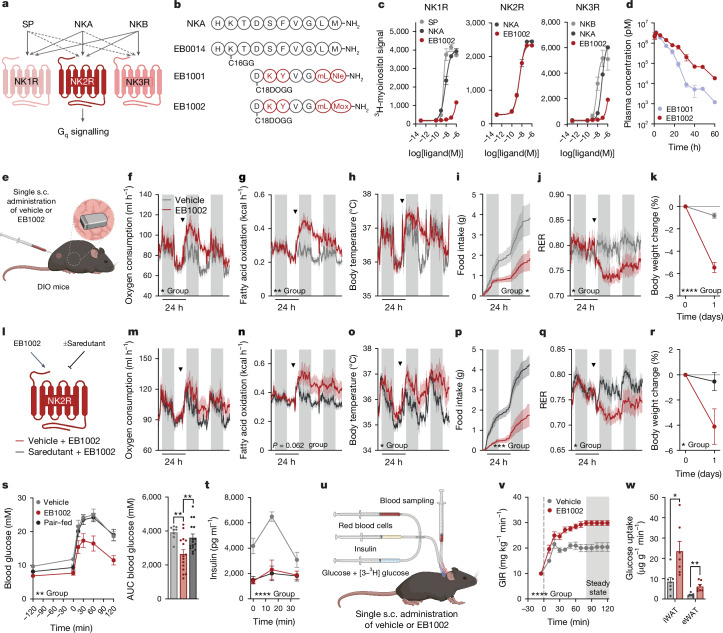
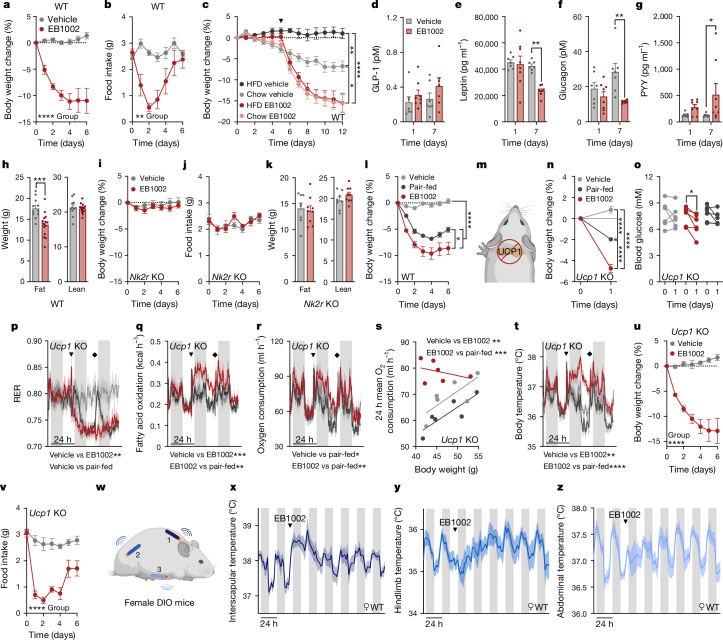
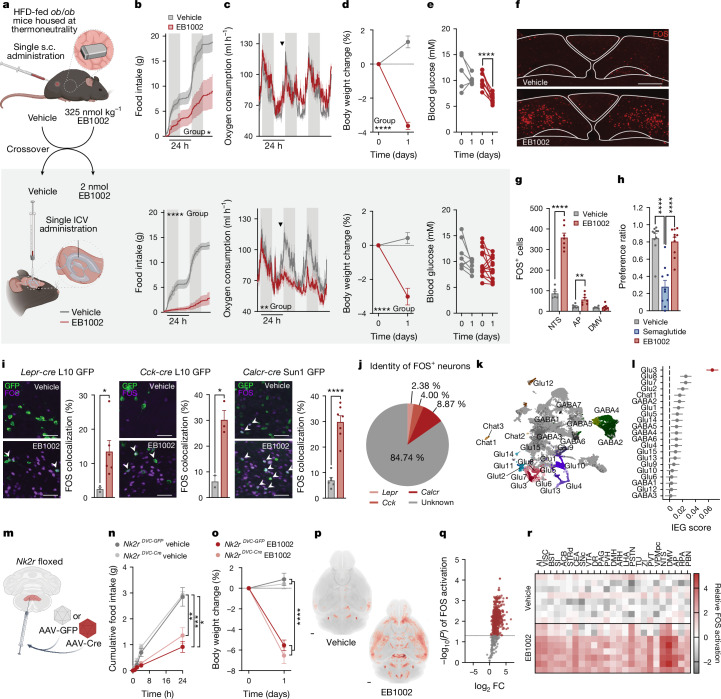
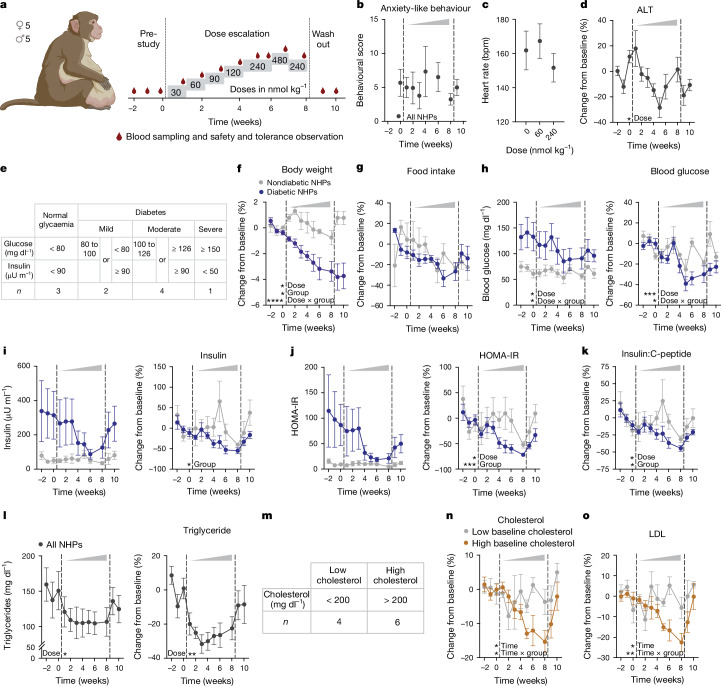
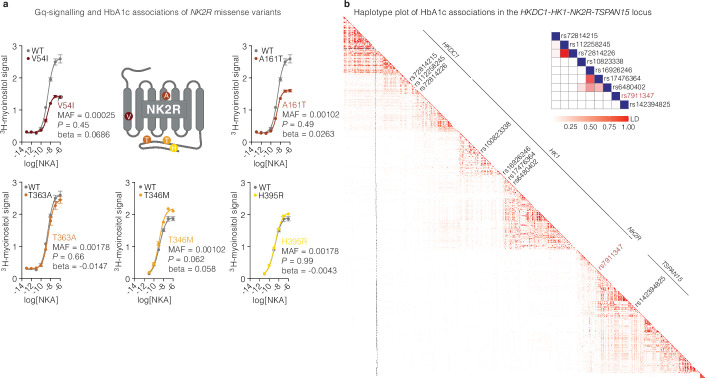
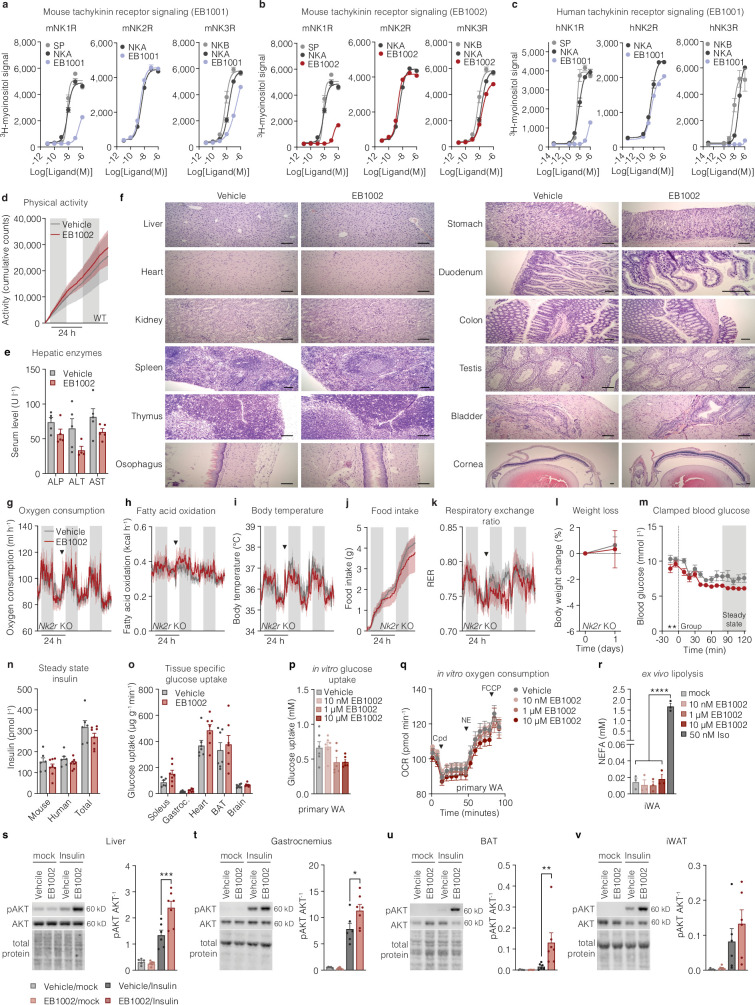
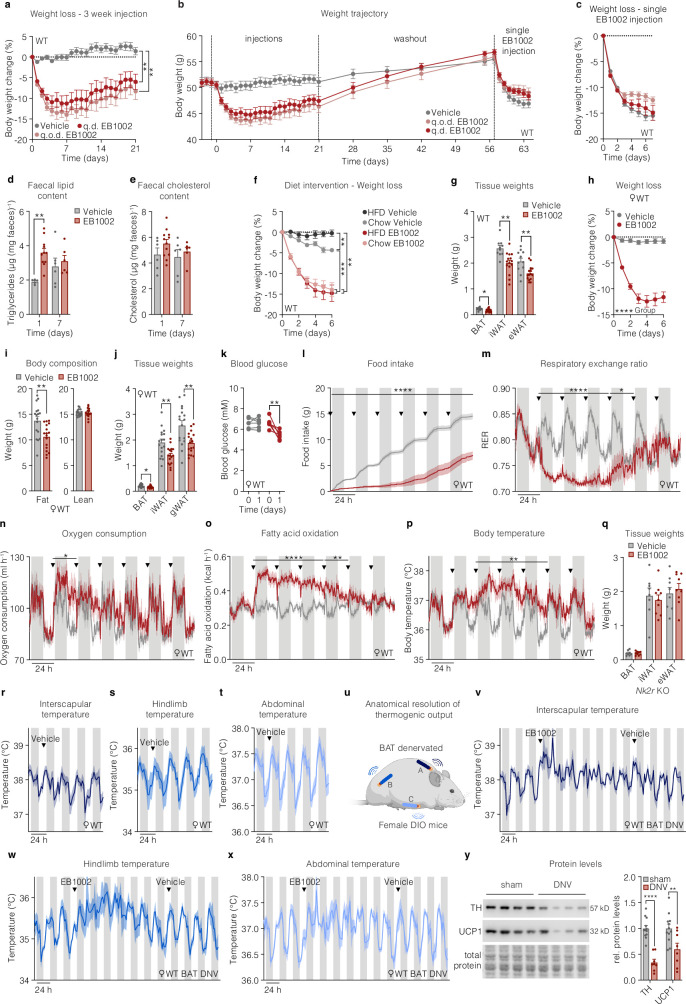
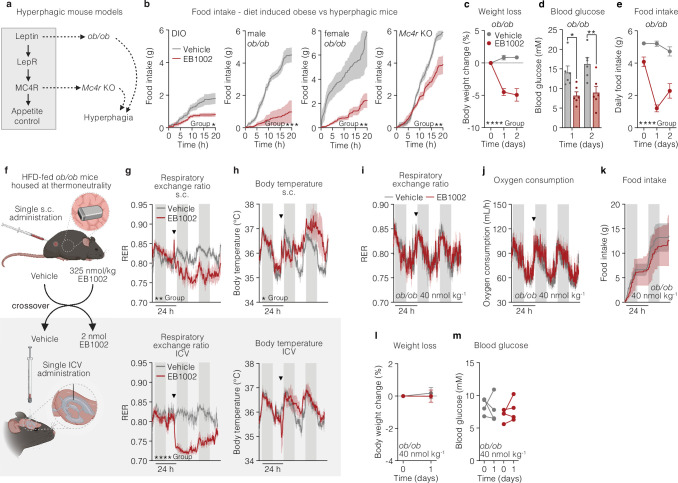
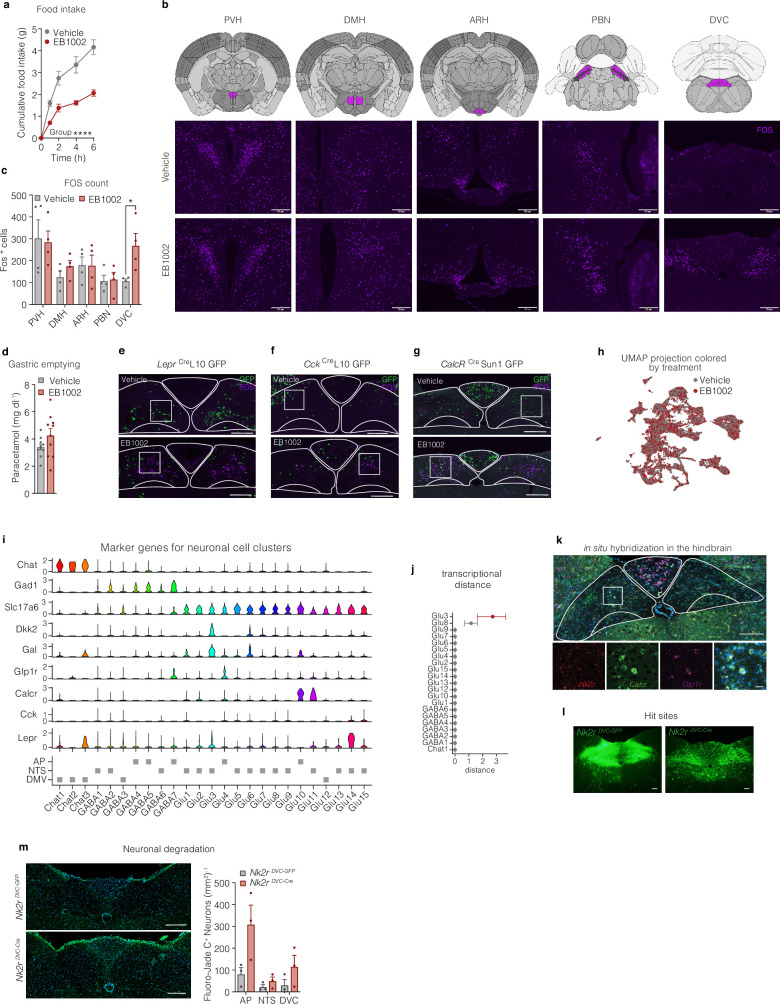
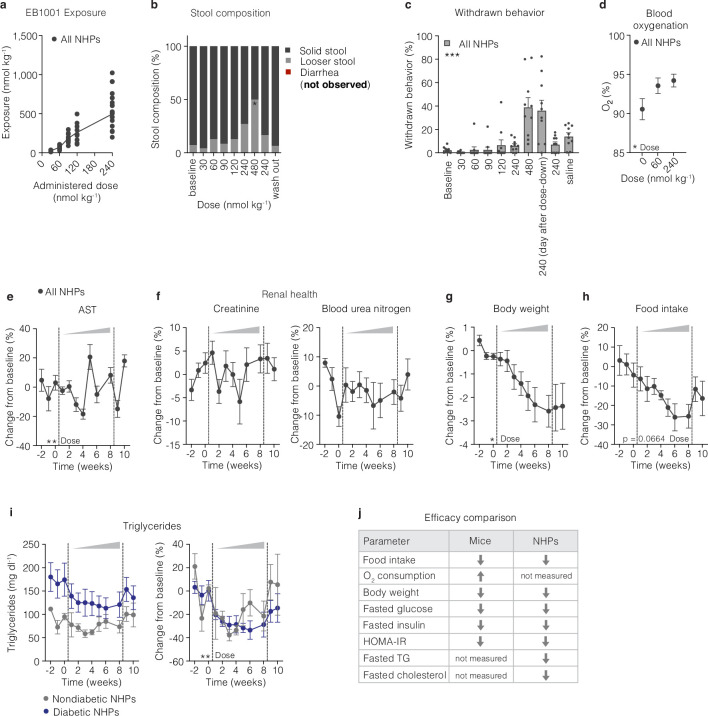
The combination of decreasing food intake and increasing energy expenditure represents a powerful strategy for counteracting cardiometabolic diseases such as obesity and type 2 diabetes1. Yet current pharmacological approaches require conjugation of multiple receptor agonists to achieve both effects2-4, and so far, no safe energy-expending option has reached the clinic. Here we show that activation of neurokinin 2 receptor (NK2R) is sufficient to suppress appetite centrally and increase energy expenditure peripherally. We focused on NK2R after revealing its genetic links to obesity and glucose control. However, therapeutically exploiting NK2R signalling has previously been unattainable because its endogenous ligand, neurokinin A, is short-lived and lacks receptor specificity5,6. Therefore, we developed selective, long-acting NK2R agonists with potential for once-weekly administration in humans. In mice, these agonists elicit weight loss by inducing energy expenditure and non-aversive appetite suppression that circumvents canonical leptin signalling. Additionally, a hyperinsulinaemic-euglycaemic clamp reveals that NK2R agonism acutely enhances insulin sensitization. In diabetic, obese macaques, NK2R activation significantly decreases body weight, blood glucose, triglycerides and cholesterol, and ameliorates insulin resistance. These findings identify a single receptor target that leverages both energy-expending and appetite-suppressing programmes to improve energy homeostasis and reverse cardiometabolic dysfunction across species.


Conflict of interest statement

Competing interests: T.M., J.H.E., J.B.H., D.P.C., M.B.F.G., M.T.-C., T.W.S. and Z.G.-H. work or have worked in some capacity for Embark Laboratories ApS, a company developing therapeutics for the treatment of T2D and obesity. P.K. is a consultant for Embark Laboratories ApS. The use of and chemical composition for NK2R agonists are patented by the University of Copenhagen and Embark Laboratories ApS, respectively. R.J.S. has received research support from Novo Nordisk, Fractyl, AstraZeneca, Congruence Therapeutics, Eli Lilly, Bullfrog AI, Glycsend Therapeutics and Amgen. R.J.S. has served as a paid consultant for Novo Nordisk, Eli Lilly, CinRx, Fractyl, Structure Therapeutics, Crinetics and Congruence Therapeutics. R.J.S. has equity in Calibrate, Rewind and Levator Therapeutics. The other authors declare no competing interests.

Figures

Fig. 1
Fig. 1. NK2R agonism is genetically and functionally linked to cardiometabolic protection.
a, Ranked P values for HbA1c associations of 381 non-odorant GPCR loci (±50 kb) from T2D-KP. b, Gq signalling and HbA1c associations of the NK2R missense variants I23T and R323H (n = 2 per variant). c, TWAS of HK1, NK2R and TSPAN15 and HbA1c levels, with and without adjustment for BMI. d,e, Obesity-related anthropometric associations of the NK2R non-coding variant rs139900276 in the Greenlandic cohort (d) and NK2R expression stratified by rs139900276 genotype (e). WHR, waist–hip ratio. f, Pharmacokinetics of NKA (n = 3 mice). gk, In vivo effects of a twice daily subcutaneous (s.c.) injection of vehicle or 1 mg kg−1 NKA (g) on oxygen consumption (n = 6 mice per group) (h), food intake (i) and body weight (j) and white adipose tissue weight (k) at study conclusion (n = 6 (vehicle), n = 7 mice (NKA)). l, Insulin tolerance test of DIO mice treated with vehicle (n = 6) or NKA (n = 7) twice daily for 12 days. m, Pharmacokinetics of EB0014 (n = 3 mice). n,o, In vivo effects of daily subcutaneous injections of vehicle or 1 mg kg−1 EB0014 (n) on oxygen consumption (o; n = 6 mice per group). pr, Dose-dependent changes in food intake (p), weight loss (q) and body composition (r) after 12 days of daily injections (n = 10 (vehicle, 0.1 mg kg−1), n = 9 (0.3 mg kg−1), n = 8 mice (1 mg kg−1)). Arrowheads indicate time of injection of vehicle or agonist (h,o). Data are mean ± s.e.m. (b,f,hm,or); box plots present median and Tukey’s whiskers (e). *P < 0.05, **P < 0.01, ***P < 0.005, ****P < 0.0001. Detailed statistics are in the Supplementary Information and Source Data. Source Data
Fig. 2
Fig. 2. Development and characterization of first-in-class selective, long-acting NK2R agonists.
a, Signalling schematic for the tachykinin receptor family along with respective endogenous ligands, substance P (SP), NKA and neurokinin B (NKB), adapted from ref. . b, Sequences of NKA and protracted, selective NK2R agonists. c, Ligand-induced Gq signalling of human tachykinin receptors in vitro (n = 2 per ligand). d, Pharmacokinetic profile of NK2R agonists (n = 3 mice per group). ek, In vivo effects of a single injection of EB1002 (e; inset shows the implanted body temperature monitor) on oxygen consumption (f), fatty acid oxidation (g), body temperature (h), food intake (i), RER (j) and weight loss (k) in DIO mice. In fj, arrowheads indicate time of injection of vehicle or EB1002. Plot colours in fk match key in f. n = 6 (vehicle), n = 5 (EB1002) (fi); n = 8 (vehicle), n = 9 (EB1002) (k). lr, Evaluation of in vivo selectivity of EB1002 with or without pre-administration of the NK2R antagonist saredutant in DIO mice (l) on oxygen consumption (m), fatty acid oxidation (n), body temperature (o), food intake (p), RER (q) and weight loss (r). In mq, arrowheads indicate 0.5 h pretreatment with vehicle or saredutant followed by EB1002. Plot colours in mr match key below l. n = 6 per group (m,n,pr); n = 5 per group (o). s,t, Glucose tolerance (s) and insulin level (t) of DIO mice (n = 8 (vehicle), n = 15 (325 nmol kg−1 EB1002), n = 16 (pair-fed with the EB1002-treated group)). u, Setup of the hyperinsulinaemic–euglycaemic clamp study. v,w, Glucose infusion rate (GIR) (v) and glucose uptake into iWAT and eWAT depots (w), for a hyperinsulinaemic–euglycaemic clamp of lean mice 16 h after a single injection of vehicle (n = 7) or EB1002 (n = 8). Data are mean ± s.e.m. *P < 0.05, **P < 0.01, ***P < 0.005, ****P < 0.0001. Detailed statistics are in the Supplementary Information and Source Data. Source Data
Fig. 3
Fig. 3. Improvement of systemic energy homeostasis by long-acting NK2R agonism.
a,b, Weight loss (a) and food intake (b) of DIO mice injected daily with vehicle or EB1002 (n = 6 per group). WT, wild type. c, Weight loss of DIO mice that were transitioned to chow diet or continued on HFD 5 days before daily injections (n = 6 (HFD vehicle), n = 8 (chow vehicle, chow EB1002 and HFD EB1002)). Arrowhead indicates first injection. dg, Plasma concentrations of GLP-1 (d), leptin (e), glucagon (f) and PYY (g) of DIO mice injected daily with vehicle (n = 7) or EB1002 (n = 8). h, Body composition of DIO mice injected daily with vehicle (n = 11) or EB1002 (n = 15). ik, Weight loss (i), food intake (j) and body composition (k) of DIO Nk2r-knockout (KO) mice injected daily with vehicle (n = 8) or EB1002 (n = 9). l, Weight loss of DIO mice injected daily with vehicle (n = 11), EB1002 (n = 15) or vehicle and pair-fed with EB1002-treated mice (n = 12). mt, Schematic of DIO Ucp1-knockout mice at thermoneutrality (m) used to assess weight loss (n), blood glucose concentration (o), RER (p), fatty acid oxidation (q) and oxygen consumption (r), and linear regression of oxygen consumption versus body weight (s) and body temperature (t) after a single injection of vehicle, EB1002 or vehicle and pair-fed with EB1002-treated mice. In pr,t, arrowheads indicate time of injection, diamonds indicate replenishment of food for the pair-fed group. In nt, n = 6 per group. u,v, Weight loss (u) and food intake (v) of DIO, thermoneutrally housed Ucp1-knockout mice injected daily with vehicle (n = 6) or EB1002 (n = 7). wz, Setup of triple-chip study to investigate the anatomical resolution of thermogenic output (w) with interscapular temperature (x; n = 3), hindlimb temperature (y; n = 5) and abdominal temperature (z; n = 5) of DIO mice after a single injection of EB1002 (indicated by arrowheads (xz)). Data are mean ± s.e.m. *P < 0.05, **P < 0.01, ***P < 0.005, ****P < 0.0001. Detailed statistics are in the Supplementary Information and Source Data. Source Data
Fig. 4
Fig. 4. Distinct central and peripheral actions of long-acting NK2R agonism.
a, Study design comparing effects of central and peripheral delivery of EB1002. be, Food intake (b), oxygen consumption (c), weight loss (d) and blood glucose concentration (e) following subcutaneous or ICV injection (all plot colours as in key in b). n = 6 (vehicle subcutaneous injections, EB1002 ICV injections), n = 4 (EB1002 subcutaneous injections, vehicle ICV injections) (b,c); n = 6 (vehicle subcutaneous injections), n = 10 (EB1002 subcutaneous injections), n = 8 (vehicle ICV injections), n = 13 (EB1002 ICV injections) (d,e). Arrowheads indicate injections (c). f,g, Representative FOS staining in the DVC (f; scale bar, 200 µm) and quantification of FOS-positive cells in the NTS, AP and DMV (g) of mice injected with vehicle (n = 6) or EB1002 (n = 8). h, Preference ratio for vehicle, semaglutide or EB1002 (n = 10 per group). i, Representative microscopy images and quantification of FOS colocalization with reporter neurons expressing GFP in the NTS of Leprcre L10 GFP (n = 3 (vehicle), n = 6 (EB1002)), Cckcre L10 GFP (n = 2 (vehicle), n = 3 (EB1002)) and Calcrcre Sun1 GFP mice (n = 6 (vehicle), n = 7 (EB1002)) injected with vehicle or EB1002. Scale bars, 50 µm. Plot colours as in key in b. j, Identity of FOS+ neurons in the NTS of EB1002-injected mice. k, Uniform manifold approximation and projection (UMAP) plot of expression data from 23,664 neurons coloured by populations according to ref. . l, Immediate early gene (IEG) expression in DVC snRNA-seq data from mice injected with vehicle or EB1002 (n = 6 samples with 5 mice per sample). m, Schematic of AAV injection into the DVC of Nk2r-floxed mice. n,o, Food intake (n) and weight loss (o) of Nk2rDVC-GFP and Nk2rDVC-cre mice injected with vehicle or EB1002 (n = 5 per group). pr, Group average FOS heat map (p; scale bar, 500 µm), volcano plot of brain subregions (q) and heat map of activated brain regions involved in feeding, energy expenditure and reward (r) of wild-type DIO mice injected with vehicle or EB1002 (n = 8 per group). Data in j are mean, and data in all other graphs are mean ± s.e.m. *P < 0.05, **P < 0.01, ***P < 0.005, ****P < 0.0001. Detailed statistics are in the Supplementary Information and Source Data. Source Data
Fig. 5
Fig. 5. NK2R agonism safely counteracts cardiometabolic disease in diabetic, obese macaques.
a, Schematic of EB1001 dose-escalation study in rhesus macaques (nonhuman primates (NHPs)). bd, Anxiety-like behaviour (b), heart rate (c) and blood alanine transaminase concentration over the course of the dose-escalation study (n = 10 macaques). e, Stratification of macaque groups on the basis of diabetic status. fk, Changes in body weight (f), food intake (g), fasting blood glucose (h), insulin level (i), HOMA-IR (j) and insulin:C-peptide ratio (k) for normoglycaemic (n = 3) and diabetic (n = 7) macaques. All plot colours as in key in f. l, Changes in triglyceride concentrations for all macaques over the course of the study (n = 10 macaques). mo, Stratification of macaque groups on the basis of baseline cholesterol levels (m) and changes in total cholesterol (n) and LDL cholesterol (o) over the course of the dose escalation. All plot colours as in key in n. n = 4 macaques (low baseline cholesterol), n = 6 macaques (high baseline cholesterol). Data are mean ± s.e.m. *P < 0.05, **P < 0.01, ***P < 0.005, ****P < 0.0001. Detailed statistics are in the Supplementary Information and Source Data. Source Data
Extended Data Fig. 1
Extended Data Fig. 1. Effect of NK2R genetic variants on receptor signaling.
a, Gq signalling and HbA1c associations of NK2R missense variants, V54I, A161T, T363A, T346M and H395R, (n = 2 per variant). b, Haplotype plot of HbA1c associations in the HKDC1-HK1-NK2R-TSPAN15 locus. Data are represented as mean ± s.e.m. Two-sided association tests without multiple corrections, a.
Extended Data Fig. 2
Extended Data Fig. 2. Development and acute testing of NK2R selective agonists.
a, Mouse tachykinin receptor signaling with endogenous ligands and EB1001, b, mouse tachykinin receptor signaling with endogenous ligands and EB1002, and, c, human tachykinin receptor signaling with endogenous ligands and EB1001, (n = 2 per variant for a-c). d, Cumulative locomotor activity of DIO mice following a single injection of vehicle (n = 6 mice) or 325 nmol/kg (n = 5 mice). e, Serum liver enzymes (n = 4 (ALT EB1002), n = 5 mice for remaining data) and f, representative microscopy images of various tissues of CD-1 mice after injections with vehicle or increasing concentrations of EB1002 (see methods, 7500 nmol/kg EB1002 prior to euthanasia), scale bars 100 µm. g, Oxygen consumption, h, fatty acid oxidation, i, body temperature, j, food intake, k, RER, and, l, weight loss of DIO Nk2r KO mice following a single injection of vehicle or 325 nmol/kg EB1002 (n = 6 mice per group for e, f, h-j, l, n = 5 mice per group for g), downward triangles signify time of injection. m, clamped blood glucose, n, steady state mouse and human insulin levels and o, glucose uptake into metabolically active tissues for a hyperinsulinemic-euglycemic clamp of lean mice following a single injection of vehicle (n = 7 mice) or 325 nmol/kg EB1002 (n = 8 mice). p, in vitro glucose uptake (n = 6 each condition) and q, oxygen consumption of primary white adipocytes (WA) in response to various concentrations of EB1002 (n = 6 (vehicle), n = 8 (each EB1002 concentration)). r, ex vivo lipolysis of mature inguinal WA in response to various concentrations of EB1002 and 50 nM isoproterenol (n = 3 each condition). Representative western blot images and quantification of s, liver, t, gastrocnemius, u, BAT and, v, iWAT of DIO mice treated with vehicle or 325 nmol/kg EB1002 18 h prior to injections with a mock solution or insulin (n = 5 (vehicle/mock), n = 6 (EB1002/mock, vehicle/insulin) n = 7 mice (EB1002/insulin)). Data are represented as mean ± s.e.m. For all: *P < 0.05, **P < 0.01, ***P < 0.005, ****P < 0.0001. Unpaired two-tailed t-test of AUC for 48 h after injection, d, g-k; unpaired two-tailed t-test, e, l, n, o; repeated measures two-way ANOVA with Geisser-Greenhouse correction, significance indicates treatment effect, m; ordinary one-way ANOVA with Tukey’s multiple comparisons test, significance shows post hoc test for treatment effect, p, r; ordinary one-way ANOVA of AUC for baseline, compound (cpd), NE and FCCP increments, q; and ordinary two-way ANOVA with Sidak’s multiple comparison, significance indicates post hoc test between vehicle and EB1002 treated mice, s-v. Uncropped blots are presented in Supplementary Fig. 1. Source Data
Extended Data Fig. 3
Extended Data Fig. 3. In vivo effects of repeated NK2R agonist dosing.
a, Weight loss of DIO mice that have been injected s.c. daily with vehicle or 325 nmol/kg EB1002 (q.d. EB1002), or every other day with 325 nmol/kg EB1002 (q.o.d. EB1002) (n = 10 mice per group), and b, weight trajectory of the same mice including a washout period and a single re-injection with 325 nmol/kg EB1002, with c, weight loss after re-injection. d, Faecal lipid content and e, faecal cholesterol content of DIO mice that have been injected s.c. daily with vehicle or 325 nmol/kg EB1002 (n = 6 mice (d1 vehicle and d7 vehicle and EB1002), n = 12 mice (d1 EB1002)). f, Weight loss of DIO mice that were transitioned to chow diet or continued on HFD 5 days prior to daily s.c. injections with vehicle or 325 nmol/kg EB1002, data normalized to d0 (n = 6 mice (HFD vehicle), n = 8 mice (chow vehicle, chow EB1002 and HFD EB1002)). g, Adipose tissue weights of DIO mice that have been injected s.c. daily with vehicle (n = 11 mice) or 325 nmol/kg EB1002 (n = 15 mice) for 7 days. h, Weight loss, i, body composition, j, adipose depot weights, k, blood glucose, l, food intake, m, RER, n, oxygen consumption, o, fatty acid oxidation, and p, body temperature of female DIO mice that have been injected s.c. daily with vehicle or 325 nmol/kg EB1002 (n = 6 mice per group (f, I, j-m), n = 17 mice per group (g, h), n = 6 mice (vehicle) and n = 5 mice (EB1002) for n), downward triangles signify time of injection. q, Adipose depot weights of DIO Nk2r KO mice that have been injected s.c. daily with vehicle (n = 8 mice) or 325 nmol/kg EB1002 (n = 9 mice). r, Interscapular temperature (n = 3 mice), s, hindlimb temperature (n = 5 mice), t, abdominal temperature (n = 5 mice) of DIO mice after a single s.c. injection of vehicle, downward triangles signify time of vehicle injection. u, Schematic setup of triple chip study to interrogate anatomical resolution of thermogenic output with v, interscapular temperature, w, hindlimb temperature, and x, abdominal temperature of BAT denervated DIO mice after a single injection of 325 nmol/kg EB1002 and vehicle (n = 3 mice), downward triangles signify time of injection of the indicated compound. y, Representative western blot images and quantification of BAT from sham operated or BAT denervated mice (n = 6 (sham), n = 4 mice (DNV), each BAT lobe has been analyzed separately). Data are represented as mean ± s.e.m. For all: *P < 0.05, **P < 0.01, ***P < 0.005, ****P < 0.0001. Repeated measures two-way ANOVA with Geisser-Greenhouse correction and Tukey’s multiple comparison test, significance indicates post hoc test for treatment effect at last timepoint, a, f; repeated measures two-way ANOVA with Geisser-Greenhouse correction, significance indicates treatment effect, c, h; repeated measures two-way ANOVA with Geisser-Greenhouse correction and Sidak’s multiple comparison test, significance indicates post hoc test for treatment effects, d, e; unpaired two-tailed t-test, g, i, j, q, y; repeated measures two-way ANOVA and Sidak’s multiple comparison, significance indicates time effect, k; unpaired two-tailed t-test of AUC of 24 h increments, l-p. Source Data
Extended Data Fig. 4
Extended Data Fig. 4. Anatomical resolution of NK2R agonism.
a, Genetic models of hyperphagic obesity used to interrogate NK2R agonist-dependent appetite suppression. b, Food intake following a single s.c. administration of vehicle or 325 nmol/kg EB1002 to DIO, male and female leptin deficient (ob/ob) and Mc4r KO mice (n = 6 mice (DIO, vehicle), n = 5 mice (DIO, EB1002), n = 8 mice (male ob/ob, vehicle; female ob/ob), n = 6 mice (male ob/ob, EB1002), n = 11 mice (Mc4r KO, vehicle), n = 8 mice (Mc4r KO, EB1002)). c, Weight loss, d, blood glucose and e, food intake of ob/ob mice housed at thermoneutrality following a single s.c. injection of vehicle or 325 nmol/kg EB1002 (n = 6 mice each group). f, Schematic of crossover study comparing in vivo effects of peripheral versus central delivery of EB1002 on g, RER, h, body temperature following s.c. or ICV injection (n = 6 (vehicle s.c injections and EB1002 ICV injections), n = 4 (EB1002 s.c. injections and vehicle ICV injections)), downward triangles signify time of injection (g, h). i, RER, j, oxygen consumption, k, food intake, l, weight loss and m, blood glucose of ob/ob mice following a single s.c. injection of vehicle or 40 nmol/kg EB1002 (n = 4 mice each group). Data are represented as mean ± s.e.m. For all: *P ≤ 0.05, **P < 0.01, ***P < 0.005, ****P < 0.0001. Unpaired two-tailed t-test of AUC b; Repeated measures two-way ANOVA with Geisser-Greenhouse correction, significance indicates treatment effect, c, e; Repeated measures two-way ANOVA with Sidak’s multiple comparison test, significance shows post hoc test for treatment effects, d; unpaired two-tailed t-test of AUC for 48 h after injection, g-k; unpaired two-tailed t-test, l; Repeated measures two-way ANOVA, m. Source Data
Extended Data Fig. 5
Extended Data Fig. 5. Central effects of NK2R agonism.
a, Food intake in over-night fasted mice that have been s.c. injected with vehicle or 325 nmol/kg EB1002 at time of refeeding (n = 10 mice per group). b, Schematics of brain sections (adopted from The Allen Brain Atlas) and representative images of FOS staining (purple) with c, quantification of FOS positive cells in the paraventricular nucleus of the hypothalamus (PVH), the dorsomedial hypothalamic nucleus (DMH), arcuate nucleus (ARH), the parabrachial nucleus (PBN) and the dorsal vagal complex (DVC) of overnight fasted mice injected with vehicle or 325 nmol/kg EB1002 2 h prior to euthanasia (n = 4 mice per group), scale bar 200 µm. d, Liquid phase gastric emptying of mice s.c. injected with vehicle or 325 nmol/kg EB1002 (n = 10 mice each group). Representative microscopy images and quantification of FOS (purple) colocalization with reporter neurons (green) in the DVC of e, LeprCreL10 GFP (n = 3 (vehicle), n = 6 (EB1002)), f, CckCreL10 GFP (n = 2 (vehicle), n = 3 (EB1002)), and, g, CalcrCre Sun1 GFP mice (n = 6 (vehicle), n = 7 (EB1002)) injected with vehicle or EB1002, scale bar 200 µm. h, UMAP plot of 23,664 neurons colored by treatment, i, violin plot, and j, transcriptional case-control analysis of single nuclei RNA sequencing data of the DVC of mice s.c. injected with vehicle or 325 nmol/kg EB1002 2 h prior to euthanasia (n = 6 samples with 5 mice/sample). k, in situ hybridization of Nk2r (red), Calcr (green) and Glp1r (purple) in the DVC, scale bar: top panel 200 µm, bottom panel 50 µm. l, Representative microscopy images of the hit sites, scale bar 200 µm. m, Representative microscopy images of Fluoro-Jade C stain in the DVC of Nk2r floxed mice that received a bilateral injection of AAV-GFP (Nk2rDVC-GFP) or AAV-Cre (Nk2rDVC-Cre) into the DVC, scale bar 200 µm, (n = 3 mice per group). Data are represented as mean ± s.e.m. For all: *P ≤ 0.05, **P < 0.01, ***P < 0.005, ****P < 0.0001. Repeated measures two-way ANOVA with Geisser-Greenhouse correction, significance indicates treatment effect, a; unpaired two-tailed t-test, c, d, m; for j red color indicates *P < 0.05. Source Data
Extended Data Fig. 6
Extended Data Fig. 6. Effects of NK2R agonism in nonhuman primates.
a, Exposure to EB1001 after s.c. injections of different doses. b, stool composition, c, changes in withdrawn behaviour, d, blood oxygenation, e, blood aspartate transaminase (AST), f, creatinine and blood urea nitrogen levels, g, body weight, and h, food intake during the dose escalation study (n = 10 nonhuman primates (NHPs) for a-h). i, Changes in triglycerides (raw-left side and %-right side), normoglycemic (n = 3 NHPs) and diabetic NHPs (n = 7 NHPs). j, Summary comparison of effects of NK2R agonism between mice and NHPs. Data are represented as mean ± s.e.m. For all: *P < 0.05, **P < 0.01, ***P < 0.005, ****P < 0.0001. Repeated measures one-way ANOVA with Geisser-Greenhouse correction and Dunnett’s multiple comparison test, significance indicates post-test between vehicle and treatments, b; repeated measures one-way ANOVA with Geisser-Greenhouse correction, c-h; Repeated measures two-way ANOVA with Geisser-Greenhouse correction, i. Source Data

Comment in

References

    1. Christoffersen, B. Ø. et al. Beyond appetite regulation: targeting energy expenditure, fat oxidation, and lean mass preservation for sustainable weight loss. Obesity30, 841–857 (2022). - PMC - PubMed
    1. Müller, T. D., Blüher, M., Tschöp, M. H. & DiMarchi, R. D. Anti-obesity drug discovery: advances and challenges. Nat. Rev. Drug Discov.21, 201–223 (2022). - PMC - PubMed
    1. Coskun, T. et al. LY3437943, a novel triple glucagon, GIP, and GLP-1 receptor agonist for glycemic control and weight loss: from discovery to clinical proof of concept. Cell Metab.34, 1234–1247.e9 (2022). - PubMed
    1. Finan, B. et al. A rationally designed monomeric peptide triagonist corrects obesity and diabetes in rodents. Nat. Med.21, 27–36 (2015). - PubMed
    1. Steinhoff, M. S., von Mentzer, B., Geppetti, P., Pothoulakis, C. & Bunnett, N. W. Tachykinins and their receptors: contributions to physiological control and the mechanisms of disease. Physiol. Rev.94, 265–301 (2014). - PMC - PubMed

MeSH terms