

Accounting for bias due to outcome data missing not at random: comparison and illustration of two approaches to probabilistic bias analysis: a simulation study
- PMID: 39538117
- PMCID: PMC11558901
- DOI: 10.1186/s12874-024-02382-4
Accounting for bias due to outcome data missing not at random: comparison and illustration of two approaches to probabilistic bias analysis: a simulation study
Abstract
Background: Bias from data missing not at random (MNAR) is a persistent concern in health-related research. A bias analysis quantitatively assesses how conclusions change under different assumptions about missingness using bias parameters that govern the magnitude and direction of the bias. Probabilistic bias analysis specifies a prior distribution for these parameters, explicitly incorporating available information and uncertainty about their true values. A Bayesian bias analysis combines the prior distribution with the data's likelihood function whilst a Monte Carlo bias analysis samples the bias parameters directly from the prior distribution. No study has compared a Monte Carlo bias analysis to a Bayesian bias analysis in the context of MNAR missingness.
Methods: We illustrate an accessible probabilistic bias analysis using the Monte Carlo bias analysis approach and a well-known imputation method. We designed a simulation study based on a motivating example from the UK Biobank study, where a large proportion of the outcome was missing and missingness was suspected to be MNAR. We compared the performance of our Monte Carlo bias analysis to a principled Bayesian bias analysis, complete case analysis (CCA) and multiple imputation (MI) assuming missing at random.
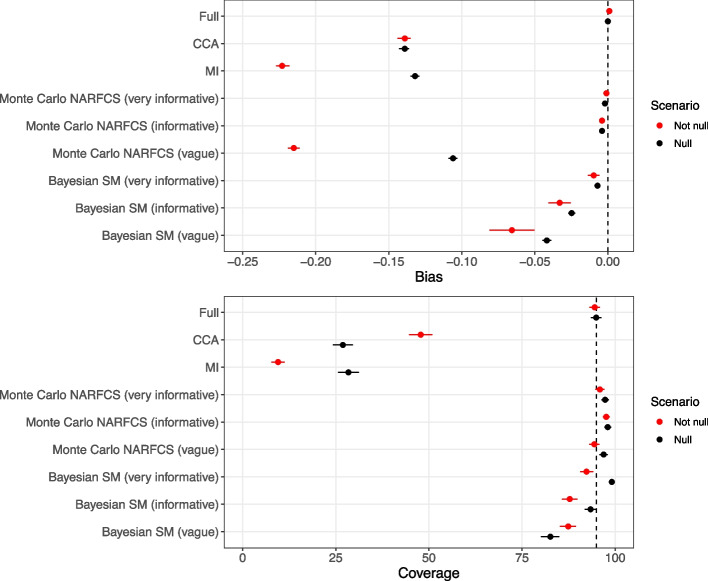
Results: As expected, given the simulation study design, CCA and MI estimates were substantially biased, with 95% confidence interval coverages of 7-48%. Including auxiliary variables (i.e., variables not included in the substantive analysis that are predictive of missingness and the missing data) in MI's imputation model amplified the bias due to assuming missing at random. With reasonably accurate and precise information about the bias parameter, the Monte Carlo bias analysis performed as well as the Bayesian bias analysis. However, when very limited information was provided about the bias parameter, only the Bayesian bias analysis was able to eliminate most of the bias due to MNAR whilst the Monte Carlo bias analysis performed no better than the CCA and MI.
Conclusion: The Monte Carlo bias analysis we describe is easy to implement in standard software and, in the setting we explored, is a viable alternative to a Bayesian bias analysis. We caution careful consideration of choice of auxiliary variables when applying imputation where data may be MNAR.
Keywords: Bayesian bias analysis; Inverse probability weighting; Missing not at random; Monte Carlo bias analysis; Multiple imputation; Probabilistic bias analysis; Sensitivity analysis; UK Biobank.
© 2024. The Author(s).
Conflict of interest statement
Figures
References
-
- Rubin D. Inference and missing data. Biometrika. 1976;63:581–92.
-
- Li Y, Miao W, Shpitser I, Tchetgen Tchetgen EJ. A self-censoring model for multivariate nonignorable nonmonotone missing data. Biometrics. 2023;: 1–12. - PubMed
-
- Giusti C, Little RJ. An analysis of nonignorable nonresponse to income in a survey with a rotating panel design. J Official Statistics. 2011;27(2):211–29.
Publication types
MeSH terms
LinkOut - more resources
Full Text Sources
Research Materials
Miscellaneous
