

Physiological, transcriptomic, and metabolomic analyses of the chilling stress response in two melon (Cucumis melo L.) genotypes
- PMID: 39538130
- PMCID: PMC11562333
- DOI: 10.1186/s12870-024-05773-3
Physiological, transcriptomic, and metabolomic analyses of the chilling stress response in two melon (Cucumis melo L.) genotypes
Abstract
Background: Chilling stress is a key abiotic stress that severely restricts the growth and quality of melon (Cucumis melo L.). Few studies have investigated the mechanism of response to chilling stress in melon.
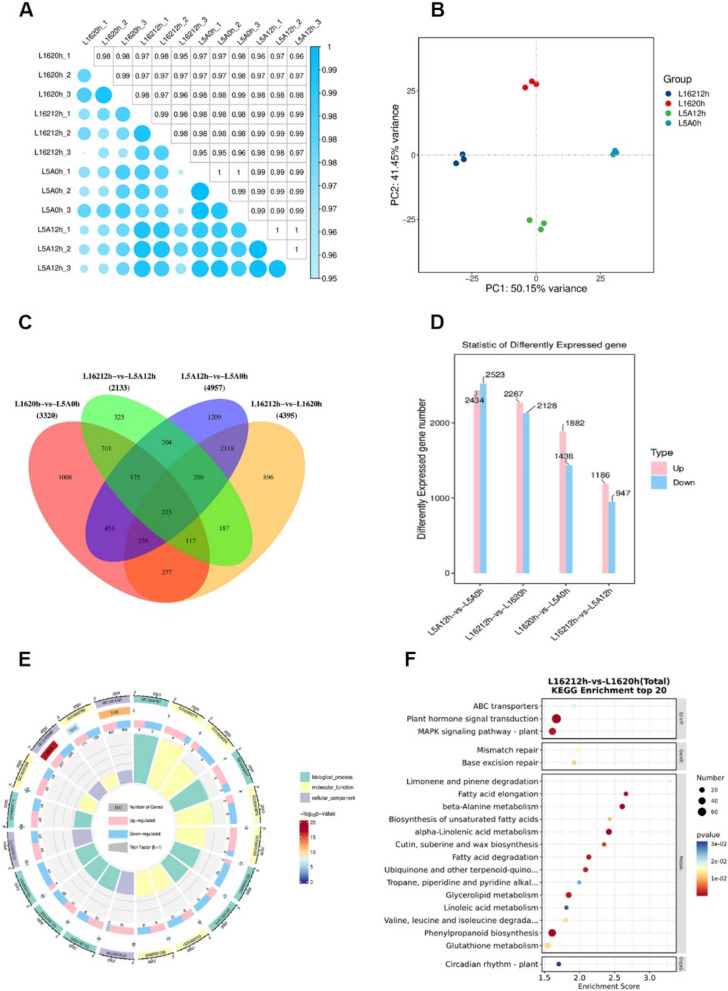
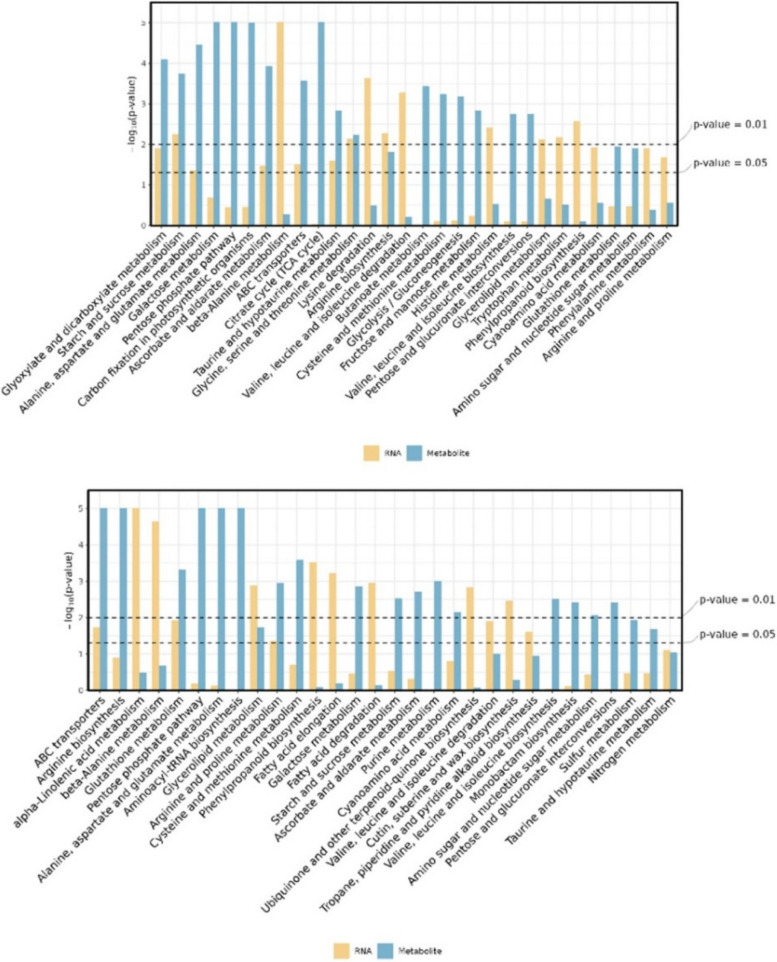
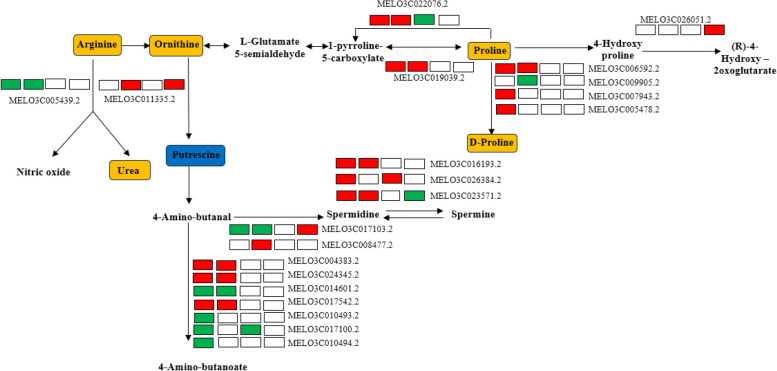
Results: We characterized the physiological, transcriptomic, and metabolomic response of melon to chilling stress using two genotypes with different chilling sensitivity ("162" and "13-5A"). "162" showed higher osmotic regulation ability and antioxidant capacity to withstand chilling stress. Transcriptome analysis identified 4395 and 4957 differentially expressed genes (DEGs) in "162" and "13-5A" under chilling stress, respectively. Metabolome analysis identified 615 and 489 differential enriched metabolites (DEMs) were identified in "162" and "13-5A" under chilling stress condition, respectively. Integrated transcriptomic and metabolomic analysis showed enrichment of glutathione metabolism, and arginine (Arg) and proline (Pro) metabolism, with differential expression patterns in the two genotypes. Under chilling stress, glutathione metabolism-related DEGs, 6-phosphogluconate dehydrogenase (G6PDH), glutathione peroxidase (GPX), and glutathione s-transferase (GST) were upregulated in "162," and GSH conjugates (L-gamma-glutamyl-L-amino acid and L-glutamate) were accumulated. Additionally, "162" showed upregulation of DEGs encoding ornithine decarboxylase, Pro dehydrogenase, aspartate aminotransferase, pyrroline-5-carboxylate reductase, and spermidine synthase and increased Arg, ornithine, and Pro. Furthermore, the transcription factors (TFs), MYB, ERF, MADS-box, and bZIP were significantly upregulated, suggesting their crucial role in chilling tolerance of melon.
Conclusions: These findings elucidate the molecular response mechanism to chilling stress in melon and provide insights for breeding chilling-tolerant melon.
Keywords: Chilling stress; Melon; Metabolome; Transcriptome.
© 2024. The Author(s).
Conflict of interest statement
Figures


Similar articles
-
Transcriptome profiling reveals the mechanism of fruit navel development in melon (Cucumis melo L.).BMC Plant Biol. 2025 Apr 3;25(1):420. doi: 10.1186/s12870-025-06444-7. BMC Plant Biol. 2025. PMID: 40181289 Free PMC article.
-
Integrative multi-omics analysis of chilling stress in pumpkin (Cucurbita moschata).BMC Genomics. 2024 Nov 5;25(1):1042. doi: 10.1186/s12864-024-10939-2. BMC Genomics. 2024. PMID: 39501146 Free PMC article.
-
CmTGA8-CmAPX1/CmGSTU25 regulatory model involved in trehalose induced cold tolerance in oriental melon seedlings.Plant Physiol Biochem. 2025 Mar;220:109432. doi: 10.1016/j.plaphy.2024.109432. Epub 2024 Dec 19. Plant Physiol Biochem. 2025. PMID: 39884148
-
Genes, pathways and transcription factors involved in seedling stage chilling stress tolerance in indica rice through RNA-Seq analysis.BMC Plant Biol. 2019 Aug 14;19(1):352. doi: 10.1186/s12870-019-1922-8. BMC Plant Biol. 2019. PMID: 31412781 Free PMC article.
-
Molecular Markers for Marker-Assisted Breeding for Biotic and Abiotic Stress in Melon (Cucumis melo L.): A Review.Int J Mol Sci. 2024 Jun 7;25(12):6307. doi: 10.3390/ijms25126307. Int J Mol Sci. 2024. PMID: 38928017 Free PMC article. Review.
Cited by
-
Transcriptomic and Metabolomic Joint Analysis Revealing Different Metabolic Pathways and Genes Dynamically Regulating Bitter Gourd (Momordica charantia L.) Fruit Growth and Development in Different Stages.Plants (Basel). 2025 Jul 21;14(14):2248. doi: 10.3390/plants14142248. Plants (Basel). 2025. PMID: 40733485 Free PMC article.
References
-
- Sinha S, Kukreja B, Arora P, et al. The omics of cold stress responses in plants. In: Pandey GK, editor. Elucidation of Abiotic Stress Signaling in plants: Functional Genomics perspectives. Volume 2. New York: Springer; 2015. pp. 143–94.
-
- Barrero-Gil J, Huertas R, Rambla J-L, et al. Tomato plants increase their tolerance to low temperature in a chilling acclimation process entailing comprehensive transcriptional and metabolic adjustments. Plant Cell Environ. 2016;39:2303–18. - PubMed
-
- Welling A, Palva E-T. Molecular control of cold acclimation in trees. Physiol Plant. 2010;127:167e181.
MeSH terms
Grants and funding
- Shanghai Agricultural Science (2024) No.1/Shanghai Melon and Fruit Industry Technology System
- Shanghai Agricultural Science (2024) No.1/Shanghai Melon and Fruit Industry Technology System
- Shanghai Agricultural Science (2024) No.1/Shanghai Melon and Fruit Industry Technology System
- Shanghai Agricultural Science (2024) No.1/Shanghai Melon and Fruit Industry Technology System
- Shanghai Agricultural Science (2024) No.1/Shanghai Melon and Fruit Industry Technology System
- Shanghai Agricultural Science (2024) No.1/Shanghai Melon and Fruit Industry Technology System
- (2022),020/Excellent Team of Shanghai Academy of Agricultural Sciences, watermelon and Melon Innovation Team
- (2022),020/Excellent Team of Shanghai Academy of Agricultural Sciences, watermelon and Melon Innovation Team
- (2022),020/Excellent Team of Shanghai Academy of Agricultural Sciences, watermelon and Melon Innovation Team
- (2022),020/Excellent Team of Shanghai Academy of Agricultural Sciences, watermelon and Melon Innovation Team
- (2022),020/Excellent Team of Shanghai Academy of Agricultural Sciences, watermelon and Melon Innovation Team
LinkOut - more resources
Full Text Sources
Research Materials
