. 2024 Nov 13;24(1):377.
doi: 10.1186/s12935-024-03550-8.

MicroRNAome profiling of breast cancer unveils hsa-miR-5683 as a tumor suppressor microRNA predicting favorable clinical outcome

Affiliations

MicroRNAome profiling of breast cancer unveils hsa-miR-5683 as a tumor suppressor microRNA predicting favorable clinical outcome

Bushra Yasin Abohalawa et al. Cancer Cell Int. .

Abstract

Background: Breast cancer is a heterogeneous disease with diverse molecular subtypes, underscoring a better understanding of its molecular features and underlying regulatory mechanisms. Therefore, identifying novel prognostic biomarkers and therapeutic targets is crucial for advancing the current standard of care for breast cancer patients.

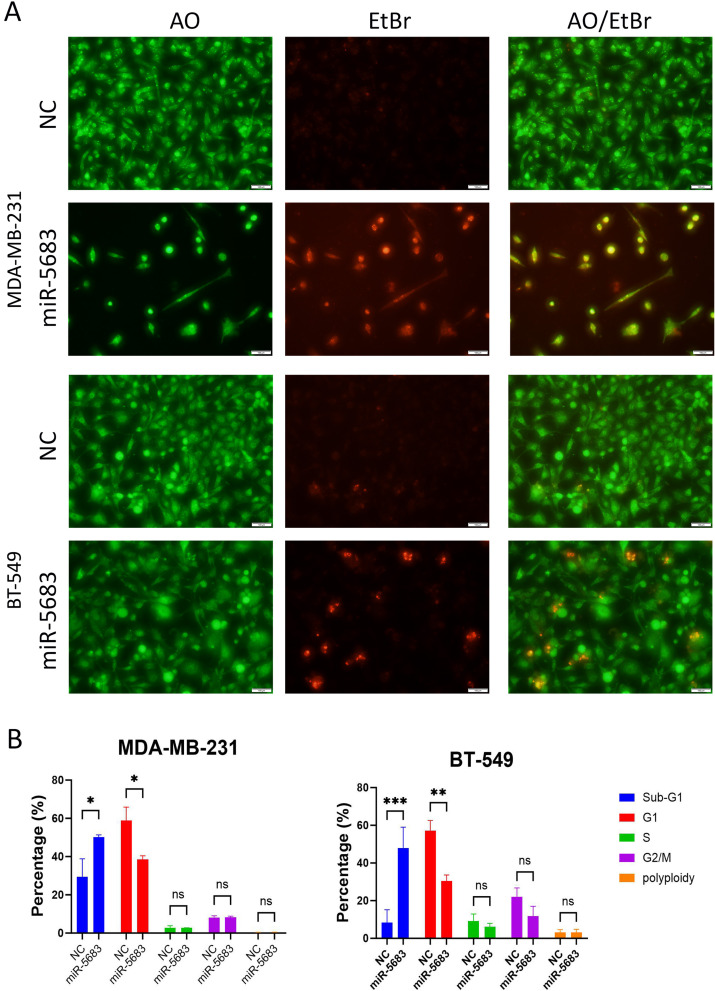
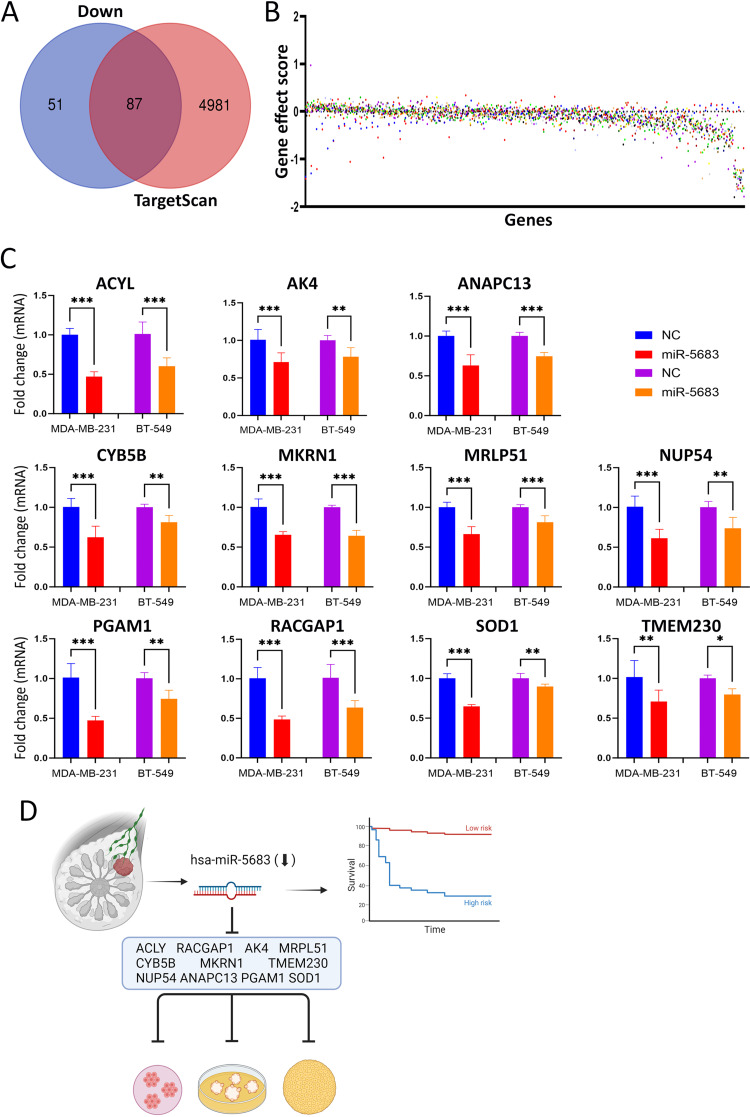
Methods: Ninety-six formalin-fixed paraffin-embedded (FFPE) breast cancer samples underwent miRNAome profiling using QIAseq microRNA library kit and sequencing on Illumina platform. Mature miRNA quantification was conducted using CLC Genomics Workbench v21.0.5, while Relapse-free survival (RFS) analysis was conducted using RStudio 2023.09.1. Gain-of-function studies were conducted using miRNA mimics, while the effects of miRNA exogenous expression on cancer hallmark were assessed using 2-dimentional (2D) proliferation assay, three-dimensional (3D) organotypic culture, and live-dead staining. TargetScan database and Ingenuity Pathway Analysis (IPA) were used for miRNA target identification.

Results: Hierarchical clustering based on miRNA expression revealed distinct patterns in relation to PAM50 classification and identified miRNAs panels associated with luminal, HER2, and basal subtypes. hsa-miR-5683 emerged as a potential prognostic biomarker, showing a favorable correlation with RFS and suppressing tumorigenicity under 2D and 3D conditions in triple-negative breast cancer (TNBC) models. Findings were further extended to the MCF7 hormone receptor positive (HR+) model. Transcriptomic profiling of hsa-miR-5683 overexpressing TNBC cells revealed its potential role in key oncogenic pathways. Integration of downregulated genes and CRISPR-Cas9 perturbational effects identified ACLY, RACGAP1, AK4, MRPL51, CYB5B, MKRN1, TMEM230, NUP54, ANAPC13, PGAM1, and SOD1 as bona fide gene targets for hsa-miR-5683.

Conclusions: Our data provides comprehensive miRNA expression atlas in breast cancer subtypes and underscores the prognostic and therapeutic significance of numerous miRNAs, including hsa-miR-5683 in TNBC. The identified gene targets unravel the intricate regulatory network in TNBC progression, suggesting promising avenues for further research and targeted therapeutic interventions.

Keywords: Breast cancer; Prognostic biomarker; Survival; Therapeutic target; microRNA.


Conflict of interest statement

Declarations Ethics approval and consent to participate The study was performed under ethical approval from HMC (MRC-01-19-142) and from Qatar Biomedical Research Institute (QBRI-IRB 2020-09-035). Consent was not required for this study since the study was conducted on archived FFPE samples. Consent for publication All authors have consented to the publication of this manuscript. Competing interests The authors declare no competing interests.

Figures

Fig. 1
Fig. 1
Hierarchical clustering and differential miRNA expression analysis in breast cancer. A Illustration of overall study design. B Heatmap depicting clustering of 96 breast cancer patients according to top 200 most variable miRNAs in relation to PAM50 intrinsic subtype classification (Luminal, Basal, HER2, and Normal-like (designated as Normal)). Color scale depicts the expression level of each miRNA. Each row represents a single miRNA, and each column represents a sample. C Bar chart (upper panel) depicting the number of DEMs in Luminal vs. Normal, HER2 vs. Normal, HER2 vs. Luminal, Basal vs. Normal, Basal vs. Luminal, and Basal vs. HER2 using 1.5 FC and < 0.05 FDR, after adjusting for age and tumor grade. Volcano plot (lower panel) illustrating the DEMs in Basal vs. Luminal subtypes with upregulated (red) and downregulated (blue) miRNAs highlighted. D Violin plots illustrating the top five upregulated (top) and five downregulated (bottom) miRNAs in Basal bs Luminal subtypes. * p < 0.05, ** p < 0.005, **** p < 0.00005
Fig. 2
Fig. 2
Hsa-miR-5683 predicts a better prognosis and suppresses tumorigenicity of TNBC. A Kaplan Meier survival plot for 84 breast cancer patients stratified according to median hsa-miR-5683 expression, after adjusting for age, tumor grade, and molecular subtypes. P value for curve comparison is indicated on the plot. B Violin plot illustrating the expression of hsa-miR-5683 in normal breast tissue (n = 104) compared to normal-like (n = 31), LumA (n = 451), LumB (n = 186), HER2 (n = 71), and Basal (n = 149) breast cancer subtypes based on ExplORRnet database. C Representative images illustrating effects of exogenous expression of hsa-miR-5683 on MDA-MB-231 and BT-549 cell proliferation. D Quantification of proliferation potential in hsa-miR-5683 mimic compared to negative control transfected cells. Data are presented as mean ± S.D., n = 4. Representative images illustrating suppression of 3D (E) and spheroid (F) growth of MDA-MB-231 and BT-549 in response to exogenous expression of hsa-miR-5683
Fig. 3
Fig. 3
Dead-live staining and cell cycle distribution of TNBC cells in response to exogeneous expression of hsa-miR-5683. A Representative fluorescence images for MDA-MB-231 and BT-549 TNBC models post transfection with hsa-miR-5683 mimics compared to negative control. Cells were stained on day 5 with AO/EtBr to detect dead cells (red; necrotic). B Cell cycle analysis depicting the proportion of cells in the indicated stage of cell cycle in hsa-miR-5683 overexpressing and control TNBC cells. Data are presented as mean ± S.D., n = 4
Fig. 4
Fig. 4
Transcriptomic profiling of hsa-miR-5683 overexpressing cells revealed a role for hsa-miR-5683 in regulating key oncogenic pathways in TNBC. A Heatmap illustrating alterations in gene expression in MDA-MB-231 and BT-549 cells overexpressing hsa-miR-5683 compared to control cells. B Enrichment tree depicting top affected GO pathways based on DEGs in TNBC cell overexpressing hsa-miR-5683. C Bubble chart illustrating activated (orange) and suppressed (blue) canonical pathways in TNBC cells overexpressing hsa-miR-5683 employing IPA. D Identification of bona fide gene targets for hsa-miR-5683 employing IPA tool. The shape indicates the class of each identified gene target according to the figure legend
Fig. 5
Fig. 5
Identification of hsa-miR-5683 gene targets essential for TNBC. A Venn diagram illustrating the overlap between downregulated genes in TNBC cells overexpressing hsa-miR-5683 and predicted hsa-miR-5683 gene targets based on TargetScan database. B Gene effect plot illustrating the gene effect score (y-axis) for the identified hsa-miR-5683 gene targets (x-axis) employing CRISPR-Cas9 screen data from dependency map. C Validation of eleven identified hsa-miR-5683 gene targets in MDA-MB-231 and BT-549 TNBC cells overexpressing hsa-miR-5683 or negative control using RT-qPCR. Data are presented as mean ± S.D. from two independent experiments, n = 6. *p < 0.05, **p < 0.005, ***p < 0.0005. D Schematic presentation illustrating elevated expression of hsa-miR-5683 to predict favorable prognosis. Reinstated expression of hsa-miR-5683 suppressed cancer hallmarks, in part, through regulation of the eleven indicated bona fide gene targets

References

    1. Siegel RL, Miller KD, Wagle NS, Jemal A. Cancer statistics, 2023. Ca Cancer J Clin. 2023;73(1):17–48. - PubMed
    1. Sung H, Ferlay J, Siegel RL, Laversanne M, Soerjomataram I, Jemal A, Bray F. Global cancer statistics 2020: GLOBOCAN estimates of incidence and mortality worldwide for 36 cancers in 185 countries. Cancer J Clin. 2021;71(3):209–49. - PubMed
    1. Alteri R, Barnes C, Burke A, Gansler T, Gapstur S, Gaudet M, Kramer J, Newman L, Niemeyer D, Richards C. Breast cancer facts & figs. Atlanta: American Cancer Society; 2013. pp. 2013–4.
    1. Bener A, Ayub H, Kakil R, Ibrahim W. Patterns of cancer incidence among the population of Qatar: a worldwide comparative study. Asian Pac J Cancer Prev. 2008;9(1):19–24. - PubMed
    1. Boyle P, Levin B. World cancer report 2008. IARC Press, International Agency for Research on Cancer; 2008.

LinkOut - more resources