Uncovering SPP1+ Macrophage, Neutrophils and Their Related Diagnostic Biomarkers in Intracranial Aneurysm and Subarachnoid Hemorrhage
- PMID: 39539729
- PMCID: PMC11559423
- DOI: 10.2147/JIR.S493828
Uncovering SPP1+ Macrophage, Neutrophils and Their Related Diagnostic Biomarkers in Intracranial Aneurysm and Subarachnoid Hemorrhage
Abstract
Background: Intracranial aneurysms (IA) frequently cause subarachnoid hemorrhage (SAH) and have poor prognosis. However, the molecular mechanisms and diagnostic biomarkers associated with IA and ruptured IA (rIA) remain poorly understood.
Methods: In this study, single-cell and transcriptome datasets were obtained from the GEO database. The cell populations were annotated to identify potential pathogenic subpopulations, followed by intercellular communication, pseudotime, and SCENIC analyses. Proteome-wide and transcriptome-wide Mendelian randomization (MR) analyses were conducted to identify risk factors for IA and SAH. The major pathological changes and diagnostic biomarkers of IA and SAH were identified based on the transcriptome datasets. A clinical cohort was established to identify the diagnostic biomarkers and validate the results.
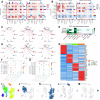
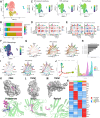
Results: Macrophages and neutrophils were predominantly increased in IA and rIA tissues, and neutrophils were markedly upregulated in the blood of SAH patients. SPP1+ Macrophage was progressively elevated in aneurysms, promoting vascular smooth muscle cell (VSMC) phenotypic transformation and collagen matrix remodeling through the SPP1 and TGF-β pathways. Furthermore, HIF1α regulon was enriched in SPP1+ Macrophage, mediating inflammation and metabolic reprogramming, which contributed to IA progression. Integrated MR analysis identified CD36 as a risk factor for both IA and SAH, and it has been recognized as an effective blood biomarker for SAH. Neutrophils and their related indicators have emerged as excellent biomarkers of SAH in clinical cohorts.
Conclusion: This study highlighted the detrimental role of SPP1+ Macrophage in IA and SAH using single-cell sequencing and MR analyses. CD36 was identified as a risk factor for IA and SAH and was also an efficient blood biomarker for SAH. In a clinical cohort, neutrophils and related indicators were valuable for the early diagnosis of SAH.
Keywords: Mendelian randomization; SPP1+ Macrophage; intracranial aneurysm; neutrophils; single-cell sequencing.
© 2024 Jie et al.
Conflict of interest statement
The authors declare that this research is conducted in the absence of any commercial or financial relationships that could be construed as potential conflicts of interest.
Figures


Similar articles
-
Genetically determined blood pressure, antihypertensive medications, and risk of intracranial aneurysms and aneurysmal subarachnoid hemorrhage: A Mendelian randomization study.Eur Stroke J. 2024 Mar;9(1):244-250. doi: 10.1177/23969873231204420. Epub 2023 Oct 6. Eur Stroke J. 2024. PMID: 37800876 Free PMC article.
-
Machine learning and deep learning to identifying subarachnoid haemorrhage macrophage-associated biomarkers by bulk and single-cell sequencing.J Cell Mol Med. 2024 May;28(9):e18296. doi: 10.1111/jcmm.18296. J Cell Mol Med. 2024. PMID: 38702954 Free PMC article.
-
Causal association between circulating inflammatory cytokines and intracranial aneurysm and subarachnoid hemorrhage.Eur J Neurol. 2024 Aug;31(8):e16326. doi: 10.1111/ene.16326. Epub 2024 May 6. Eur J Neurol. 2024. PMID: 38709145 Free PMC article.
-
Flow-induced, inflammation-mediated arterial wall remodeling in the formation and progression of intracranial aneurysms.Neurosurg Focus. 2019 Jul 1;47(1):E21. doi: 10.3171/2019.5.FOCUS19234. Neurosurg Focus. 2019. PMID: 31261126 Free PMC article. Review.
-
Intracranial Aneurysms: Pathology, Genetics, and Molecular Mechanisms.Neuromolecular Med. 2019 Dec;21(4):325-343. doi: 10.1007/s12017-019-08537-7. Epub 2019 May 4. Neuromolecular Med. 2019. PMID: 31055715 Free PMC article. Review.
Cited by
-
Single-Cell RNA Sequencing Revealed Functional Conjunctival Keratinocytes Loss via TGF-β-Wnt/β-Catenin Signaling in Sjögren's Syndrome Related Dry Eye.Invest Ophthalmol Vis Sci. 2025 Apr 1;66(4):43. doi: 10.1167/iovs.66.4.43. Invest Ophthalmol Vis Sci. 2025. PMID: 40238113 Free PMC article.
-
Semaglultide targets Spp1+ microglia/macrophage to attenuate neuroinflammation following perioperative stroke.J Neuroinflammation. 2025 May 27;22(1):143. doi: 10.1186/s12974-025-03465-9. J Neuroinflammation. 2025. PMID: 40426210 Free PMC article.
-
Spatiotemporal dynamic changes of meningeal microenvironment influence meningeal lymphatic function following subarachnoid hemorrhage: from inflammatory response to tissue remodeling.J Neuroinflammation. 2025 May 16;22(1):131. doi: 10.1186/s12974-025-03460-0. J Neuroinflammation. 2025. PMID: 40380229 Free PMC article.
References
-
- Etminan N, Rinkel GJ. Unruptured intracranial aneurysms: development, rupture and preventive management. Nat Rev Neurol. 2016;12(12):699–713. - PubMed
-
- Brown RD Jr, Broderick JP. Unruptured intracranial aneurysms: epidemiology, natural history, management options, and familial screening. Lancet Neurol. 2014;13(4):393–404. - PubMed
LinkOut - more resources
Full Text Sources
Research Materials
Miscellaneous

