

Prognostic Significance and Associations of Neural Network-Derived Electrocardiographic Features
- PMID: 39540287
- PMCID: PMC7616866
- DOI: 10.1161/CIRCOUTCOMES.123.010602
Prognostic Significance and Associations of Neural Network-Derived Electrocardiographic Features
Abstract
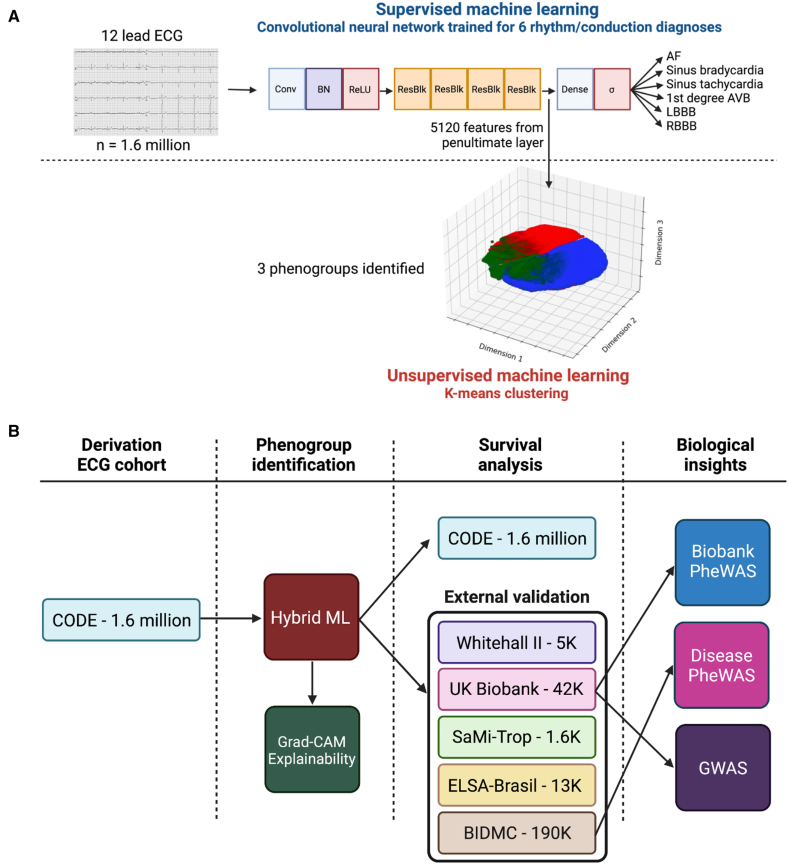
Background: Subtle, prognostically important ECG features may not be apparent to physicians. In the course of supervised machine learning, thousands of ECG features are identified. These are not limited to conventional ECG parameters and morphology. We aimed to investigate whether neural network-derived ECG features could be used to predict future cardiovascular disease and mortality and have phenotypic and genotypic associations.
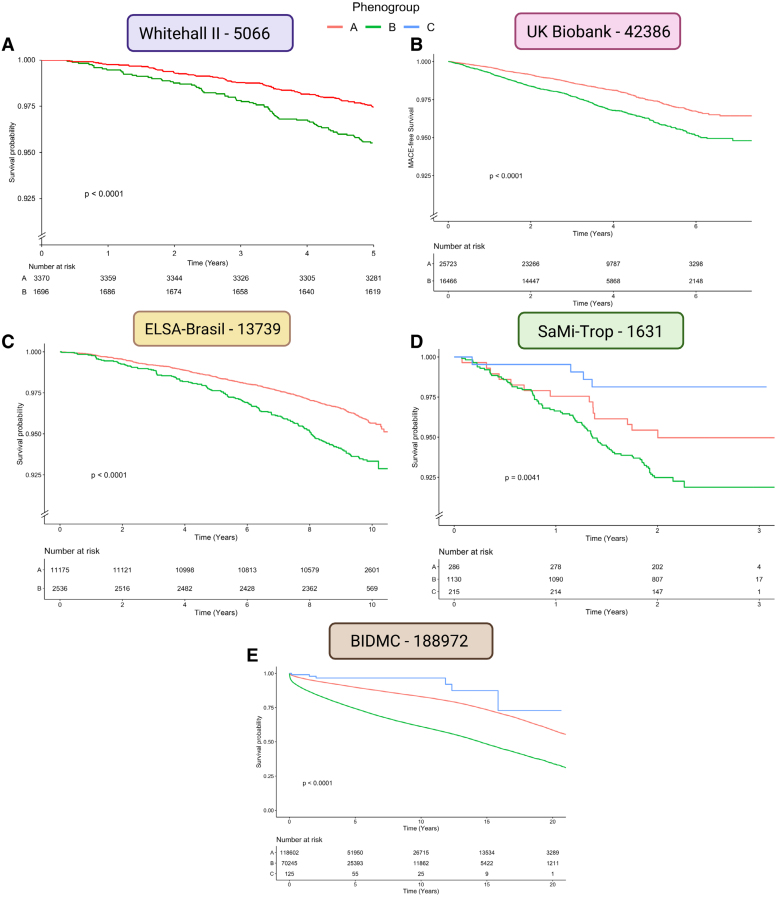
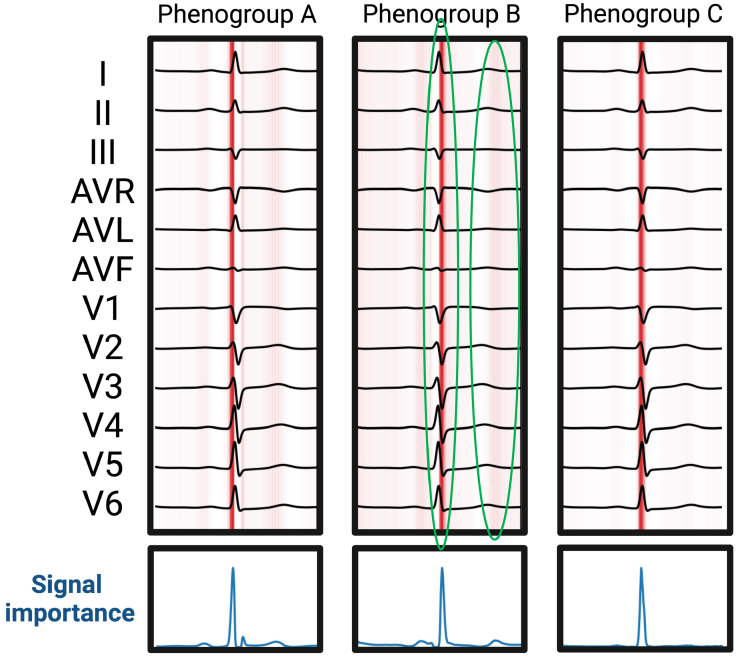
Methods: We extracted 5120 neural network-derived ECG features from an artificial intelligence-enabled ECG model trained for 6 simple diagnoses and applied unsupervised machine learning to identify 3 phenogroups. Using the identified phenogroups, we externally validated our findings in 5 diverse cohorts from the United States, Brazil, and the United Kingdom. Data were collected between 2000 and 2023.
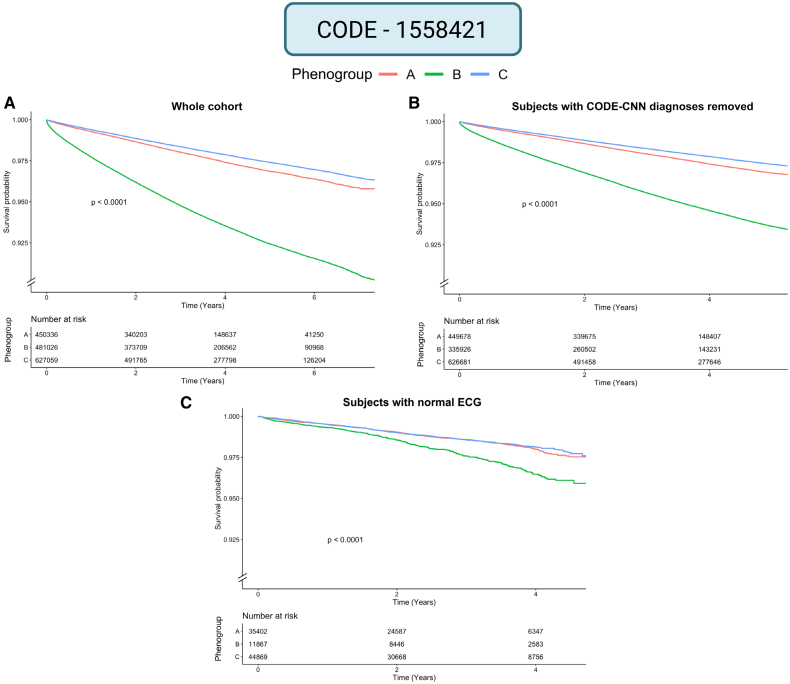
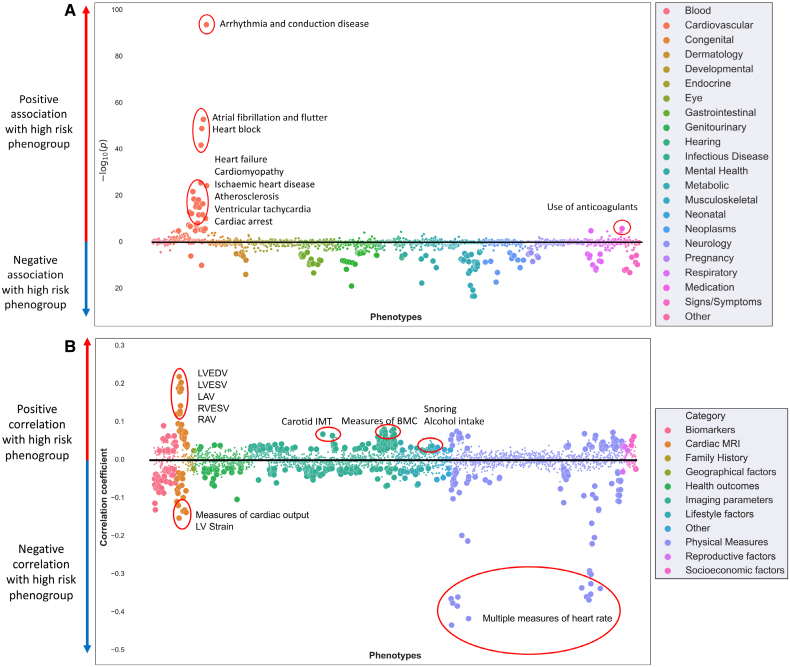
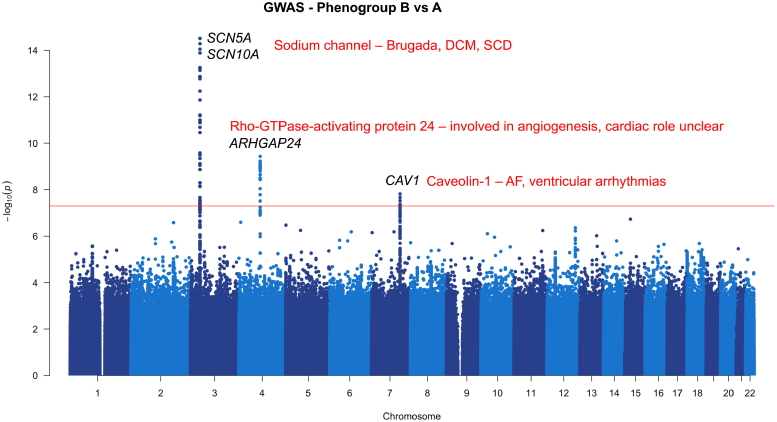
Results: In total, 1 808 584 patients were included in this study. In the derivation cohort, the 3 phenogroups had significantly different mortality profiles. After adjusting for known covariates, phenogroup B had a 20% increase in long-term mortality compared with phenogroup A (hazard ratio, 1.20 [95% CI, 1.17-1.23]; P<0.0001; phenogroup A mortality, 2.2%; phenogroup B mortality, 6.1%). In univariate analyses, we found phenogroup B had a significantly greater risk of mortality in all cohorts (log-rank P<0.01 in all 5 cohorts). Phenome-wide association study showed phenogroup B had a higher rate of future atrial fibrillation (odds ratio, 2.89; P<0.00001), ventricular tachycardia (odds ratio, 2.00; P<0.00001), ischemic heart disease (odds ratio, 1.44; P<0.00001), and cardiomyopathy (odds ratio, 2.04; P<0.00001). A single-trait genome-wide association study yielded 4 loci. SCN10A, SCN5A, and CAV1 have roles in cardiac conduction and arrhythmia. ARHGAP24 does not have a clear cardiac role and may be a novel target.
Conclusions: Neural network-derived ECG features can be used to predict all-cause mortality and future cardiovascular diseases. We have identified biologically plausible and novel phenotypic and genotypic associations that describe mechanisms for the increased risk identified.
Keywords: cardiovascular diseases; electrocardiography; neural networks, computer; supervised machine learning; unsupervised machine learning.
Conflict of interest statement
None.
Figures
Comment in
-
Artificial Intelligence Applications for Electrocardiography to Define New Digital Biomarkers of Cardiovascular Risk.Circ Cardiovasc Qual Outcomes. 2024 Dec;17(12):e011483. doi: 10.1161/CIRCOUTCOMES.124.011483. Epub 2024 Nov 14. Circ Cardiovasc Qual Outcomes. 2024. PMID: 39540286 No abstract available.
References
-
- Imanishi R, Seto S, Ichimaru S, Nakashima E, Yano K, Akahoshi M. Prognostic significance of incident complete left bundle branch block observed over a 40-year period. Am J Cardiol. 2006;98:644–648. doi: 10.1016/j.amjcard.2006.03.044 - PubMed
-
- Desai AD, Yaw TS, Yamazaki T, Kaykha A, Chun S, Froelicher VF. Prognostic significance of quantitative QRS duration. Am J Med. 2006;119:600–606. doi: 10.1016/j.amjmed.2005.08.028 - PubMed
-
- Verdecchia P, Angeli F, Reboldi G, Carluccio E, Benemio G, Gattobigio R, Borgioni C, Bentivoglio M, Porcellati C, Ambrosio G. Improved cardiovascular risk stratification by a simple ECG index in hypertension. Am J Hypertens. 2003;16:646–652. doi: 10.1016/s0895-7061(03)00912-9 - PubMed
-
- Raghunath S, Ulloa Cerna AE, Jing L, vanMaanen DP, Stough J, Hartzel DN, Leader JB, Kirchner HL, Stumpe MC, Hafez A, et al. . Prediction of mortality from 12-lead electrocardiogram voltage data using a deep neural network. Nat Med. 2020;26:886–891. doi: 10.1038/s41591-020-0870-z - PubMed
-
- Attia ZI, Kapa S, Lopez-Jimenez F, McKie PM, Ladewig DJ, Satam G, Pellikka PA, Enriquez-Sarano M, Noseworthy PA, Munger TM, et al. . Screening for cardiac contractile dysfunction using an artificial intelligence-enabled electrocardiogram. Nat Med. 2019;25:70–74. doi: 10.1038/s41591-018-0240-2 - PubMed
Publication types
MeSH terms
Grants and funding
- FS/CRTF/21/24183/BHF_/British Heart Foundation/United Kingdom
- MC_UP_1605/13/MRC_/Medical Research Council/United Kingdom
- CH/F/24/90015/BHF_/British Heart Foundation/United Kingdom
- FS/IPBSRF/22/27059/BHF_/British Heart Foundation/United Kingdom
- RG/F/22/110078/BHF_/British Heart Foundation/United Kingdom
LinkOut - more resources
Full Text Sources
Miscellaneous
