. 2024 Nov;14(11):240101.
doi: 10.1098/rsob.240101. Epub 2024 Nov 13.

Pck2 association with the plasma membrane and efficient response of the cell integrity pathway require regulation of PI4P homeostasis by exomer

Affiliations

Pck2 association with the plasma membrane and efficient response of the cell integrity pathway require regulation of PI4P homeostasis by exomer

Esteban Moscoso-Romero et al. Open Biol. 2024 Nov.

Abstract

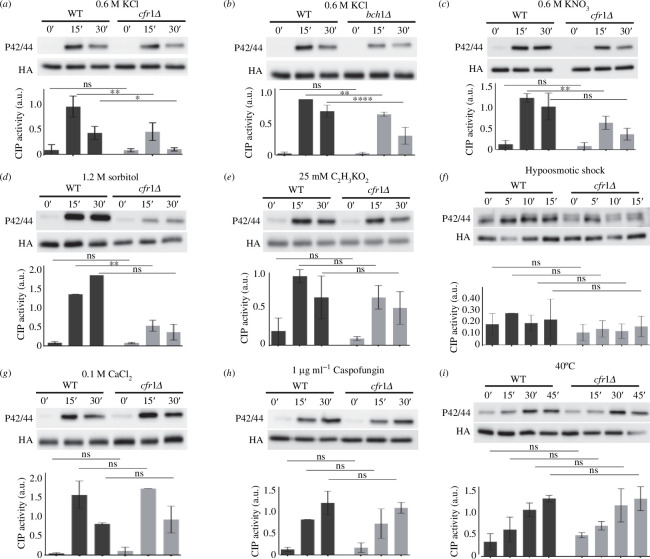
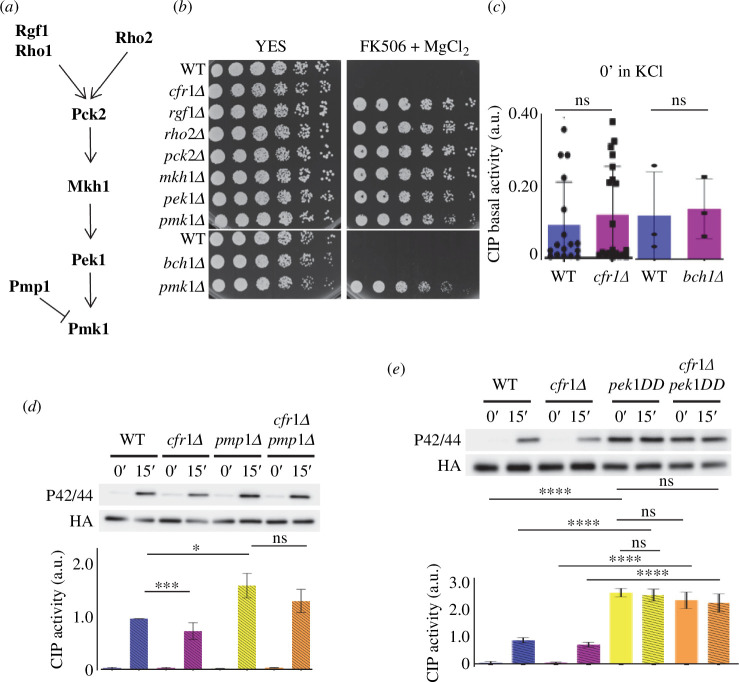
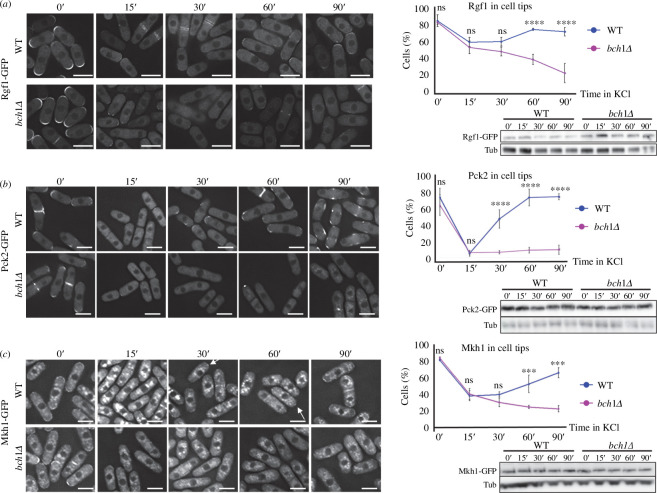
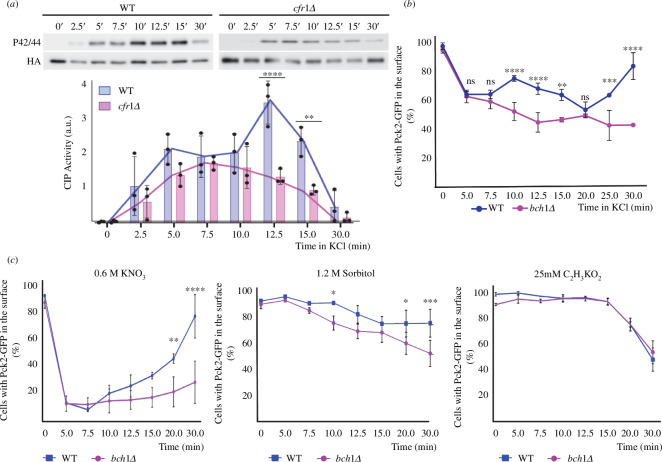
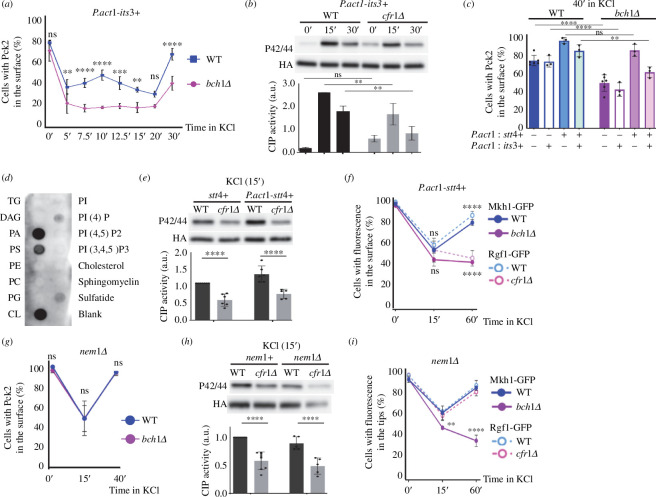
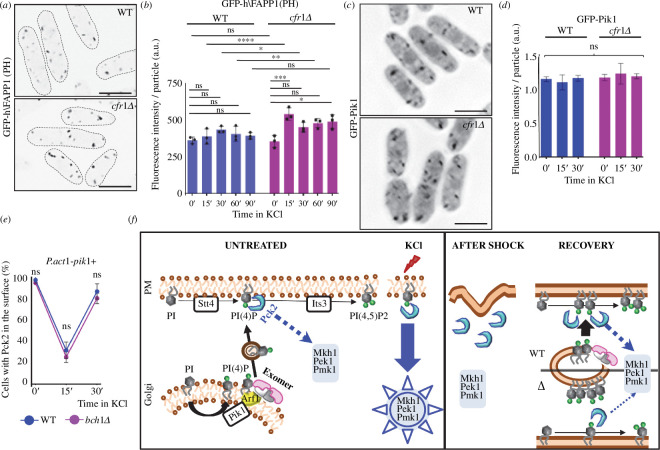
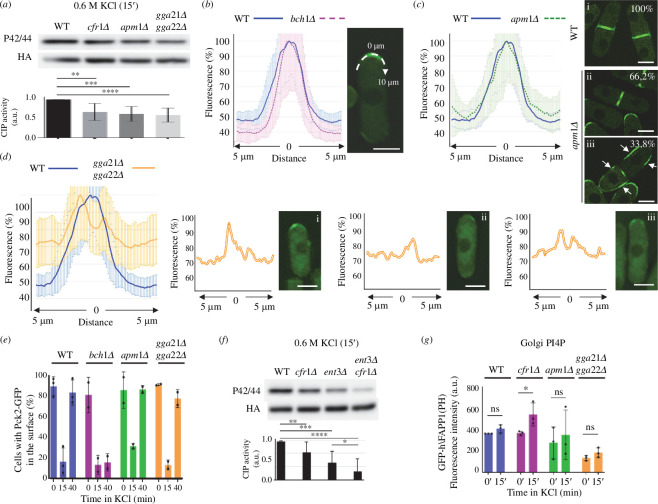
Exomer is a protein complex that facilitates trafficking between the Golgi and the plasma membrane (PM). Schizosaccharomyces pombe exomer is composed of Cfr1 and Bch1, and we have found that full activation of the cell integrity pathway (CIP) in response to osmotic stress requires exomer. In the wild-type, the CIP activators Rgf1 (Rho1 GEF) and Pck2 (PKC homologue) and the MEK kinase Mkh1 localize in the PM, internalize after osmotic shock and re-localize after adaptation. This re-localization is inefficient in exomer mutants. Overexpression of the PM-associated 1-phosphatidylinositol 4-kinase stt4+, and deletion of the nem1+ phosphatase suppress the defects in Pck2 dynamics in exomer mutants, but not their defect in CIP activation, demonstrating that exomer regulates CIP in additional ways. Exomer mutants accumulate PI4P in the TGN, and increasing the expression of the Golgi-associated 1-phosphatidylinositol 4-kinase pik1+ suppresses their defect in Pck2 dynamics. These findings suggest that efficient PI4P transport from the Golgi to the PM requires exomer. Mutants lacking clathrin adaptors are defective in CIP activation, but not in Pck2 dynamics or in PI4P accumulation in the Golgi. Hence, traffic from the Golgi regulates CIP activation, and exomer participates in this regulation through an exclusive mechanism.

Keywords: cell integrity pathway; fission yeast; phosphatidylinositol 4-phosphate; phospholipids; stress response; trans-Golgi network.


Conflict of interest statement

We declare we have no competing interests.

Figures

Activation of the cell integrity pathway (CIP) in response to osmotic shock is defective in exomer mutants
Figure 1.
Activation of the cell integrity pathway (CIP) in response to osmotic shock is defective in exomer mutants. (a) Cells from the wild-type control (WT) and the exomer mutant cfr1Δ were exposed to 0.6 M of KCl for the indicated times (minutes). CIP activation was analysed in purified Pmk1-HA:6His samples by western blot using anti-p42/44 (phosphorylated Pmk1) and anti-HA (total Pmk1) antibodies. (b) The same as in (a), but the exomer mutant was bch1Δ. (c) CIP activation in cells treated with 0.6 M of KNO3. (d) The indicated strains were collected by filtration, transferred from YES to YES with 1.2 M of sorbitol, incubated for the indicated times, and analysed for CIP activation. (e) CIP activation in cells treated with 25 mM of C2H3KO2. (f) Cells growing in YES with 0.8 M sorbitol were transferred to YES, incubated for the indicated times, and analysed for CIP activation. (g) CIP activation in cells treated with 0.1 M of CaCl2. (h) CIP activation in cells treated with 1 µg/ml of caspofungin. (i) CIP activation in cells incubated at 40°C for the indicated times. All the analyses were performed a minimum of three times. A representative blot is shown. The bar graphs depicted below the blots represent the CIP activity, calculated as the ratio between the p42/44 (phosphorylated Pmk1) and HA (total Pmk1) signals. They show the mean and standard deviation. a.u., arbitrary units. The Šidák correction was used after ANOVA to determine the statistical significance of the differences. ns, non-significant; *p < 0.05; **p < 0.01; ****p < 0.0001.
Exomer is not a component of the cell integrity pathway (CIP)
Figure 2.
Exomer is not a component of the cell integrity pathway (CIP). (a) Schematic representation of the order of action of the CIP components analysed in this work. (b) Analysis of the viable in immunosuppressant and chloride (VIC) phenotype in the indicated strains. 3 × 104 cells and serial 1:4 dilutions were plated on YES and YES with 1 μg ml−1 of FK506 and 0.2 M MgCl2 plates. The plates were incubated at 32°C for 2 days. (c) CIP activity in the wild-type control (WT) and the cfr1Δ or the bch1Δ mutants growing in YES medium. The activation was analysed in purified Pmk1-HA:6His samples by western blot using anti-p42/44 (phosphorylated Pmk1) and anti-HA (total Pmk1) antibodies. (d) The same as in (c), but using the WT and pmp1Δ, cfr1Δ and cfr1Δ pmp1Δ strains treated with 0.6 M of KCl for the indicated times. (e) The same as in (d), but using the WT, cfr1Δ, pek1-S234D,T238D (pek1DD) and cfr1Δ pek1DD strains. In (ce), the bar graphs depicted below the blots represent the CIP activity, calculated as the ratio between the p42/44 (phosphorylated Pmk1) and HA (total Pmk1) signals. They show the mean and standard deviation. a.u., arbitrary units. The t‐test and Tukey correction after ANOVA were used to determine the statistical significance of the differences in (c) and in (d,e), respectively. ns, non-significant; *p < 0.05; ***p < 0.001; ****p < 0.0001.

The distribution of the cell integrity pathway (CIP) regulators is altered in exomer mutants exposed to KCl
Figure 3.
The distribution of the cell integrity pathway ( CIP ) regulators is altered in exomer mutants exposed to KCl. (a) Left panel : wild-type (WT) and bch1Δ cells, expressing Rgf1-GFP and treated with 0.6 M of KCl, were photographed after the indicated times (minutes) with a DeltaVision system. The images are AVG projections. Upper right panel : the percentage of cells exhibiting Rgf1-GFP at the cell surface at the indicated time points. Cells with fluorescent signal in the cell poles and cell sides, but not in the cell equator and septa were scored ( Materials and methods). Lower right panel : the cell extracts from the same strains treated with 0.6 M of KCl were analysed by western blot using anti-GFP and anti-tubulin (Tub; loading control) antibodies. ( b ) The same as in (a ), but the cells expressed Pck2-GFP. (c) The same as in ( a ), but the cells expressed Mkh1-GFP. The arrows denote examples of cells with Mkh1-GFP at the poles. The Šidák correction was used after ANOVA to determine the statistical significance of the difference between the value for the WT and bch1Δ strains treated for the same time is indicated. ns, non-significant; *** p  <  0.001; **** p  <  0.0001. Scale bar, 10 µm.

Inefficient cell integrity pathway (CIP) activation correlates with defects in the localization of Pck2.
Figure 4.
Inefficient cell integrity pathway ( CIP ) activation correlates with defects in the localization of Pck2. ( a ) Cells from the wild-type control (WT) and the exomer mutant cfr1Δ were exposed to 0.6 M of KCl for the indicated times (minutes). CIP activation was analysed in purified Pmk1-HA:6His samples by western blot using anti-p42/44 (phosphorylated Pmk1) and anti-HA (total Pmk1) antibodies. The bar graphs depicted below the blots represent the CIP activity, calculated as the ratio between the p42/44 (phosphorylated Pmk1) and HA (total Pmk1) signals. They show the mean and standard deviation. a.u., arbitrary units. Line graphs for the same values have been depicted to facilitate the comparison of the CIP activation dynamics in both strains. ( b ) Percentage of cells incubated in YES with 0.6 M of KCl for the indicated times that exhibited Pck2-GFP at the cell poles and cell sides, but not in the cell equator and septa ( Materials and methods). ( c ) The same as in ( b ), but the cells were exposed to 0.6 M of KNO3 (left panel), 1.2 M of sorbitol (central panel) or 25 mM of C2H3KO2 (right panel). The Šidák correction was used after ANOVA to determine the statistical significance of the difference between the value for the WT and the mutant strains treated for the same time. ns, non-significant; * p  <  0.05¸** p  <  0.01; *** p  <  0.001; **** p  <  0.0001.

Relationship between plasma membrane lipids, Pck2 localization and cell integrity pathway (CIP) activation.
Figure 5.
Relationship between plasma membrane lipids, Pck2 localization and cell integrity pathway ( CIP ) activation. ( a ) Cells from the control (WT) and bch1Δ strains that bear Pck2-GFP and overexpress its3+ were treated with 0.6 M of KCl for the indicated times (minutes), and photographed. The percentage of cells exhibiting fluorescence in the cell poles and cell sides, but not in the cell equator and septa ( Materials and methods) was scored from the images. ( b ) CIP activation in the control (WT) and cfr1Δ cells that overexpress its3+ exposed to 0.6 M of KCl for the indicated times (minutes). ( c ) Percentage of WT and bch1Δ cells bearing Pck2-GFP that exhibit GFP fluorescence in the cell surface, estimated as in ( a ), after 40 min in the presence of 0.6 M of KCl. The cells expressed the indicated genes from the act1+ promoter. ( d ) Protein–lipid overlay assay to assess Pck2 binding to membrane lipids. TG, triglyceride; DAG, diacylglycerol; PA, phosphatidic acid; PS, phosphatidylserine; PE, phosphatidylethanolamine; PC, phosphatidylcholine; PG, phosphatidylglycerol; PI, phosphatidylinositol; PI4P, phosphatidylinositol 4-phosphate; PI(4,5)P2, phosphatidylinositol 4,5-bisphosphate; PI(3,4,5), phosphatidylinositol 3,4,5-trisphosphate; sulfatide, 3-sulfogalactosylceramide. ( e ) The same as in ( b ), but the cells expressed Stt4 form its native promoter (stt4+) or from the act1+ promoter (P.act1-stt4+). ( f ) The same as in ( a ), but the WT and mutant cells (blue and magenta lines, respectively) expressed stt4+ from the act1+ promoter, and carried Mkh1-GFP (solid lines) or Rgf1-GFP (dashed lines). ( g ) The same as in ( a ), but the WT and cfr1Δ cells contained a nem1Δ deletion. ( h ) CIP activation in nem1+ and nem1Δ cells was analysed as in (b). ( i ) Percentage of WT and exomer mutant cells (blue and magenta lines, respectively) deleted for nem1+ that expressed Mkh1-GFP (solid lines) or Rgf1-GFP (dashed lines) and exhibited fluorescence in the cell surface, estimated as in ( a ). In ( b ), ( e ) and ( h ), CIP activation was analysed in purified Pmk1-HA:6His samples by western blot using anti-p42/44 (phosphorylated Pmk1) and anti-HA (total Pmk1) antibodies. The bar graphs represent the ratio between the intensity of the p42/44 band and the corresponding HA band. a.u., arbitrary units. The statistical significance of the differences between the values for the WT and mutant strains treated for the same time is indicated where appropriate. The Šidák correction was used after ANOVA in ( a –c ), ( e ) and ( g, h ). The Tukey correction was used in ( f ) and ( i ). In ( e ) and ( h ), the asterisks denote the significance of the difference between the values for each strain at 0 and 15 min of exposure to KCl. ns, non-significant; * p  <  0.05¸** p  <  0.01; *** p  <  0.001; **** p  <  0.0001.

Phosphatidylinositol 4-phosphate (PI4P) homeostasis in the Golgi is altered in exomer mutants undergoing osmotic stress.
Figure 6.
Phosphatidylinositol 4-phosphate (PI4P) homeostasis in the Golgi is altered in exomer mutants undergoing osmotic stress. ( a ) Micrographs of cells from the wild-type control (WT) and cfr1Δ strains bearing the GFP-h\FAPP1(PH) probe, which binds PI4P in the Golgi. The cells were treated with 0.6 M of KCl for 15 min . The images were captured with a Dragonfly spinning disk microscope and are average (AVG) projections. ( b ) The GFP fluorescence was quantified from photographs of the strains used in ( a ) treated with 0.6 M of KCl for the indicated times (minutes). ( c ) Micrographs of WT and cfr1Δ cells bearing GFP-Pik1. The images are AVG projections captured with a DeltaVision. ( d ) The GFP fluorescence was quantified from photographs of the strains used in ( c ) , treated with 0.6 M of KCl for the indicated times (minutes). ( e ) Control (WT) and bch1Δ cells that bear Pck2-GFP and express pik1+ from the P.act1+ promoter were treated with 0.6 M of KCl for the indicated times (minutes), and photographed. The percentage of cells exhibiting fluorescence in the cell poles and cell sides, but not in the cell equator and septa ( Materials and methods) were scored from the images. ( f ) Speculative model to explain the role of exomer in PI4P homeostasis and CIP regulation. Left panel, under basal conditions (UNTREATED), the 1-phosphatidylinositol 4-kinase Stt4 phosphorylates phosphatidylinositol (PI) and generates PI4P in the plasma membrane (PM). This PI4P is the substrate for the 1-phosphatidylinositol 4-phosphate 5-kinase Its3 that produces phosphatidylinositol 4,5-bisphosphate [PI(4,5)P2]. Pck2 binds to the PI4P and activates the CIP MAP kinase in response to stress (KCl). In the Golgi, 1-phosphatidylinositol 4-kinase Pik1 phosphorylates PI to generate PI4P. Exomer, which interacts with Arf1 and the Golgi membrane, would modulate the transfer of PI4P to the PM. Right panel, osmotic shock would alter the properties of the PM, and Pck2 would dissociate from the surface of cell poles (AFTER SHOCK). After the initial shock, the WT cells (WT) would adapt to the presence of KCl (RECOVERY); Its3 would synthesize PI(4,5)P2 from the PI4P generated in the PM by Stt4. Under these conditions, there would be enhanced transport of PI4P from the Golgi to the PM that would mediate Pck2 re-association with the PM. In the absence of exomer (Δ), this transport would be inefficient, which would result in PI4P accumulation in the Golgi, shortage of this lipid in the PM, and reduced Pck2 association with the PM and CIP signalling. In ( a ) and ( c ), scale bar, 10 µm. In ( b ) and ( d ), a.u., arbitrary units. In ( b ), ( d ) and ( e ), the Šidák correction was used after ANOVA to determine the statistical significance of the differences. ns, non-significant; * p  <  0.05; ** p  <  0.01; *** p  <  0.001; **** p  <  0.0001.

Role of Golgi clathrin adaptors in cell integrity pathway (CIP) activation, the regulation of Pck2, and phosphatidylinositol 4-phosphate (PI4P) homeostasis
Figure 7.
Role of Golgi clathrin adaptors in cell integrity pathway ( CIP ) activation, the regulation of Pck2 and phosphatidylinositol 4-phosphate (PI4P) homeostasis. ( a ) CIP activation in response to KCl was analysed in the wild-type (WT) strain and in strains lacking exomer (cfr1Δ), AP -1 (apm1Δ) and the GGA adaptors (gga21Δ gga22Δ). Western blotting was performed in purified Pmk1-HA:6His samples using anti-p42/44 (phosphorylated Pmk1) and anti-HA (total Pmk1) antibodies. ( b ) Line-scan analyses of the Pck2-GFP fluorescence intensity along the plasma membrane of cell poles in the WT and bch1Δ strains growing in YES. The graph in the left panel represents the mean and standard deviations of the plot profiles for the relative intensities of all the values obtained at different cell points from the cell tip toward the cell equator, as represented in the micrograph (right panel). ( c ) Left panel, the same as in ( b ), but the strains analysed were WT and apm1Δ. Right panel, micrographs from WT (i ) and apm1Δ (ii, iii) cells undergoing septation. The numbers indicate the percentage of cells exhibiting Pck2-GFP fluorescence in the septal area (i and ii ) or in the septal area and the cell sides (denoted by arrows in iii). ( d ) Left panel, the same as in ( b ), but the strains analysed were WT and gga21Δ gga22Δ. The three right panels are individual plot profiles of the line-scans of cells with different Pck2-GFP distributions, as shown in the corresponding micrographs (i–iii). The images were captured with a Dragonfly spinning disk confocal microscope and are average (AVG) projections. ( e ) Percentage of cells from the indicated strains that exhibited Pck2-GFP fluorescence at the cell poles and cell sides, but not in the cell equator and septa (§4 ). The cells were incubated in 0.6 M of KCl for the indicated times (minutes). The experiment was performed twice with similar results. ( f ) The same as in ( a ), but the strains lacked Cfr1, Ent3 or both proteins. ( g ) Intensity of the GFP fluorescence in the indicated strains that bear the GFP-h\FAPP1(PH) probe as an indicator of the level of PI4P in the Golgi. The cells were incubated with 0.6 M of KCl for the indicated times (minutes). The experiment was performed three times, and the statistical significance of the differences between the values for each strain at 0 and 15 min are indicated. In ( a ) and ( f ), the bar graphs depicted below the blots represent the CIP activity, calculated as the ratio between the p42/44 (phosphorylated Pmk1) and HA (total Pmk1) signals. They show the mean and standard deviation. The Tukey correction was used after ANOVA in ( a ), ( e ) and ( f ). The Šidák correction was used in ( g ). ns, non-significant; * p  <  0.05. ** p  <  0.01; *** p  <  0.001; **** p  <  0.0001. a.u., arbitrary units. In ( b– d ), scale bar, 5 µm.

Similar articles

References

    1. Boehm M, Bonifacino JS. 2001. Adaptins: the final recount. Mol. Biol. Cell 12, 2907–2920. (10.1091/mbc.12.10.2907) - DOI - PMC - PubMed
    1. Bonifacino JS, Lippincott-Schwartz J. 2003. Coat proteins: shaping membrane transport. Nat. Rev. Mol. Cell Biol. 4, 409–414. (10.1038/nrm1099) - DOI - PubMed
    1. Hirst J, Robinson MS. 1998. Clathrin and adaptors. Biochim. Biophys. Acta 1404, 173–193. (10.1016/s0167-4889(98)00056-1) - DOI - PubMed
    1. Lemmon SK, Traub LM. 2000. Sorting in the endosomal system in yeast and animal cells. Curr. Opin. Cell Biol. 12, 457–466. (10.1016/s0955-0674(00)00117-4) - DOI - PubMed
    1. Anitei M, Hoflack B. 2011. Exit from the trans-Golgi network: from molecules to mechanisms. Curr. Opin. Cell Biol. 23, 443–451. (10.1016/j.ceb.2011.03.013) - DOI - PubMed

MeSH terms

Substances

LinkOut - more resources