

Correlation of retinal fluid and photoreceptor and RPE loss in neovascular AMD by automated quantification, a real-world FRB! analysis
- PMID: 39540601
- PMCID: PMC11986395
- DOI: 10.1111/aos.16799
Correlation of retinal fluid and photoreceptor and RPE loss in neovascular AMD by automated quantification, a real-world FRB! analysis
Abstract
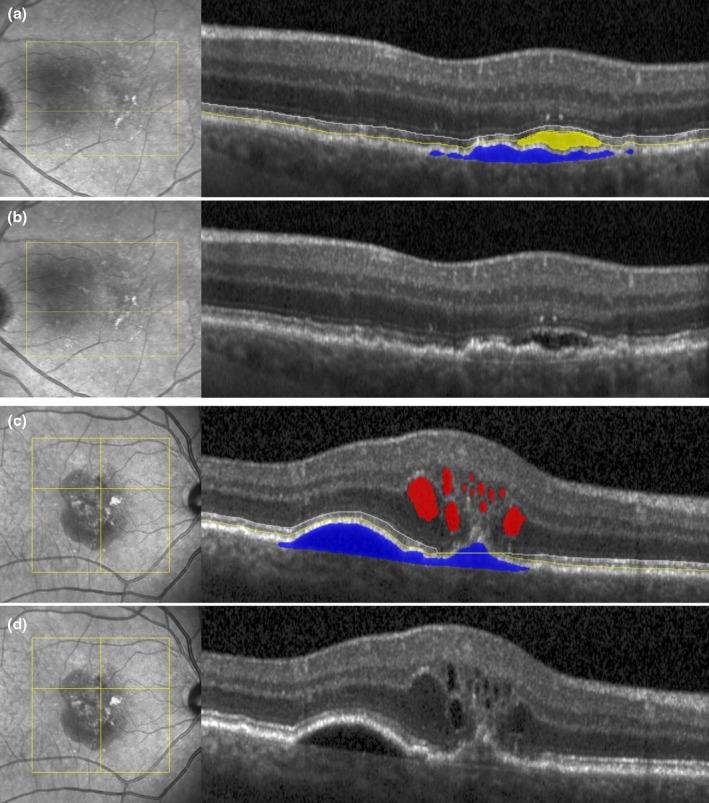
Purpose: To quantify ellipsoid zone (EZ) loss during anti-VEGF therapy for neovascular age-related macular degeneration (nAMD) and correlate these findings with nAMD disease activity using artificial intelligence-based algorithms.
Methods: Spectral domain optical coherence tomography (Spectralis, Heidelberg Engineering) images from nAMD treatment-naïve patients from the Fight Retinal Blindness! (FRB!) Registry from Zürich, Switzerland were processed at baseline and over 3 years of follow-up. An approved deep learning algorithm (Fluid Monitor, RetInSight) was used to automatically quantify intraretinal fluid (IRF), subretinal fluid (SRF) and pigment epithelial detachment (PED). An ensemble U-net deep learning algorithm was used to automated quantify EZ integrity based on EZ layer thickness. The impact of fluid volumes on EZ thickness and late-stages outcomes were calculated using Wilcoxon rank-sum tests, a linear mixed model and a longitudinal panel regression model.
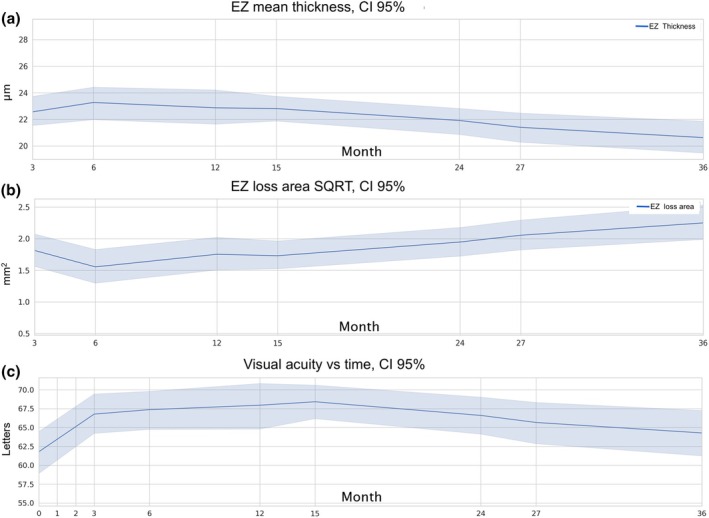
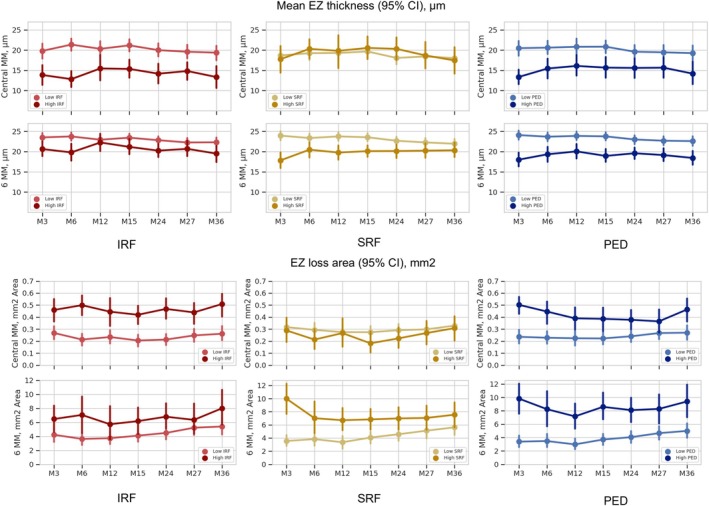
Results: Two hundred and eleven eyes from 158 patients were included. The mean ± SD EZ loss area in the central 6 mm was 1.81 ± 2.68 mm2 at baseline and reached 6.21 ± 6.15 mm2 at month 36. Higher fluid volumes (top 25%) of IRF and PED in the central 1 and 6 mm of the macula were significantly associated with more advanced EZ thinning and loss compared to the low fluid volume subgroup. The high SRF subgroup in the linear regression model showed no statistically significant association with EZ integrity in the central macula; however, the longitudinal analysis revealed an increased EZ thickness with no additional loss.
Conclusions: Intraretinal fluid and PED volumes and their resolution pattern have an impact on alteration of the underlying EZ layer. AI-supported quantifications are helpful in quantifying early signs of macular atrophy and providing individual risk profiles as a basis for tailored therapies for optimized visual outcomes.
Keywords: anti‐VEGF; artificial intelligence; geographic atrophy; image analysis; machine learning; neovascular AMD; optical coherence tomography; photoreceptor; retina.
© 2024 The Author(s). Acta Ophthalmologica published by John Wiley & Sons Ltd on behalf of Acta Ophthalmologica Scandinavica Foundation.
Conflict of interest statement
GSR: Research funds from RetInSight. Consultant for Apellis, Bayer, Boehringer Ingelheim and Roche. HB: Research funds from Heidelberg Engineering and Apellis. DB: Research grants and travel expenses from Bayer and Novartis. (b) Scientific consultant for Alcon. US‐E: Scientific consultant for AbbVie, Annexon, Apellis, Aviceda, Complement Therapeutix, Genentech, Heidelberg Engineering, Kodiak, RetInSight, Novartis, Roche and Topcon. OL: Employee of RetInSight. VM, MG and MBN report nothing to declare.
Figures
Similar articles
-
Compartmental Exudative Dynamics in Neovascular Age-Related Macular Degeneration: Volumetric Outcomes and Impact of Volatility in a Phase III Clinical Trial.Ophthalmol Retina. 2024 Aug;8(8):765-777. doi: 10.1016/j.oret.2024.02.010. Epub 2024 Feb 23. Ophthalmol Retina. 2024. PMID: 38403242 Clinical Trial.
-
Longitudinal Assessment of Ellipsoid Zone Integrity, Subretinal Hyperreflective Material, and Subretinal Pigment Epithelium Disease in Neovascular Age-Related Macular Degeneration.Ophthalmol Retina. 2021 Dec;5(12):1204-1213. doi: 10.1016/j.oret.2021.02.012. Epub 2021 Feb 26. Ophthalmol Retina. 2021. PMID: 33640493 Free PMC article. Clinical Trial.
-
Long-term effect of fluid volumes during the maintenance phase in neovascular age-related macular degeneration: results from Fight Retinal Blindness!Can J Ophthalmol. 2024 Oct;59(5):350-357. doi: 10.1016/j.jcjo.2023.10.017. Epub 2023 Nov 18. Can J Ophthalmol. 2024. PMID: 37989493
-
To Treat or Not to Treat? Resolving the Question of Subretinal and Intraretinal Fluid in Age-Related Macular Degeneration: A Narrative Review.Ophthalmol Ther. 2025 Mar;14(3):489-514. doi: 10.1007/s40123-025-01093-3. Epub 2025 Feb 4. Ophthalmol Ther. 2025. PMID: 39904844 Free PMC article. Review.
-
Impact of residual retinal fluid on treatment outcomes in neovascular age-related macular degeneration.Br J Ophthalmol. 2025 Feb 24;109(3):307-315. doi: 10.1136/bjo-2024-325640. Br J Ophthalmol. 2025. PMID: 39033013 Free PMC article. Review.
Cited by
-
Rethinking Clinical Trials in Age-Related Macular Degeneration: How AI-Based OCT Analysis Can Support Successful Outcomes.Pharmaceuticals (Basel). 2025 Feb 20;18(3):284. doi: 10.3390/ph18030284. Pharmaceuticals (Basel). 2025. PMID: 40143063 Free PMC article. Review.
-
Real-world faricimab switch in France: artificial intelligence-based detection of changes in exudative signs in difficult-to-treat neovascular age-related macular degeneration.BMJ Open Ophthalmol. 2025 Jun 23;10(1):e002267. doi: 10.1136/bmjophth-2025-002267. BMJ Open Ophthalmol. 2025. PMID: 40550705 Free PMC article.
-
Automated fluid monitoring to optimize the follow-up of neovascular age-related macular degeneration patients in the Brazilian population.Int J Retina Vitreous. 2025 Jul 6;11(1):75. doi: 10.1186/s40942-025-00695-0. Int J Retina Vitreous. 2025. PMID: 40619442 Free PMC article.
-
Quantitative Assessment of En‑face OCT‑Derived Minimum Intensity Fluid Changes Following Ranibizumab Biosimilar Therapy in Macular Neovascularization Secondary to nAMD and PCV.Clin Ophthalmol. 2025 Jul 29;19:2505-2512. doi: 10.2147/OPTH.S542496. eCollection 2025. Clin Ophthalmol. 2025. PMID: 40761529 Free PMC article.
References
-
- Coscas, F. , Coscas, G. , Lupidi, M. , Dirani, A. , Srour, M. , Semoun, O. et al. (2015) Restoration of outer retinal layers after aflibercept therapy in exudative AMD: prognostic value. Investigative Ophthalmology and Visual Science, 56, 4129–4134. - PubMed
Publication types
MeSH terms
Substances
LinkOut - more resources
Full Text Sources
Miscellaneous
