

Predictive Prognostic Model for Hepatocellular Carcinoma Based on Seven Genes Participating in Arachidonic Acid Metabolism
- PMID: 39540710
- PMCID: PMC11561968
- DOI: 10.1002/cam4.70284
Predictive Prognostic Model for Hepatocellular Carcinoma Based on Seven Genes Participating in Arachidonic Acid Metabolism
Abstract
Background: The occult onset and rapid progression of hepatocellular carcinoma (HCC) lead to an unsatisfactory overall survival (OS) rate. Established prognostic predictive models based on tumor-node-metastasis staging and predictive factors do not report satisfactory predictive efficacy. Arachidonic acid plays pivotal roles in biological processes including inflammation, regeneration, immune modulation, and tumorigenesis. We, therefore, constructed a prognostic predictive model based on seven genes linked to arachidonic acid metabolism, using samples of HCC patients from databases to analyze the genomic profiles. We also assessed the predictive stability of the constructed model.
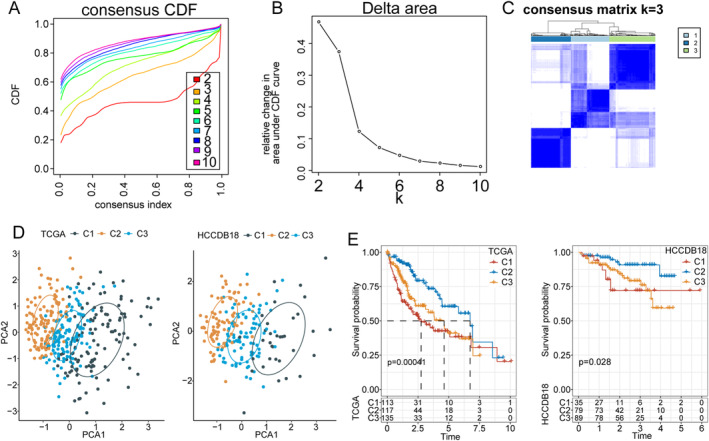
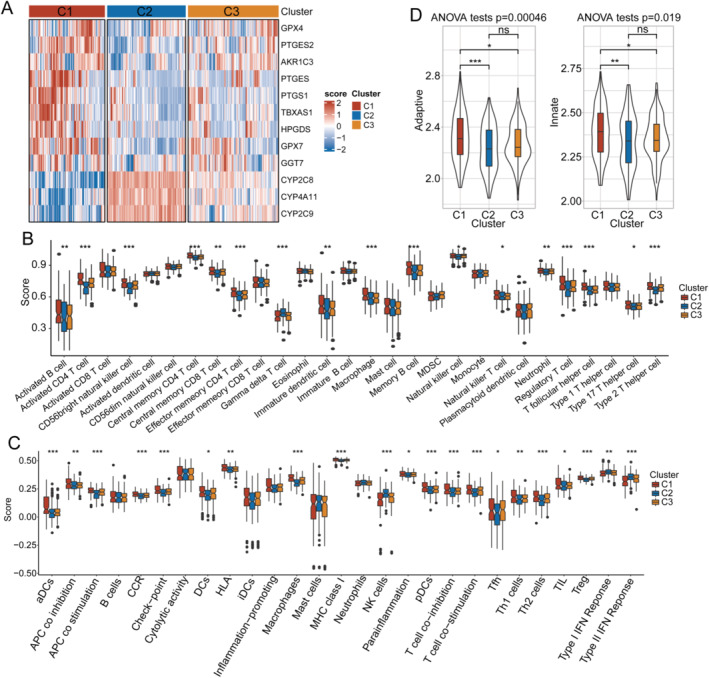
Methods: Sample data of 365 patients diagnosed with HCC were extracted from The Cancer Genome Atlas (TCGA, training set) and HCCDB18, GSE14520, and GSE76427 databases (validation sets). Patient samples were clustered using ConsensusClusterPlus analysis based on the expression levels of 12 genes involved in arachidonic acid metabolism that were significantly associated with HCC prognosis. Differentially expressed genes (DEGs) within different clusters were distinguished and compared using WebGestaltR. Immunohistochemistry (IHC) analysis was performed using a human HCC tissue microarray (TMA). Tumor immune microenvironment assessment was performed using ESTIMATE, ssGSEA, and TIDE.
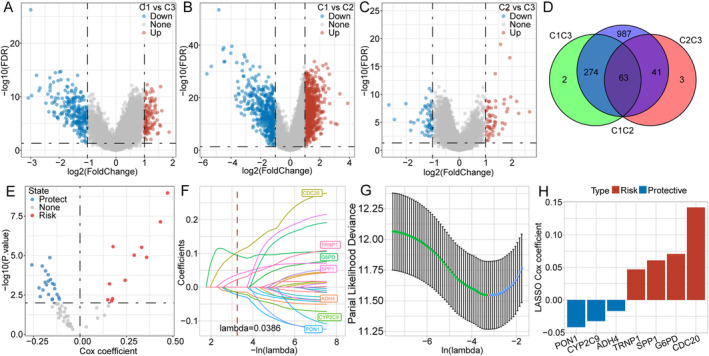
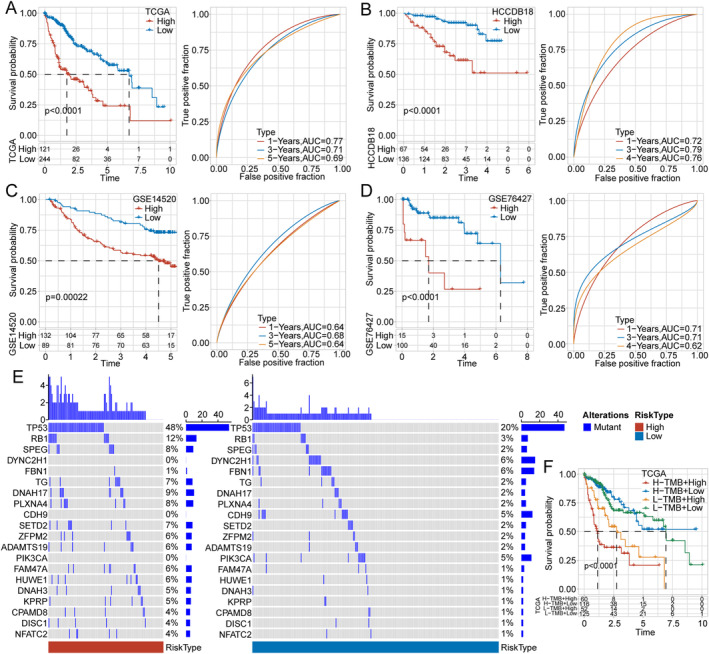
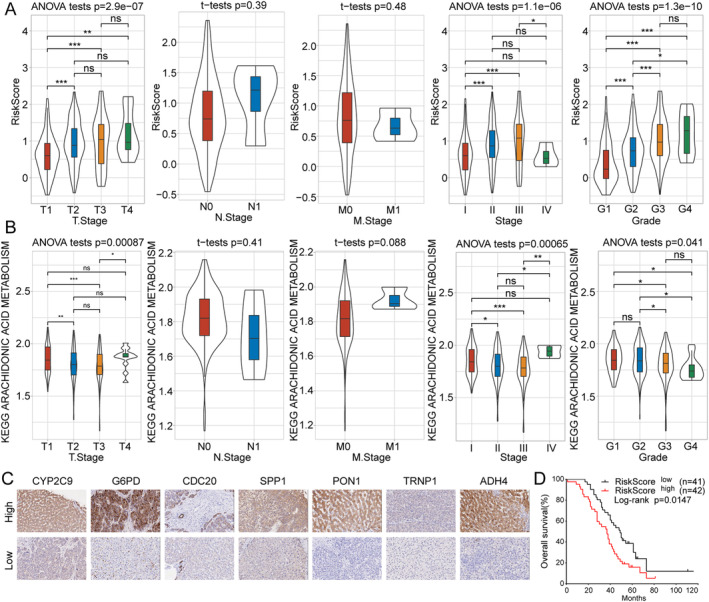
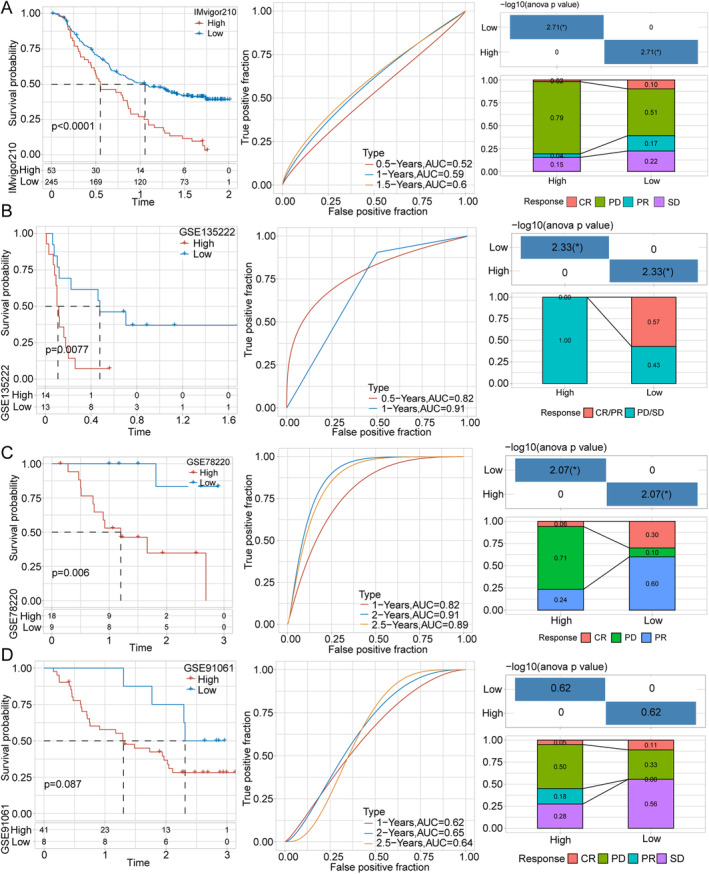
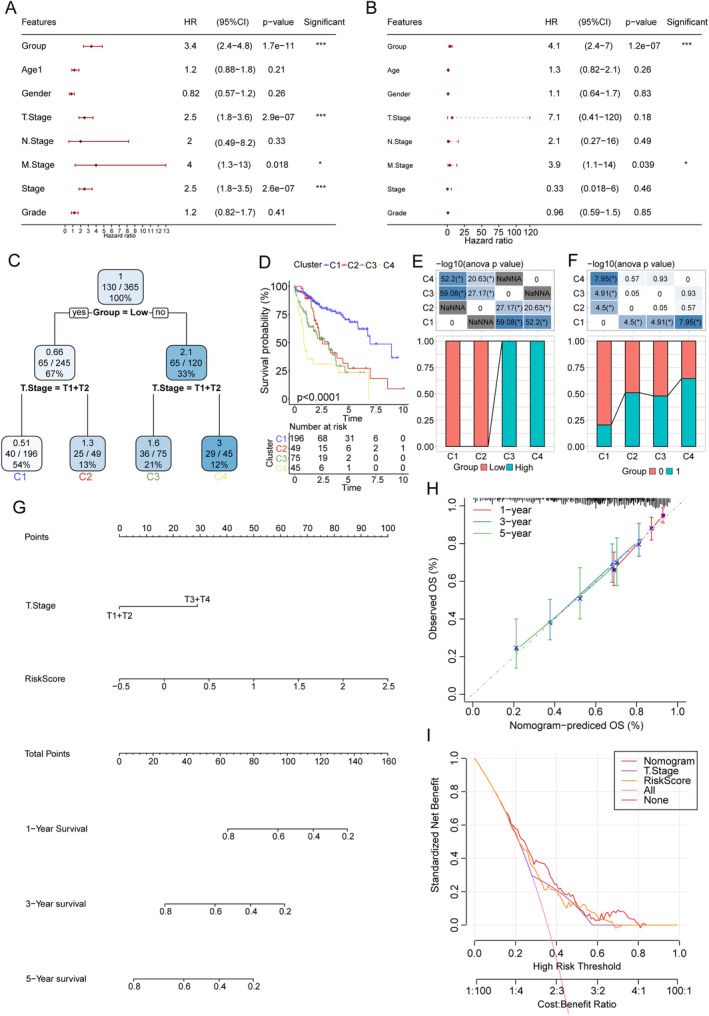
Results: Samples of patients with HCC were classified into three clusters, with significant differences in OS. Cluster 2 showed the best prognosis, whereas cluster 1 presented the worst. The three clusters showed significant differences in immune infiltration. We then performed Cox and LASSO regression analyses, which revealed CYP2C9, G6PD, CDC20, SPP1, PON1, TRNP1, and ADH4 as prognosis-related hub genes, making it a simplified prognostic model. TMA analysis for the seven target genes showed similar results of regression analyses. The high-risk group showed a significantly worse prognosis and reduced immunotherapy efficacy. Our model showed stable prognostic predictive efficacy.
Conclusions: This seven-gene-based model showed stable outcomes in predicting HCC prognosis as well as responses to immunotherapy.
Keywords: arachidonic acid metabolism; hepatocellular carcinoma; immunotherapy responses; prognosis; tumor microenvironment.
© 2024 The Author(s). Cancer Medicine published by John Wiley & Sons Ltd.
Conflict of interest statement
The authors declare no conflicts of interest.
Figures
Similar articles
-
Development and evaluation of a risk score model based on a WNT score gene-associated signature for predicting the clinical outcome and the tumour microenvironment of hepatocellular carcinoma.Int J Immunopathol Pharmacol. 2023 Jan-Dec;37:3946320231218179. doi: 10.1177/03946320231218179. Int J Immunopathol Pharmacol. 2023. PMID: 38054921 Free PMC article.
-
A Cuproptosis-Related LncRNA Risk Model for Predicting Prognosis and Immunotherapeutic Efficacy in Patients with Hepatocellular Carcinoma.Biochem Genet. 2024 Jun;62(3):2332-2351. doi: 10.1007/s10528-023-10539-x. Epub 2023 Oct 29. Biochem Genet. 2024. PMID: 37898914
-
Expression of lipid-metabolism genes is correlated with immune microenvironment and predicts prognosis of hepatocellular carcinoma.Sci Rep. 2024 Oct 28;14(1):25705. doi: 10.1038/s41598-024-76578-5. Sci Rep. 2024. PMID: 39463421 Free PMC article.
-
Identification of Prognostic Genes in the Tumor Microenvironment of Hepatocellular Carcinoma.Front Immunol. 2021 Apr 7;12:653836. doi: 10.3389/fimmu.2021.653836. eCollection 2021. Front Immunol. 2021. PMID: 33897701 Free PMC article.
-
The glycolytic characteristics of hepatocellular carcinoma and its interaction with the microenvironment: a comprehensive omics study.J Transl Med. 2025 Apr 10;23(1):424. doi: 10.1186/s12967-025-06421-6. J Transl Med. 2025. PMID: 40211257 Free PMC article.
Cited by
-
WGCNA and single-cell analysis reveal ferroptosis-related gene signatures for hepatocellular carcinoma prognosis and therapy.Discov Oncol. 2025 Aug 6;16(1):1483. doi: 10.1007/s12672-025-03335-z. Discov Oncol. 2025. PMID: 40767898 Free PMC article.
-
Identification of methionine metabolism related prognostic model and tumor suppressive functions of BHMT in hepatocellular carcinoma.Sci Rep. 2025 Mar 18;15(1):9250. doi: 10.1038/s41598-025-93650-w. Sci Rep. 2025. PMID: 40102459 Free PMC article.
References
-
- Venook A. P., Papandreou C., Furuse J., and de Guevara L. L., “The Incidence and Epidemiology of Hepatocellular Carcinoma: A Global and Regional Perspective,” Oncologist 15, no. Suppl 4 (2010): 5–13. - PubMed
-
- Giordano S. and Columbano A., “Met as a Therapeutic Target in HCC: Facts and Hopes,” Journal of Hepatology 60 (2014): 442–452. - PubMed
-
- Llovet J. M., De Baere T., Kulik L., et al., “Locoregional Therapies in the Era of Molecular and Immune Treatments for Hepatocellular Carcinoma,” Nature Reviews. Gastroenterology & Hepatology 18 (2021): 293–313. - PubMed
-
- Llovet J. M., Burroughs A., and Bruix J., “Hepatocellular carcinoma,” Lancet 362 (2003): 1907–1917. - PubMed
MeSH terms
Substances
Grants and funding
LinkOut - more resources
Full Text Sources
Medical
Research Materials
Miscellaneous
