. 2025 Feb 7;15(2):363-381.
doi: 10.1158/2159-8290.CD-24-0435.

The UBA1-STUB1 Axis Mediates Cancer Immune Escape and Resistance to Checkpoint Blockade

Affiliations

The UBA1-STUB1 Axis Mediates Cancer Immune Escape and Resistance to Checkpoint Blockade

Yi Bao et al. Cancer Discov. .

Abstract

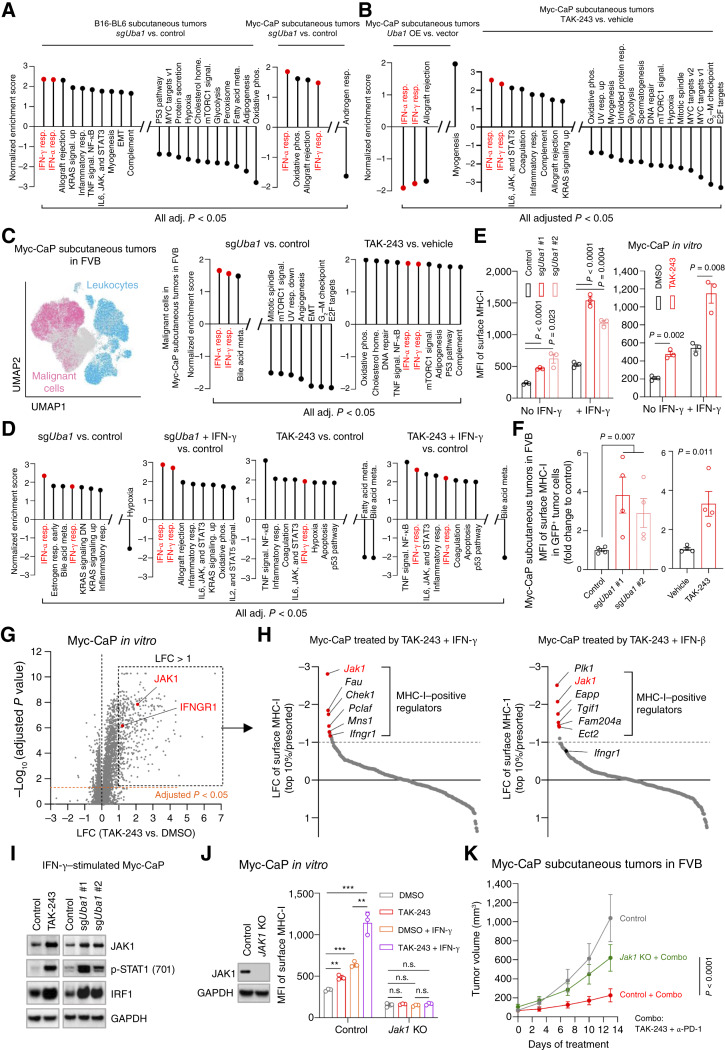
Our study reveals UBA1 as a predictive biomarker for clinical outcomes in ICB cohorts, mediating cancer immune evasion and ICB resistance. We further highlight JAK1 stabilization as a key mechanism of UBA1 inhibition and nominate the UBA1-STUB1 axis as an immuno-oncology therapeutic target to improve the efficacy of ICB.


Conflict of interest statement

W. Zou reports personal fees from CStone, HanchorBio, and NextCure outside the submitted work. A.M. Chinnaiyan reports grants from Prostate Cancer Foundation and NIH during the conduct of the study; personal fees from Medsyn, Ascentage, Esanik Therapeutics, Aurigene Oncology, Rappta Therapeutics, Lynx Dx, Deciphera, and has previously served on the advisory boards of Tempus, EdenRoc, and Flamingo Therapeutics outside the submitted work; and a patent for UBA1 is pending. No disclosures were reported by the other authors.

Figures

Figure 1.
Figure 1.
High expression of UBA1 is associated with low levels of intratumoral CD8+ T cells and predictive of ICB resistance and poor survival in ICB cohorts. A, Left: Spearman correlation between mRNA expression of IFNG and 614 frequently gained genes in the indicated mCRPC cohort (n = 208). Genes that are significantly negatively correlated with IFNG mRNA expression are listed. Right: Spearman correlation between mRNA expression of the cytotoxic T-lymphocyte signature (CD8A, CD8B, GZMA, GZMB, and PRF1) and the genes listed on the left. SU2C, Stand Up to Cancer; PCF, Prostate Cancer Foundation. B, Spearman correlation between mRNA expression of UBA1 and the indicated gene or gene signature in the indicated cohort. Eff., effector. C, Spearman correlation between UBA1 copy number and mRNA expression in the indicated prostate cancer cohort. Frequency of copy number gain (gain) is shown. Patients with prostate cancer (male) with two or more copies of UBA1 (on the X chromosome) are defined as gain. MCTP, The Michigan Center for Translational Pathology. D, Proportion of UBA1 gain (left) and Spearman correlation between UBA1 copy number and mRNA levels (right) in the indicated cancer types. Data were acquired from The Cancer Genome Atlas (TCGA). ACC, adrenocortical carcinoma; BLCA, bladder urothelial carcinoma; BRCA, breast invasive carcinoma; COADREAD, colorectal adenocarcinoma; CSCC, cervical squamous cell carcinoma; EAC, esophageal adenocarcinoma; HCC, hepatocellular carcinoma; LUAD, lung adenocarcinoma; LUSC, lung squamous cell carcinoma; OV, ovarian serous cystadenocarcinoma; SARC, sarcoma; STAD, stomach adenocarcinoma; UCS, uterine carcinosarcoma. E, Spearman correlation between pretreatment mRNA expression of UBA1 and the indicated gene or signature, in a cohort treated with ICB at the U-M, Ann Arbor (MI-ONCOSEQ ICB cohort). F, Representative images (left) or quantification (Spearman correlation; right) of immunofluorescence assessing the number of CD8+ T cells and the level of UBA1 in a melanoma tissue microarray (TMA). Scale bar, 50 μm. G, Fisher exact test of a combined analysis on four public RNA-seq datasets [Van Allen and colleagues (34); Zhao and colleagues (35); Miao and colleagues (36); and Jung and colleagues (37)] examining the relationship between pretreatment mRNA expression of UBA1 and response to ICB. H, Uniform Manifold Approximation and Projection (UMAP) of malignant cells from scRNA-seq data in an ICB-treated melanoma cohort. Cells with high levels of pretreatment UBA1 mRNA expression are highlighted in pink. PT#, patient number. I, Overall survival of patients with tumors showing high or low pretreatment: UBA1 mRNA levels in the indicated cohorts. ccRCC, clear-cell renal cell carcinoma. Statistics were acquired by two-tailed Student’s t test in H, and by log-rank test in I.
Figure 2.
Figure 2.
UBA1 promotes tumor growth by mediating immune escape. A, Immunoblot analysis assessing levels of the indicated proteins in the indicated cells transduced with empty vector or Uba1 overexpression (OE). B and C, Volumes (left) and weights (right) of subcutaneous tumors derived from Myc-CaP (B) or B16-BL6 (C) cells established in A, in FVB or C57BL/6 mice, respectively (n = 5 mice per group in B; n = 4 mice per group in C). D and E, Volumes (left) and weights (right) of subcutaneous tumors established with injection of the indicated Myc-CaP (D) or B16-BL6 (E) cells to SCID mice (n = 7 mice per group in D; n = 5 mice per group in E). F, Immunoblot analysis assessing levels of the indicated proteins in the indicated cells transfected with nontargeting sgRNA (control) or independent sgRNAs depleting Uba1 (sgUba1 #1 and sgUba1 #2). Quantification of intensity of UBA1 relative to the control is shown. G, Volumes of subcutaneous tumors derived from Myc-CaP (left) or B16-BL6 (right) cells established in F, in the indicated mice (n = 5–7 mice per group). H, Left: immunoblot analysis assessing Uba1 overexpression (OE) in Uba1-depleted Myc-CaP. Right: volumes of subcutaneous tumors derived from Myc-CaP cells established in Left, in FVB mice (n = 5 mice, per group). I, Volumes of subcutaneous tumors established with injection of control or Uba1-depleted Myc-CaP (left) or B16-BL6 (right) cells to the indicated mice, with or without simultaneous depletion of both CD8+ and CD4+ T cells (n = 4–5, per group). Data are representative of two distinct sgRNAs. All data are presented as mean ± SEM. Statistics were acquired by two-way ANOVA in B (left), C (left), D (left), and E (left), and GI (n.s., not significant), or by the two-tailed Student’s t test in B (right), C (right), D (right), and E (right). Data in B, C, and G are representative of two independent experiments.
Figure 3.
Figure 3.
UBA1 diminishes intratumoral functional CD8+ T cells. A, Left: UMAP of 8,862 cells and the indicated clusters identified among CD45+ cells enriched from the indicated Myc-CaP tumors subjected to scRNA-seq. Right: heatmap showing differentially expressed genes in each of the indicated clusters among T cells. Three representative genes are shown on the right for each cluster. Proportions of T cells derived from the experimental group (Uba1 overexpression) and control group (empty vector) are shown on the top. B and C, The fraction of each T-cell (B) or immune cell (C) subpopulation among all CD45+ immune cells from the indicated groups. D and E, Flow cytometry measuring the absolute numbers of CD8+ T cells (left) or proportions of IFN-γ+, granzyme B+, or Ki67+ cells among CD8+ T cells (right) in the indicated tumors. Middle: representative images showing the proportional change of IFN-γ+ CD8+ T cells by Uba1 overexpression (D) or Uba1 depletion (E). F, Flow cytometry measuring the absolute numbers of CD8+ T cells or proportions of IFN-γ+, granzyme B+, or Ki67+ cells among CD8+ T cells in the indicated tumors. G, Flow cytometry measuring the absolute numbers of CD4+ T cells, IFN-γ+ CD4+ T cells, or Ki67+ CD4+ T cells in the indicated tumors. All data are presented as box and whisker plots, except in B and C (bar graph). Statistics were acquired by the two-tailed Student t test. Data in DG are pooled from two independent experiments.
Figure 4.
Figure 4.
UBA1 inhibition synergizes with anti–PD-1 therapy to control tumor growth. A, Change of volume over time of subcutaneous tumors derived from B16-F10 cells in C57BL/6 mice treated with the indicated agents (n = 5–6 mice, per group). α-PD-1: anti–PD-1; Combo: TAK-243 plus α-PD-1. B, Individual growth curves of tumors in mice treated as in A. Last treatment was administered on day 14 after the initial treatment. CR, complete response. C, Survival of mice treated in A. D, Change of volume over time of the indicted tumor models in their syngeneic hosts treated with the indicated agents (n = 5–10 mice per group). E, Evaluation of drug synergism, using CombPDX (44), for the combination of TAK-243 and anti–PD-1 in the indicated models, treated as in A and D. A combination index larger than zero was defined as synergistic (44). *, P < 0.05; ***, P < 0.001. F, Left: change of volume over time of subcutaneous tumors derived from Myc-CaP cells transfected with nontargeting sgRNA (control) or sgRNAs depleting Uba1 (sgUba1) in FVB mice treated with α-PD-1 or the control IgG (n = 5 mice per group). Right: Evaluation of synergism using CombPDX for the combination of Uba1-depletion (sgUba1) and anti-PD-1 in the indicated model. G, Flow cytometry measuring the absolute numbers of IFN-γ+ CD8+ T cells in the indicated tumors from syngeneic mice treated with the indicated agents. H, Tumor growth over time of Myc-CaP subcutaneous tumors in control, TAK-243–treated, or TAK-243–treated and anti-PD-1–treated (combo) FVB mice, with (α-CD8) or without (IgG) CD8+ T-cell depletion (n = 5 mice, per group). I, Tumor growth over time of CT26 subcutaneous tumors at naïve or rechallenged stage, in control, TAK-243–treated, anti–PD-1–treated, or TAK-243–treated and anti–PD-1–treated (combo) BALB/c mice. Rechallenge was performed 4 days after removal of the primary tumors by surgery (n = 6–8 mice, per group). All data are presented as mean ± SEM, except E (mean) and G (box and whisker plots). Statistics were acquired by two-way ANOVA in A, D, F, and H, by log-rank test in C, or by two-tailed Student’s t test in G.
Figure 5.
Figure 5.
UBA1 inactivation upregulates interferon signaling via stabilization of JAK1. A, Hallmark pathways enriched by bulk RNA-seq of tumors with Uba1 depletion (sgUba1) versus control from the B16-BL6 (left) or Myc-CaP (right) subcutaneous tumor models. B, Hallmark pathways enriched by bulk RNA-seq of tumors with Uba1 overexpression (OE) versus control (empty vector) from the Myc-CaP subcutaneous tumor model (left) or of Myc-CaP subcutaneous tumors in TAK-243–treated vs. control mice (right). C, Left: UMAP of pooled CD45+ and CD45 cells from the indicated Myc-CaP tumors subjected to scRNA-seq. Clusters of malignant cells and leukocytes are shown. Right: hallmark pathways enriched by the scRNA-seq (shown in the left) of tumors with Uba1 depletion (sgUba1) versus control or tumors in TAK-243–treated vs. control mice. TAK-243 was administered via intravenous injection in B (right) and C. D, hallmark pathways enriched by bulk RNA-seq of Myc-CaP cells with Uba1 depletion (sgUba1) vs. control, with or without IFN-γ stimulation, or Myc-CaP cells treated with or without 50 nmol/L TAK-243 for 18 hours, and stimulated with or without IFN-γ. IFN-γ or IFN-α response pathways are highlighted in red in AD. E, Surface expression of MHC-I measured by flow cytometry in Myc-CaP cells with Uba1 depletion (sgUba1) or UBA1 inhibition by 18 hours of 50 nmol/L TAK-243 treatment, in the presence or absence of IFN-γ stimulation. Nontargeting sgRNA or DMSO were used as controls, respectively. Data were acquired from biological triplicates. F, Surface expression of MHC-I measured by flow cytometry in GFP-labeled Myc-CaP tumor cells that were Uba1 depleted or inactivated (n = 4 mice, per group). G, Mass spectrometry measuring protein abundance in Myc-CaP cells treated with 100 nmol/L TAK-243 for 4 hours and subsequently 50 µg/mL of cycloheximide (CHX) for an additional 6 hours. LFC, Log2 fold change. H, CRISPR knockout screens with sgRNAs targeting genes that were robustly upregulated by TAK-243 in G, in Myc-CaP cells that received TAK-243 and IFN-γ co-treatment (left) or TAK-243 and IFN-β co-treatment (right). I, Immunoblot analysis assessing levels of the indicated proteins in Myc-CaP cells with Uba1 depletion (sgUba1) or 18 hours of 50 nmol/L TAK-243 treatment in the presence of IFN-γ stimulation. Nontargeting sgRNA or DMSO were used as controls, respectively. J, Left: immunoblot analysis assessing JAK1 expression in Myc-CaP cells that received knockout of Jak1 (Jak1 KO). Cells receiving nontargeting sgRNA were used as control. Right: surface expression of MHC-I measured by flow cytometry in the indicated cells treated with or without 50 nmol/L TAK-243 and stimulated with or without IFN-γ. Data were acquired from technical triplicates, representative of two independent experiments. K, Volumes of tumors derived from Myc-CaP cells established as in J, in mice treated with or without the combination (combo) of anti-PD-1 and TAK-243 (n = 5 mice, per group). Data in J and K are representative of two independent experiments with two distinct sgRNAs. IFN-γ stimulation was performed at 1 ng/mL for 18 hours. All immunoblot analysis was representative of two independent experiments. Data are presented as mean ± SEM. Statistics were acquired by the two-tailed Student t test in E, F (TAK-243 vs. DMSO), and J, or by two-way ANOVA in F (sgUba1 vs. control) and K. **, P < 0.01; ***, P < 0.001; n.s., not significant. MFI, mean fluorescent index.
Figure 6.
Figure 6.
Depletion of Stub1 upregulates JAK1. A, Top: immunoblot analysis assessing levels of the indicated proteins in Myc-CaP cells that received distinct siRNAs or sgRNAs targeting Stub1. Nontargeting siRNA or sgRNA was used as control, respectively. Bottom: immunoblot analysis assessing levels of the indicated proteins in the indicated Myc-CaP cells. OE, overexpression. B, Representative images of multiplex immunofluorescence staining for the indicated proteins in UBA1-high and UBA1-low human tumor samples. CK, pan-cytokeratin. Scale bar, 50 µm. C, Schematic showing that UBA1 upregulation in tumor cells facilitates STUB1-mediated proteasomal degradation of a key IFN sensor, JAK1, resulting in low expression of IFN-stimulated genes and thus an immune-cold tumor microenvironment (left). By contrast, inhibition of UBA1 elevates JAK1 and enhances response to IFNs, contributing to the formation of an immune-hot tumor microenvironment (right).

References

    1. Janjigian YY, Shitara K, Moehler M, Garrido M, Salman P, Shen L, et al. . First-line nivolumab plus chemotherapy versus chemotherapy alone for advanced gastric, gastro-oesophageal junction, and oesophageal adenocarcinoma (CheckMate 649): a randomised, open-label, phase 3 trial. Lancet 2021;398:27–40. - PMC - PubMed
    1. Sahin U, Oehm P, Derhovanessian E, Jabulowsky RA, Vormehr M, Gold M, et al. . An RNA vaccine drives immunity in checkpoint-inhibitor-treated melanoma. Nature 2020;585:107–12. - PubMed
    1. Larkin J, Chiarion-Sileni V, Gonzalez R, Grob JJ, Cowey CL, Lao CD, et al. . Combined nivolumab and ipilimumab or monotherapy in untreated melanoma. N Engl J Med 2015;373:23–34. - PMC - PubMed
    1. Borghaei H, Paz-Ares L, Horn L, Spigel DR, Steins M, Ready NE, et al. . Nivolumab versus docetaxel in advanced nonsquamous non-small-cell lung cancer. N Engl J Med 2015;373:1627–39. - PMC - PubMed
    1. Sharma P, Pachynski RK, Narayan V, Fléchon A, Gravis G, Galsky MD, et al. . Nivolumab plus ipilimumab for metastatic castration-resistant prostate cancer: preliminary analysis of patients in the CheckMate 650 trial. Cancer Cell 2020;38:489–99.e3. - PubMed

MeSH terms

Substances