Comparative Study
. 2024 Nov 14:13:RP92025.
doi: 10.7554/eLife.92025.

Proteomic and functional comparison between human induced and embryonic stem cells

Affiliations
Comparative Study

Proteomic and functional comparison between human induced and embryonic stem cells

Alejandro J Brenes et al. Elife. .

Abstract

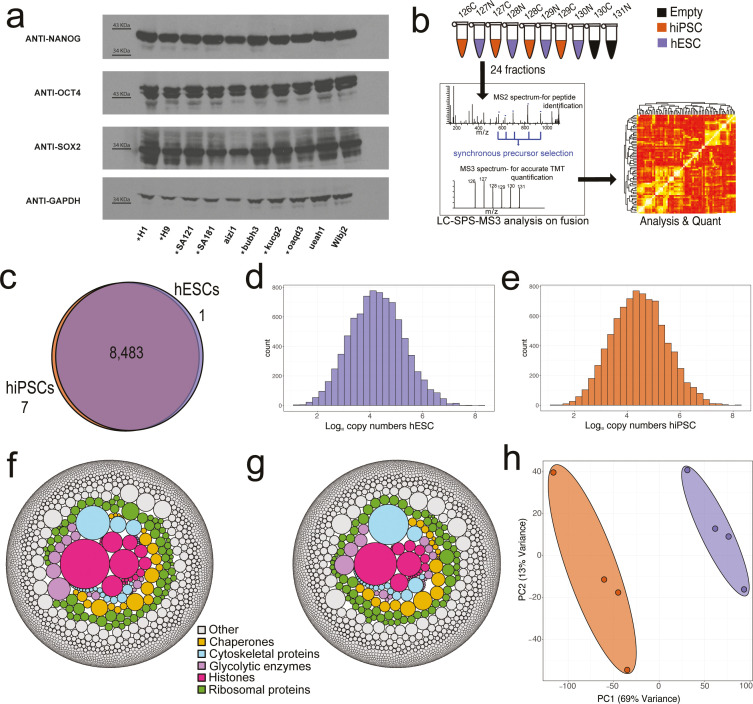
Human induced pluripotent stem cells (hiPSCs) have great potential to be used as alternatives to embryonic stem cells (hESCs) in regenerative medicine and disease modelling. In this study, we characterise the proteomes of multiple hiPSC and hESC lines derived from independent donors and find that while they express a near-identical set of proteins, they show consistent quantitative differences in the abundance of a subset of proteins. hiPSCs have increased total protein content, while maintaining a comparable cell cycle profile to hESCs, with increased abundance of cytoplasmic and mitochondrial proteins required to sustain high growth rates, including nutrient transporters and metabolic proteins. Prominent changes detected in proteins involved in mitochondrial metabolism correlated with enhanced mitochondrial potential, shown using high-resolution respirometry. hiPSCs also produced higher levels of secreted proteins, including growth factors and proteins involved in the inhibition of the immune system. The data indicate that reprogramming of fibroblasts to hiPSCs produces important differences in cytoplasmic and mitochondrial proteins compared to hESCs, with consequences affecting growth and metabolism. This study improves our understanding of the molecular differences between hiPSCs and hESCs, with implications for potential risks and benefits for their use in future disease modelling and therapeutic applications.

Keywords: biochemistry; chemical biology; hESC; human; iPSC; mass spectrometry; protein content; proteomics; regenerative medicine; stem cell; stem cells.


Conflict of interest statement

AB, LS, LD, AP, FS, EH, CE, HJ, HY, GF, DC No competing interests declared, EG Now works for Boehringer Ingelheim Pharma GmbH & Co KG, MP Board member of Tartan Cell Technologies Ltd, JS Board member of Tartan Cell Technologies Ltd and Glencoe Software Ltd, AL Board member of Tartan Cell Technologies Ltd and Platinum Informatics Ltd

Figures

Figure 1.
Figure 1.. Proteomic overview.
(a) Western blots showing the expression of the pluripotency factors NANOG, OCT4, and SOX2 across all human embryonic stem cell (hESC) and human induced pluripotent stem cell (hiSPC) lines. The eight lines showed with * were used within the proteomic analysis. (b) Diagram showing the SPS-MS3 tandem mass tag (TMT) proteomic workflow used for the experiment. (c) Venn diagram showing the overlap of proteins identified within the hiPSC and hESC populations. (d) Average copy number histogram for the hESCs (N=4). (e) Average copy number histogram for the hiPSCs (N=4). (f) Bubble plot showing proteins coloured by specific categories where the size is represented by the average hESC estimated protein copy numbers. (g) Bubble plot showing proteins coloured by specific categories where the size is represented by the average hiPSC estimated protein copy numbers. (h) Principal component analysis (PCA) plot based on the log10 copy numbers for all eight stem cell lines. hESCs are shown in purple and hiPSCs in orange.
Figure 1—figure supplement 1.
Figure 1—figure supplement 1.. Box plot showing the sum of the normalised intensity for all histones across human embryonic stem cells (hESCs) and human induced pluripotent stem cells (hiPSCs).
For the boxplots, the bottom and top hinges represent the first and third quartiles. The top whisker extends from the hinge to the largest value no further than 1.5 × IQR from the hinge; the bottom whisker extends from the hinge to the smallest value at most 1.5 × IQR of the hinge.
Figure 2.
Figure 2.. Normalisation and protein content.
(a) Concentration-based volcano plot showing the -log10 p-value and the log2 fold change comparing human induced pluripotent stem cells (hiPSCs) (N=4) to human embryonic stem cells (hESCs) (N=4). Elements shaded in red are considered significantly changed. All dots above the red line have a q-value lower than 0.001. (b) Copy number-based volcano plot showing the -log10 p-value and the log2 fold change comparing hESCs (N=4) to hiSPC (N=4). Elements shaded in red are considered significantly changed. All dots above the red line have a q-value lower than 0.001. (c) Boxplot showing the mass spectrometry (MS)-based estimated protein content for hESCs (N=4) and hiPSC(N=4). (d) Boxplot showing the protein amount per million cells derived from the EZQ Protein Quantification Kit for all hESCs (N=4) and hiPSC (N=4). (e) Boxplot showing the median forward scatter of hESCs (N=4) and hiPSCs (N=6). (f) Boxplot showing the median side scatter of hESCs (N=4) and hiPSCs (N=6). (g) Boxplot showing the median percentage of cells across cell cycle stages for hESCs (N=4) and hiPSCs (N=6). For all boxplots, the bottom and top hinges represent the first and third quartiles. The top whisker extends from the hinge to the largest value no further than 1.5 × IQR from the hinge; the bottom whisker extends from the hinge to the smallest value at most 1.5 × IQR of the hinge.
Figure 2—figure supplement 1.
Figure 2—figure supplement 1.. Barplot showing the results of a Gene Ontology Biological Process overrepresentation analysis for proteins that are significantly increased in human induced pluripotent stem cells (hiPSCs) compared to human embryonic stem cells (hESCs) in the copy number analysis.
Figure 3.
Figure 3.. Fuelling growth.
(a) Boxplots showing the estimated copy numbers for the lactate (SLC16A1 and SLC16A3) and glucose transporters (SLC2A1 and SLC2A3) across human embryonic stem cells (hESCs) (N=4) and human induced pluripotent stem cell (hiPSC) (N=4). (b) Schematic showing the glycolytic proteins and their fold change in hESC vs hiPSCs. This panel was created using BioRender.com. (c) Chord diagram showing the 15 most upregulated solute carrier proteins along with their classification based on transport activities/localisation. (d) Boxplots showing the estimated copy numbers of the main amino acid transporters in hESCs (N=4) and hiPSC (N=4). (e) Boxplot showing the net glutamine uptake (see Materials and methods) in hESCs (N=6) and hiPSC (N=6). (f) Schematic showing the glutaminolysis proteins and their fold change in hESCs (N=4) and hiPSC (N=4). This panel was created using BioRender.com. (g) Radar plot showing the median fold change (hiPSC/ESC) for protein categories which are related to the pre-ribosomes. Boxplots showing the estimated copy numbers for (h) SREBF1, (i) FASN, (j) SCD, (k) PLIN3 in hESCs (N=4) and hiPSC (N=4). (l) Transmission electron microscopy images for wibj_2 (hiPSC). Lipid droplets are marked with red arrows. (m) Transmission electron microscopy images for H1 (hESC). For all boxplots, the bottom and top hinges represent the first and third quartiles. The top whisker extends from the hinge to the largest value no further than 1.5 × IQR from the hinge; the bottom whisker extends from the hinge to the smallest value at most 1.5 × IQR of the hinge.
Figure 4.
Figure 4.. Mitochondrial differences.
(a) Schematic showing the mitochondrial genome encoded proteins and their fold change in human embryonic stem cells (hESCs) and human induced pluripotent stem cells (hiPSCs). This panel was created using BioRender.com. (b) Boxplot showing the estimated copy numbers of all mitochondrial ribosomal proteins hESCs (N=4) and hiPSC (N=4). (c) Schematic showing proteins involved in mitochondrial translation and their fold change (hiPSCs/hESCs). This panel was created using BioRender.com. (d) Treeplot showing all mitochondrial transporters, size is proportional to the median estimated copy numbers in hiPSCs (N=4). Boxplot showing the estimated copy numbers for (e) SLC25A20. (f) CPT1A. (g) MCAT, (h) MECR, (i) OSXM, in hESCs (N=4) and hiPSC (N=4). (j) Boxplot showing the log2 fold change (hiPSC/hESCs) for all subunits of the different complexes of the electron transport chain. The median fold change across all detected proteins is shown as a dotted line. (k) Schematic showing the fold change of critic acid cycle and glutaminolysis proteins in hiPSCs (N=4) vs hESCs (N=4). This panel was created using BioRender.com. (l) Boxplot showing the P (oxphos capacity)/E (electron transfer capacity) control ratio in wibj_2 (hiPSC; N=6) vs H1 (hESC; N=6). For all boxplots, the bottom and top hinges represent the first and third quartiles. The top whisker extends from the hinge to the largest value no further than 1.5 × IQR from the hinge; the bottom whisker extends from the hinge to the smallest value at most 1.5 × IQR of the hinge.
Figure 5.
Figure 5.. Secreted proteins.
(a) Sankey diagram showing the secreted proteins that belong to the extracellular matrix (ECM), growth factor, protease inhibitor, or protease categories and are significantly increased in abundance in human induced pluripotent stem cells (hiPSCs). (b) Schematic showing ECM proteins that are significantly increased in abundance in hiPSCs. Boxplot showing the estimated copy numbers for (c) TF, (d) TFRC, (e) FTH1, and (f) FTL in human embryonic stem cells (hESCs) (N=4) and hiPSC (N=4). (g) Schematic showing the changes in abundance in primed pluripotency growth factors. (h) Boxplot showing the estimated protein copy numbers for VGF. (i) Boxplot showing the estimated protein copy numbers for MDK. Boxplot showing the estimated protein copy numbers for (j) TGFB1, (k) ARG1, (l) CD276, (m) HLA-E, (n) CD200, and (o) CD47. All boxplots show the data for hESCs and hiPSCs. For all boxplots, the bottom and top hinges represent the first and third quartiles. The top whisker extends from the hinge to the largest value no further than 1.5 × IQR from the hinge; the bottom whisker extends from the hinge to the smallest value at most 1.5 × IQR of the hinge.
Figure 6.
Figure 6.. Changes within histones.
(a) Barplot showing the GO term enrichment results for proteins significantly decreased in abundance (see Materials and methods) in human induced pluripotent stem cells (hiPSCs). Boxplots showing estimated copy numbers for (b) HIST1H1E, (c) HIST1H1D, (d) HIST1H1C, and (e) H1FX in human embryonic stem cells (hESCs) (N=4) and hiPSC (N=4). (f) Barplot showing the median estimated copy numbers for all histones in hESCs and hiPSCs. Boxplots showing estimated copy numbers for (g) HIST1H3A and (h) HIST1H4A in hESCs and hiPSCs. Western blot showing the abundance of (i) H3 and (j) H4 histones in hESCs (N=4) and hiPSC (N=4). Boxplots showing estimated copy numbers for (k) H2AFV, (l) H2AFY, and (m) H2AFY2 in hESCs (N=4) and hiPSC (N=4). For all boxplots, the bottom and top hinges represent the first and third quartiles. The top whisker extends from the hinge to the largest value no further than 1.5 × IQR from the hinge; the bottom whisker extends from the hinge to the smallest value at most 1.5 × IQR of the hinge.
Figure 6—figure supplement 1.
Figure 6—figure supplement 1.. Schematic showing the unique and shared peptides detected for H1 histones as well as boxplots showing the log2 histone normalised intensity for both human embryonic stem cells (hESCs) and human induced pluripotent stem cells (hiPSCs).
For all boxplots, the bottom and top hinges represent the first and third quartiles. The top whisker extends from the hinge to the largest value no further than 1.5 × IQR from the hinge; the bottom whisker extends from the hinge to the smallest value at most 1.5 × IQR of the hinge.
Figure 6—figure supplement 2.
Figure 6—figure supplement 2.. Schematic showing the unique and shared peptides detected for H2AFV as well as boxplots showing the log2 histone normalised intensity for both human embryonic stem cells (hESCs) and human induced pluripotent stem cells (hiPSCs).
For all boxplots, the bottom and top hinges represent the first and third quartiles. The top whisker extends from the hinge to the largest value no further than 1.5 × IQR from the hinge; the bottom whisker extends from the hinge to the smallest value at most 1.5 × IQR of the hinge.
Author response image 1.

Update of

  • doi: 10.1101/2021.10.20.464767
  • doi: 10.7554/eLife.92025.1
  • doi: 10.7554/eLife.92025.2

Similar articles

Cited by

References

    1. Bhutia YD, Ganapathy V. Glutamine transporters in mammalian cells and their functions in physiology and cancer. Biochimica et Biophysica Acta. 2016;1863:2531–2539. doi: 10.1016/j.bbamcr.2015.12.017. - DOI - PMC - PubMed
    1. Brenes A, Hukelmann J, Bensaddek D, Lamond AI. Multibatch tmt reveals false positives, batch effects and missing values. Molecular & Cellular Proteomics. 2019;18:1967–1980. doi: 10.1074/mcp.RA119.001472. - DOI - PMC - PubMed
    1. Brenes AJ, Yoshikawa H, Bensaddek D, Mirauta B, Seaton D, Hukelmann JL, Jiang H, Stegle O, Lamond AI. Erosion of human X chromosome inactivation causes major remodeling of the iPSC proteome. Cell Reports. 2021;35:109032. doi: 10.1016/j.celrep.2021.109032. - DOI - PMC - PubMed
    1. Bröer A, Rahimi F, Bröer S. Deletion of amino acid transporter ASCT2 (SLC1A5) reveals an essential role for transporters SNAT1 (SLC38A1) and SNAT2 (SLC38A2) to sustain glutaminolysis in cancer cells. The Journal of Biological Chemistry. 2016;291:13194–13205. doi: 10.1074/jbc.M115.700534. - DOI - PMC - PubMed
    1. Bröer S. Amino acid transporters as targets for cancer therapy: why, where, when, and how. International Journal of Molecular Sciences. 2020;21:6156. doi: 10.3390/ijms21176156. - DOI - PMC - PubMed

Publication types

MeSH terms

LinkOut - more resources