

Fatiguing high-intensity intermittent exercise depresses maximal Na+-K+-ATPase activity in human skeletal muscle assessed using a novel NADH-coupled assay
- PMID: 39540939
- PMCID: PMC11761784
- DOI: 10.1007/s00424-024-03036-6
Fatiguing high-intensity intermittent exercise depresses maximal Na+-K+-ATPase activity in human skeletal muscle assessed using a novel NADH-coupled assay
Abstract
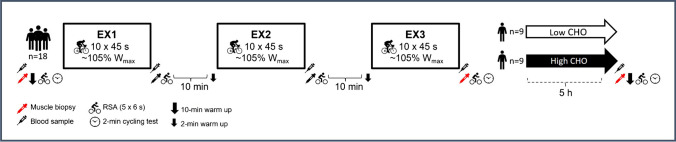
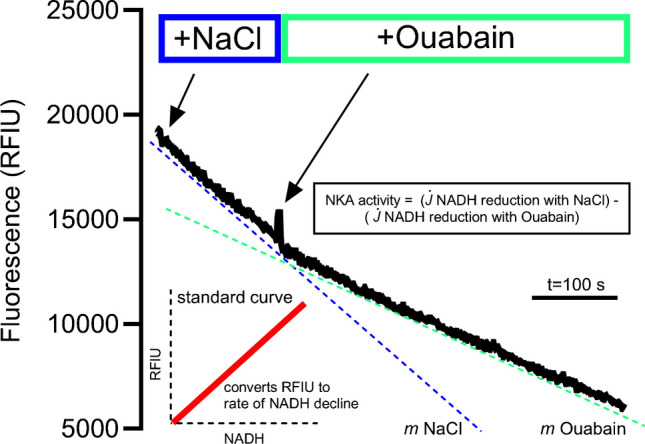
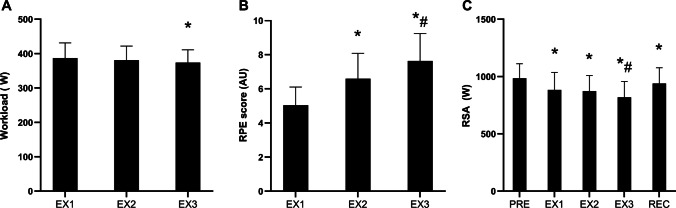
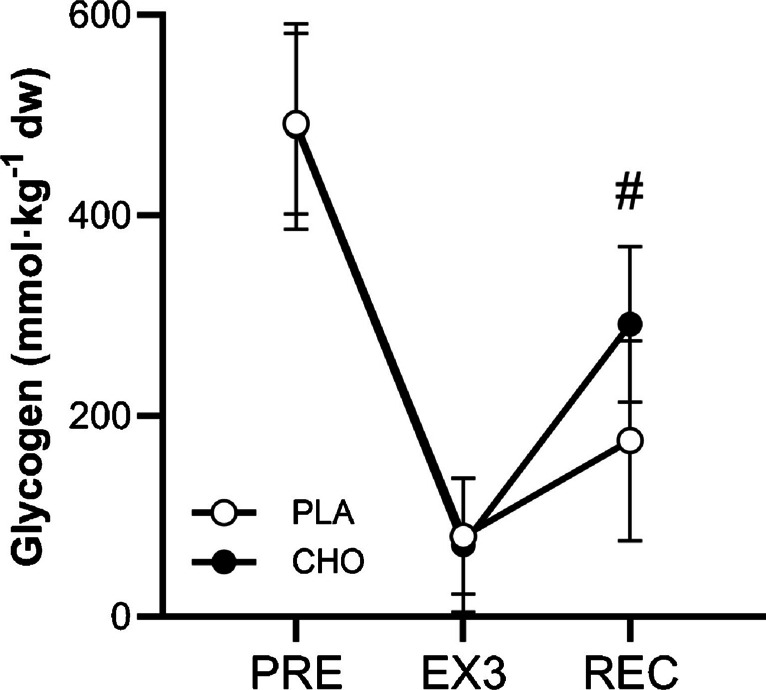
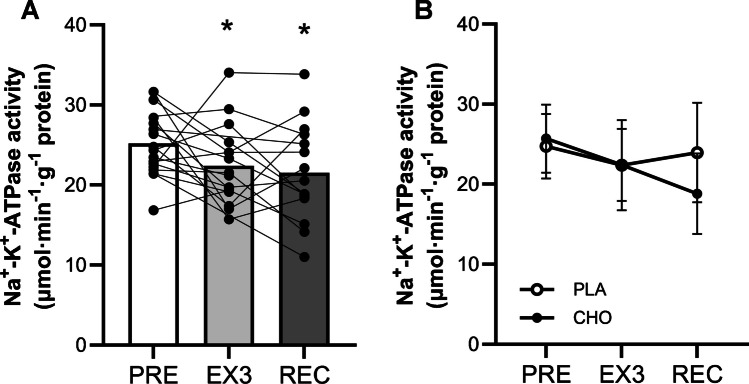
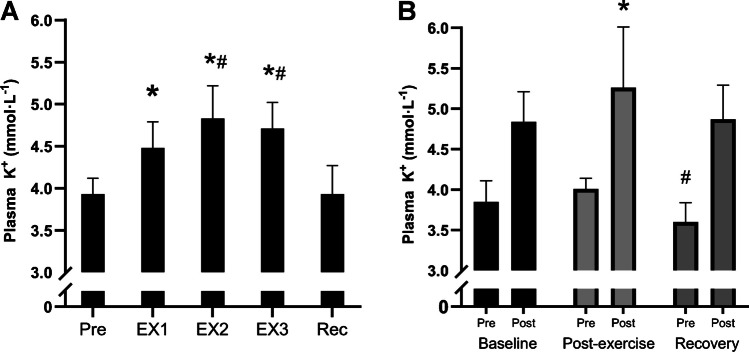
The Na+-K+-ATPase is a critical regulator of ion homeostasis during contraction, buffering interstitial K+ accumulation, which is linked to muscle fatigue during intense exercise. Within this context, we adopted a recently reported methodology to examine exercise-induced alterations in maximal Na+-K+-ATPase activity. Eighteen trained healthy young males completed a repeated high-intensity cycling protocol consisting of three periods (EX1-EX3) of intermittent exercise. Each period comprised 10 × 45-s cycling at ~ 105% Wmax and a repeated sprint test. Muscle biopsies were sampled at baseline and after EX3 for determination of maximal in vitro Na+-K+-ATPase activity. Blood was drawn after each period and in association with a 2-min cycling test at a standardized high intensity (~ 90% Wmax) performed before and after the session to assess plasma K+ accumulation. Further, a 5-h recovery period with the ingestion of carbohydrate or placebo supplementation was implemented to explore potential effects of carbohydrate availability before sampling a final biopsy and repeating all tests. A ~ 12% reduction in maximal Na+-K+-ATPase activity was demonstrated following EX3 compared to baseline (25.2 ± 3.9 vs. 22.4 ± 4.8 μmol·min-1·g-1 protein, P = 0.039), which was sustained at the recovery time point (~ 15% decrease compared to baseline to 21.6 ± 5.9 μmol·min-1·g-1 protein, P = 0.008). No significant effect of carbohydrate supplementation was observed on maximal Na+-K+-ATPase activity after recovery (P = 0.078). In conclusion, we demonstrate an exercise-induced depression of maximal Na+-K+-ATPase activity following high-intensity intermittent exercise, which was sustained during a 5-h recovery period and unrelated to carbohydrate availability under the present experimental conditions. This was shown using a novel NADH coupled assay and confirms previous findings using other methodological approaches.
Keywords: Carbohydrate; Excitability; Excitation–contraction coupling; Fatigue; Glycogen; Potassium.
© 2024. The Author(s).
Conflict of interest statement
Declarations. Competing interest: The authors declare no competing interests.
Figures
Similar articles
-
Acute oral digoxin in healthy adults hastens fatigue and increases plasma K+ during intense exercise, despite preserved skeletal muscle Na+,K+-ATPase.J Physiol. 2024 Dec;602(24):6849-6869. doi: 10.1113/JP287274. Epub 2024 Nov 23. J Physiol. 2024. PMID: 39580613 Clinical Trial.
-
Effects of high-intensity intermittent training on potassium kinetics and performance in human skeletal muscle.J Physiol. 2004 Feb 1;554(Pt 3):857-70. doi: 10.1113/jphysiol.2003.050658. Epub 2003 Nov 21. J Physiol. 2004. PMID: 14634198 Free PMC article.
-
Prolonged exercise to fatigue in humans impairs skeletal muscle Na+-K+-ATPase activity, sarcoplasmic reticulum Ca2+ release, and Ca2+ uptake.J Appl Physiol (1985). 2004 Oct;97(4):1414-23. doi: 10.1152/japplphysiol.00964.2003. Epub 2004 May 21. J Appl Physiol (1985). 2004. PMID: 15155714 Clinical Trial.
-
Potassium regulation during exercise and recovery in humans: implications for skeletal and cardiac muscle.J Mol Cell Cardiol. 1995 Apr;27(4):1011-22. doi: 10.1016/0022-2828(95)90070-5. J Mol Cell Cardiol. 1995. PMID: 7563098 Review.
-
Muscle K+, Na+, and Cl disturbances and Na+-K+ pump inactivation: implications for fatigue.J Appl Physiol (1985). 2008 Jan;104(1):288-95. doi: 10.1152/japplphysiol.01037.2007. Epub 2007 Oct 25. J Appl Physiol (1985). 2008. PMID: 17962569 Review.
Cited by
-
Lactic acidosis: implications for human exercise performance.Eur J Appl Physiol. 2025 Jul;125(7):1761-1795. doi: 10.1007/s00421-025-05750-0. Epub 2025 Mar 15. Eur J Appl Physiol. 2025. PMID: 40088272 Free PMC article. Review.
References
-
- Clausen T, Nielsen OB (1994) The Na+, K(+)-pump and muscle contractility. Acta Physiol Scand 152(4):365–373 - PubMed
-
- Hostrup M, Cairns SP, Bangsbo J (2021) Muscle Ionic Shifts During Exercise: Implications for Fatigue and Exercise Performance. Compr Physiol 11(3):1895–1959 - PubMed
-
- Sejersted OM, Sjogaard G (2000) Dynamics and consequences of potassium shifts in skeletal muscle and heart during exercise. Physiol Rev 80(4):1411–1481 - PubMed
-
- Ruff RL, Simoncini L, Stuhmer W (1988) Slow sodium channel inactivation in mammalian muscle: a possible role in regulating excitability. Muscle Nerve 11(5):502–510 - PubMed
MeSH terms
Substances
Grants and funding
LinkOut - more resources
Full Text Sources
Medical
Miscellaneous
