. 2024 Nov 14;81(1):452.
doi: 10.1007/s00018-024-05484-w.

Neutrophil-centric analysis of gastric cancer: prognostic modeling and molecular insights

Affiliations

Neutrophil-centric analysis of gastric cancer: prognostic modeling and molecular insights

Guangbo Tang et al. Cell Mol Life Sci. .

Abstract

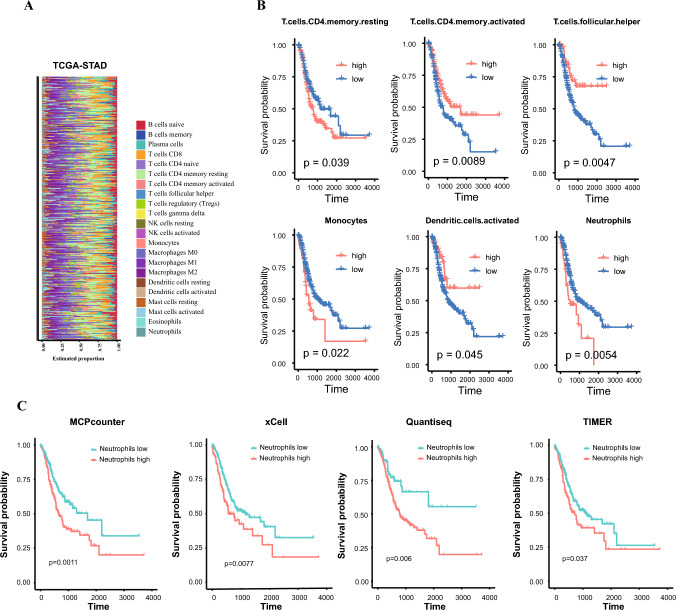
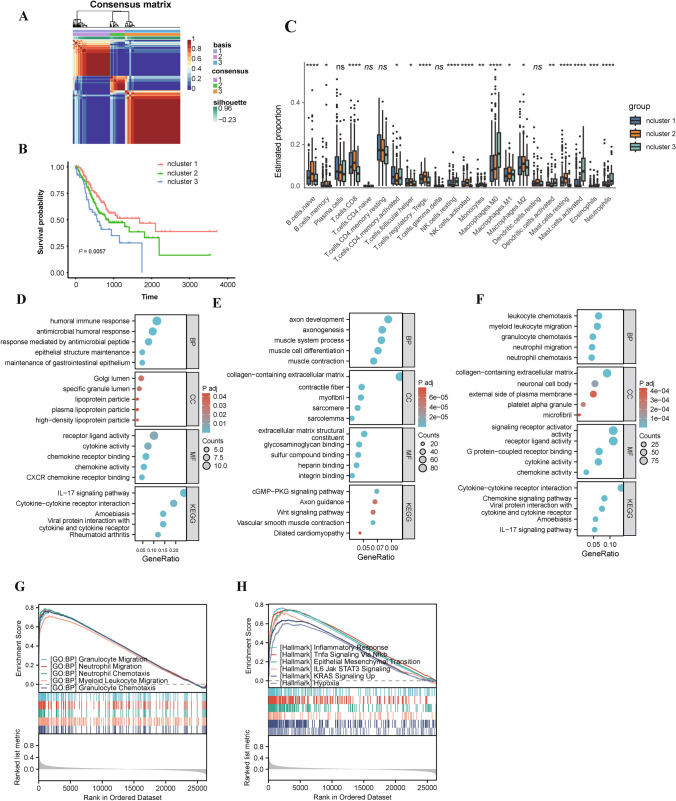
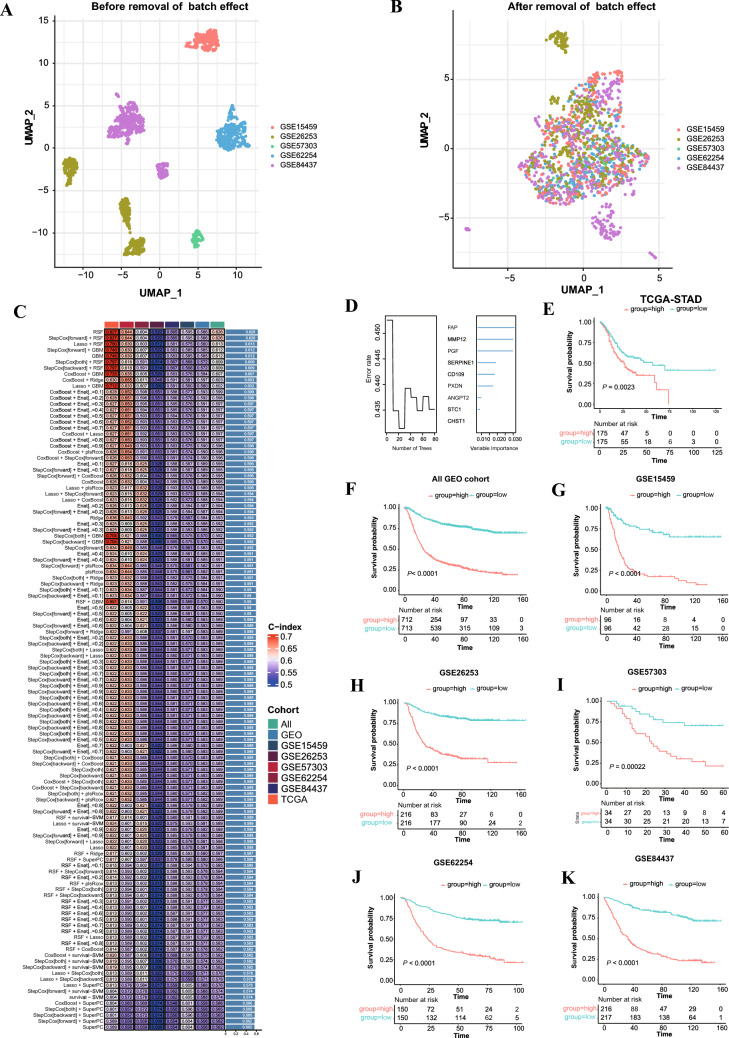
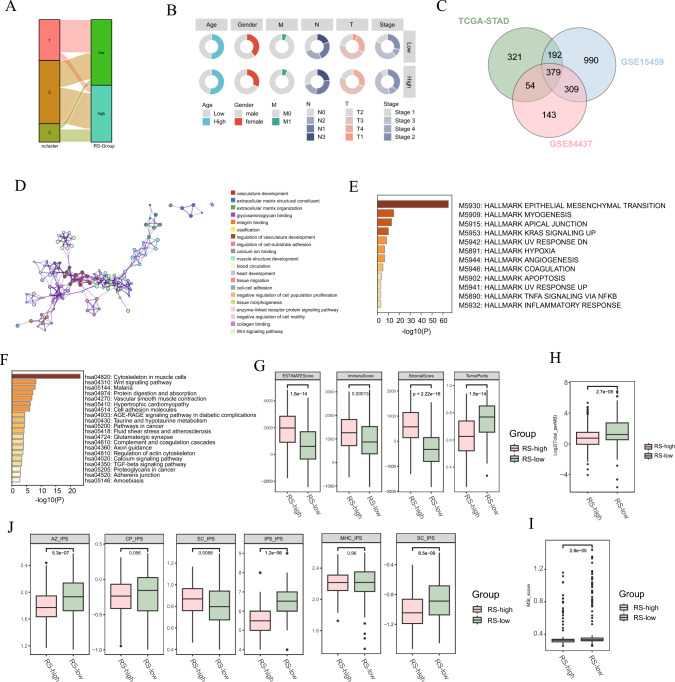
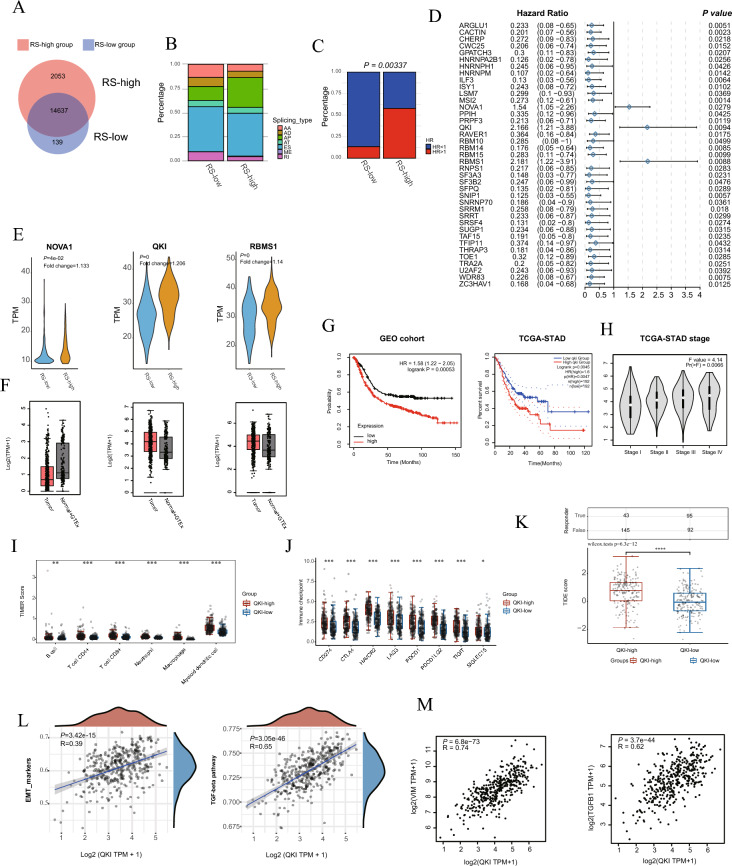
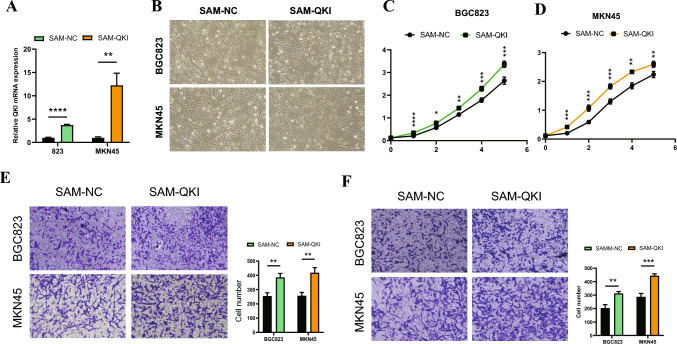
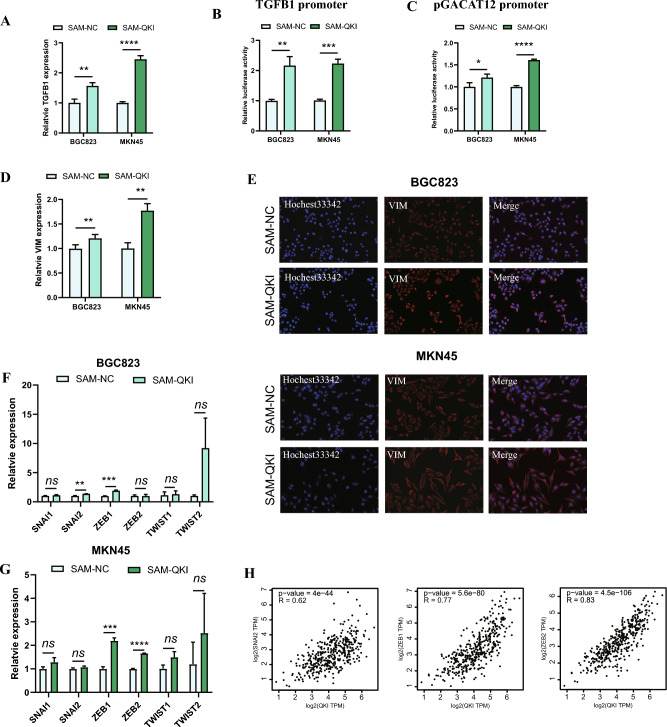
Gastric cancer remains a significant global health concern with poor prognosis. This study investigates the role of neutrophils in gastric cancer progression and their potential as prognostic indicators. Using multi-omics approaches, including Weighted Gene Co-expression Network Analysis (WGCNA), machine learning, and single-cell analysis, we identified neutrophil-associated gene signatures and developed a robust prognostic model. Our findings reveal distinct gastric cancer subtypes based on neutrophil-associated genes, with one subtype showing increased neutrophil infiltration and poorer prognosis. Single-cell analysis uncovered neutrophil-associated alterations in cell composition, gene expression profiles, and intercellular communication within the tumor microenvironment. Additionally, we explored the relationship between neutrophil-associated genes, microbiota composition, and alternative splicing events in gastric cancer. Furthermore, we identified QKI as a key regulator of alternative splicing and demonstrated its role in promoting malignant phenotypes and enhancing TGF-beta signaling and epithelial-mesenchymal transition in gastric cancer cells by wet experiment. Lastly, the role of QKI in the association with drug resistance and the identification of specific agents for treating QKI-associated drug resistance were also explored. This comprehensive study provides novel insights into the complex interplay between neutrophils, the tumor microenvironment, microbiota, alternative splicing and gastric cancer progression, offering potential new targets for therapeutic intervention.

Keywords: Alternative splicing; Drug resistance; Epithelial-mesenchymal transition (EMT); Gastric cancer; Machine learning; Microbiota; Neutrophils; Prognosis model; QKI; Single-cell analysis; TGF-beta signaling; Tumor microenvironment.


Conflict of interest statement

Declarations Conflict of Interests The authors declare that they have no competing interests. Ethics approval Not applicable. Consent to participate Not applicable. Consent to publish Not applicable.

Figures

Fig. 1
Fig. 1
Analysis of immune cell composition and survival in TCGA-STAD dataset. A Heatmap demonstrate the immune cell composition of TCGA-STAD samples as determined by CIBERSORT parameter. Each row represents a sample. B Kaplan–Meier survival curves for immune cell types significantly associated with prognosis. Patients were stratified into high (red) and low (blue) groups based on the abundance of each cell type. C Survival analysis based on neutrophil abundance as determined by different deconvolution methods (MCPcounter, xCell, Quantiseq, and TIMER). The log-rank test was used for statistical analysis
Fig. 2
Fig. 2
Weighted Gene Co-expression Network Analysis (WGCNA) and functional enrichment of neutrophil-associated genes. A Dendrogram of sample clustering to detect outliers. B Analysis of network topology for various soft-thresholding powers to determine scale independence. C Cluster dendrogram of genes, with dissimilarity based on topological overlap, showing module colors. D Heatmap of the correlation between module eigengenes and immune cell traits. The color scale represents the strength and direction of correlations, with red indicating positive and blue indicating negative correlations. E Gene Ontology (GO) biological process enrichment analysis of genes in the MElightyellow module
Fig. 3
Fig. 3
Molecular subtyping and characterization of gastric cancer based on neutrophil-associated gene expression. A Consensus matrix of non-negative matrix factorization (NMF) clustering using genes from the MElightyellow module in the up mentioned section. B Kaplan–Meier survival analysis of the three NMF-derived clusters. The log-rank test was used for statistical analysis. C Tumor microenvironment cell composition across the three clusters. Kruskal–Wallis test was used for statistical analysis. *P < 0.05, **P < 0.01, ***P < 0.001, ****P < 0.0001, ns: not significant. (D-F) Gene Ontology (GO) and Kyoto Encyclopedia of Genes and Genomes (KEGG) pathway enrichment analyses of cluster-specific genes of Cluster 1(D), Cluster 2(E), Cluster 3(F). (G-H) Gene Set Enrichment Analysis (GSEA) of GO Biological Process terms (G) and Hallmark gene sets (H) associated with cluster 3
Fig. 4
Fig. 4
Integration and validation of a neutrophil-based prognostic model in gastric cancer. (A-B) UMAP plots of sample clustering before (A) and after (B) batch effect removal across multiple GEO datasets. C Heatmap of machine learning model performance using various algorithms and their combinations to establish a neutrophil gene-based prognostic model. D Variable importance plot from the optimized Random Forest model. EK Kaplan–Meier survival analyses based on the Random Forest model scores in different cohorts: TCGA-STAD (E), all GEO cohorts combined (F), GSE15459 (G), GSE26253 (H), GSE57303 (I), GSE62254 (J), and GSE84437 (K)
Fig. 5
Fig. 5
Characterization of gastric cancer subtypes based on the neutrophil-derived prognostic model. A Sankey diagram showing the correspondence between NMF clustering and Random Forest score-based grouping. B Clinical characteristics of patients grouped by Random Forest scores. C Venn diagram of overlapping genes highly expressed in the high-risk group across different datasets. DF Functional enrichment analysis of common high-expression genes: Gene Ontology (D), Hallmark gene sets (E), and KEGG pathways (F). GJ Boxplots comparing distributions between random forest scored based high and low-risk groups (RS-high and RS-low groups) for: ESTIMATE scores (G), Tumor Mutation Burden (H), Microsatellite Instability status (I), Immunophenoscore (J)
Fig. 6
Fig. 6
Prognostic model development and evaluation based on random forest score in TCGA-STAD cohort. A Univariate Cox regression analysis of clinical parameters and random forest score in TCGA-STAD cohort. B Multivariate Cox regression analysis incorporating significant factors from univariate analysis. C Nomogram constructed using the random forest score and significant clinical factors. DE Evaluation of the nomogram's performance: Calibration curves for 1-, 3-, and 5-year overall survival predictions (D). Decision curve analysis (DCA) comparing the nomogram’s clinical utility to other models (E). FH Time-dependent ROC curves for 1-, 3-, and 5-year overall survival predictions, comparing the nomogram's performance with individual factors
Fig. 7
Fig. 7
Single-cell RNA sequencing analysis reveals cellular heterogeneity associated with random forest score in gastric cancer. A, B UMAP plots showing cell clustering and composition after batch effect removal in GSE167297 (A) and GSE183904 (B). C, D Distribution of random forest scores at single-cell and cluster levels across indicated datasets. E Grouping of GSE183904 dataset based on random forest scores. F GO enrichment analysis of upregulated genes in the single cell level random forest score high (SRS-high) group. G Pie charts showing cell type composition in SRS-high and single cell level random forest score low (SRS-low) groups. H Barplot demonstrating the number of differentially expressed genes at cluster level in comparison of SRS-high to SRS-low score groups. I Petal diagram showing overlap of upregulated genes across clusters in the SRS-high group. JN Gene enrichment analysis of upregulated genes in specific cell types of the SRS-high group
Fig. 8
Fig. 8
Cell–cell communication and transcription factor activity analysis in neutrophil associated random forest score-based groups. A Bar plot comparing the number of interactions and interaction strength between SRS-low and SRS-high groups. B Differential number of interactions (left) and interaction strength (right) in comparison of the SRS-high to SRS-low group. C Relative information flow analysis in comparison of the SRS-high to SRS-low group, showing differentially expressed ligands and receptors. D Scatter plots of incoming and outgoing interaction strengths for different cell types in SRS-low and SRS-high groups. E Differential incoming and outgoing interaction strengths for monocytes, fibroblast cells, and T cells in comparison of the SRS-high to SRS-low group. FH Heatmaps showing increased signaling pathways in SRS-high group for monocytes (F), fibroblast cells (G), and T cells (H). I Dot plot of transcription factor activities across different cell types between SRS-low and SRS-high groups. J, K Heatmaps displaying the Regulatory Score (J) and gene expression (K) of indicated transcriptional factors
Fig. 9
Fig. 9
Microbiome analysis in gastric cancer based on neutrophil associated random forest score grouping. A Stacked bar plot showing microbial composition in RS-high and RS-low groups. B Violin plots comparing alpha diversity indices (ACE, Chao1, Shannon) between groups. C PCoA plot based on Bray–Curtis dissimilarity, showing beta diversity between groups. D Volcano plot of differentially abundant microbes between RS-high and RS-low groups. E Bar plot showing log2 fold changes of the top 8 differentially abundant genera between groups. F Network plot illustrating the correlation between RS group-specific genera and genes constituting the random forest score. Yellow lines indicate positive correlations, while black lines indicate negative correlations. Only correlations with P < 0.05 are shown. (G, H) Kaplan–Meier survival curves for the indicated genera. Only genera with statistically significant differential abundance between RS-high and RS-low groups were used for further survival analysis.
Fig. 10
Fig. 10
Alternative splicing landscape and splicing factor QKI analysis in gastric cancer stratified by neutrophil associated random forest score. A Venn diagram showing the number of alternative splicing events in RS-high and RS-low groups. B Stacked bar plot displaying the distribution of alternative splicing event types in both groups. AA: Alternate Acceptors, AD: Alternate Donors, ES: Exon Skip, RI: Retained Intron, AP: Alternate Promoters, AT: Alternate Terminators, ME: Mutually Exclusive Exons. C Bar plot comparing the proportion of prognostic alternative splicing events between groups. D Forest plot of univariate Cox regression analysis for splicing factors in TCGA-STAD. E Violin plots showing expression of NOVA1, QKI, and RBMS1 between RS-high and RS-low groups. F Box plots comparing expression of NOVA1, QKI, and RBMS1 between tumor and normal samples in TCGA-STAD and GTEx datasets. G Kaplan–Meier survival curves for QKI expression in GEO and TCGA cohorts. H Violin plot showing QKI expression across different clinical stages. I, J Box plots comparing immune cell infiltration levels (I) and immune checkpoint gene expression (J) between QKI-high and QKI-low groups. K Box plot comparing TIDE scores between QKI-high and QKI-low groups. L, M Scatter plots showing correlations between QKI expression and EMT score, TGF-beta pathway activity, and the expression of VIM and TGF-β1 (M)
Fig. 11
Fig. 11
QKI overexpression enhances cell growth, migration, and invasion in gastric cancer. (A) Relative QKI mRNA expression in BGC823 and MKN45 cells transfected with SAM-NC or SAM-QKI. B Representative microscopy images showing cell morphology of BGC823 and MKN45 cells with SAM-NC or SAM-QKI transfection. C, D Cell proliferation curves for BGC823 (C) and MKN45 (D) cells transfected with SAM-NC or SAM-QKI. The Student’s t-test was used for statistical analysis. (E, F) Cell migration (E) and invasion (F) assays for BGC823 and MKN45 cells with SAM-NC or SAM-QKI transfection. Representative images (left) and quantification (right) of migrated/invaded cells are shown. *P < 0.05, **P < 0.01, ***P < 0.001, ****P < 0.0001
Fig. 12
Fig. 12
QKI overexpression promote the expression of TGF-β1 and EMT-related genes and signaling pathways in gastric cancer cells. (A-C) Relative mRNA expression (A) and promoter activity of TGF-β1 (B) and pGACATI2 (C) in BGC823 and MKN45 cells with SAM-NC or SAM-QKI. D Relative VIM mRNA expression in BGC823 and MKN45 cells with SAM-NC or SAM-QKI. E Immunofluorescence images representing VIM expression (red) in BGC823 and MKN45 cells with SAM-NC or SAM-QKI. Nuclei are stained with Hoechst33342 (blue). F, G Relative mRNA expression of EMT-related transcription factors in BGC823 (F) and MKN45 (G) cells with SAM-NC or SAM-QKI. H Correlation analysis between QKI and EMT-related genes in TCGA-STAD dataset. *P < 0.05, **P < 0.01, ***P < 0.001, ****P < 0.0001, ns: not significant
Fig. 13
Fig. 13
Analysis of drug sensitivity in gastric cancer based on QKI expression levels. A Distribution of drug categories showing differential sensitivity between QKI-high and QKI-low groups in TCGA-STAD dataset. B Box plots of IC50 values for indicated drugs in QKI-high and QKI-low groups. C Circular plot representing candidate drugs for QKI overexpression. Only genes with a spearman correlation score of R < -0.6 and P < 0.05 are illustrated. The height of each bar represents the negative correlation P-value (-P) between QKI expression levels and drug IC50. D Cell viability of cells under various drug concentrations. Student’s t-test was used for statistical analysis. *P < 0.05, **P < 0.01, ***P < 0.001, ****P < 0.0001, ns: not significant

Similar articles

Cited by

References

    1. Sung H, Ferlay J, Siegel RL, Laversanne M, Soerjomataram I, Jemal A et al (2021) Global cancer statistics 2020: GLOBOCAN estimates of incidence and mortality worldwide for 36 cancers in 185 countries. CA Cancer J Clin 71:209–249 - PubMed
    1. Arneth B (2019) Tumor microenvironment. Medicina 56:15 - PMC - PubMed
    1. Anderson NM, Simon MC (2020) The tumor microenvironment. Curr Biol 30:R921–R925 - PMC - PubMed
    1. Coffelt SB, Wellenstein MD, de Visser KE (2016) Neutrophils in cancer: neutral no more. Nat Rev Cancer 16:431–446 - PubMed
    1. Bekes EM, Schweighofer B, Kupriyanova TA, Zajac E, Ardi VC, Quigley JP et al (2011) Tumor-recruited neutrophils and neutrophil TIMP-free MMP-9 regulate coordinately the levels of tumor angiogenesis and efficiency of malignant cell intravasation. Am J Pathol 179:1455–1470 - PMC - PubMed

MeSH terms

LinkOut - more resources