

Chest-CT-based radiomics feature of epicardial adipose tissue for screening coronary atherosclerosis
- PMID: 39540983
- PMCID: PMC12009230
- DOI: 10.1007/s00380-024-02479-2
Chest-CT-based radiomics feature of epicardial adipose tissue for screening coronary atherosclerosis
Abstract
Background and aims: This study aims to investigate the diagnostic value of chest-CT epicardial adipose tissue (EAT) radiomics feature in coronary atherosclerotic stenosis.
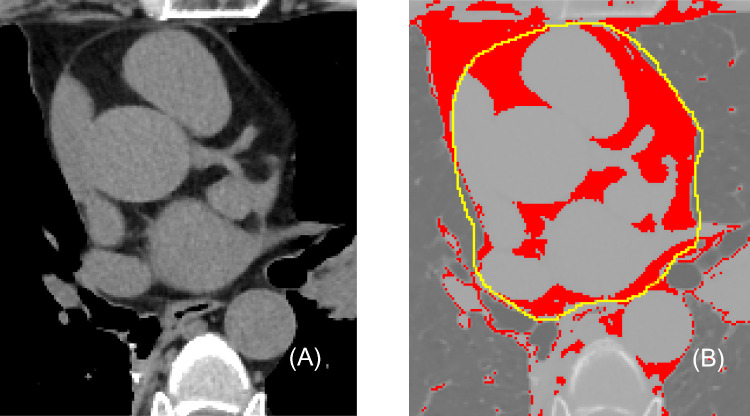
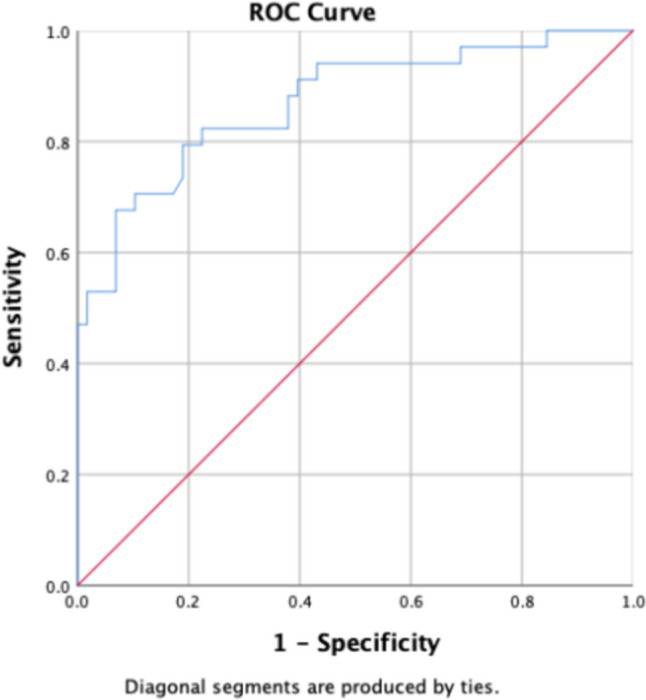
Methods: Clinical data from 215 individuals who underwent coronary angiography and chest-CT scan from January to July 2022 at our institution were retrospectively analyzed. Based on the coronary angiography results, the total population, men, and women were divided into the CAD group and non-CAD group. radiomics feature of EAT at the level of the bifurcation of the left-main coronary artery on the transverse level of chest CT were measured. The features contain both first-order feature and shape-order feature.The differences between groups were analyzed using the t test or Chi-square test. The diagnostic efficacy of each parameter in diagnosing atherosclerotic stenosis of coronary arteries was assessed by plotting the receiver operating characteristic (ROC) curve.
Results: First-order features: Mean, IntDen, Median, and RawIntDen; shape-order features: Area, Perim, Round, and BSA index; and clinical index: HbA1c showed statistical significance between the CAD group and the non-CAD group. The ROC curve analysis demonstrated high diagnostic efficacy, with the best for diagnostic efficacy being Median for the first-order feature parameter (AUC, 0.753; 95% confidence interval [CI], 0.689-0.817; t = 4.785, p < 0.001), Round for the shape-order feature (AUC, 0.775; 95% CI, 0.714-0.836; t = 7.842, p < 0.001), and HbA1c for the clinical index (AUC, 0.797; 95% CI, 0.783-0.856; t = 6.406, p < 0.001). After dividing the participants into male and female subgroups, the best diagnostic efficacy was observed with the BSA index for men (AUC, 0.743; 95% CI, 0.656-0.829; t = 5.128, p < 0.001) and Round for women (AUC, 0.871; 95% CI, 0.793-0.949; t = 7.247, p < 0.001).
Conclusions: Median, Round in radiomics feature of EAT on chest CT may play a role in the assessment of coronary atherosclerotic stenosis.
Keywords: Coronary atherosclerosis stenosis; Epicardial adipose tissue; Radiomics feature; Subject operating characteristic curves.
© 2024. The Author(s).
Conflict of interest statement
Declarations. Conflict of interest: The authors declare that there is no conflict of interest. Ethical approval: The subject has been informed verbally about this study and consent has been obtained. Generally, when the subject has a CT examination, we will ask for his opinion verbally and when the subject gives his consent, we will register the data information.
Figures


Similar articles
-
The value of diagnosing coronary slow flow based on epicardial adipose tissue radiomics in chest computed tomography.BMC Med Imaging. 2025 Jul 1;25(1):258. doi: 10.1186/s12880-025-01792-0. BMC Med Imaging. 2025. PMID: 40596922 Free PMC article.
-
Is the epicardial adipose tissue area on non-ECG gated low-dose chest CT useful for predicting coronary atherosclerosis in an asymptomatic population considered for lung cancer screening?Eur Radiol. 2019 Feb;29(2):932-940. doi: 10.1007/s00330-018-5562-4. Epub 2018 Jun 28. Eur Radiol. 2019. PMID: 29955949
-
Diagnosis of perimenopausal coronary heart disease patients using radiomics signature of pericoronary adipose tissue based on coronary computed tomography angiography.Sci Rep. 2024 Aug 23;14(1):19643. doi: 10.1038/s41598-024-70218-8. Sci Rep. 2024. PMID: 39179762 Free PMC article.
-
Predictive Value of CCTA-based Pericoronary Adipose Tissue Imaging for Major Adverse Cardiovascular Events.Acad Radiol. 2025 Jan;32(1):91-101. doi: 10.1016/j.acra.2024.08.022. Epub 2024 Sep 20. Acad Radiol. 2025. PMID: 39304378
-
Epicardial adipose tissue volume assessed by computed tomography and coronary artery disease: a systematic review and meta-analysis.Eur Heart J Cardiovasc Imaging. 2018 May 1;19(5):490-497. doi: 10.1093/ehjci/jex314. Eur Heart J Cardiovasc Imaging. 2018. PMID: 29236951
References
-
- Packer M (2018) Epicardial adipose tissue may mediate deleterious effects of obesity and inflammation on the myocardium. J Am Coll Cardiol 71(20):2360–2372 - PubMed
-
- Lacobellis G (2015) Local and systemic effects of the multifaceted epicardial adipose tissue depot. Nat Rev Endocrinol 11(6):363–371 - PubMed
-
- Oikonomou EK, Antonisdes C (2019) The role of adipose tissue in cardiovascular health and disease. Nat Rev Cardiol 16(2):83–99 - PubMed
-
- Nalliah CJ, Bell JR, Raaijmakers AJA, Waddell HM, Wells SP, Bernasochi GB, Montgomery MK, Binny S, Watts T, Joshi SB, Lui E, Sim CB, Larobina M, O’Keefe M, Goldblatt J, Royse A, Lee G, Porrello ER, Watt MJ, Kistler PM, Sanders P, Delbridge LMD, Kalman JM (2020) Epicardial adipose tissue accumulation confers atrial conduction abnormality. J Am Coll Cardiol 76(10):1197–1211 - PubMed
MeSH terms
Grants and funding
LinkOut - more resources
Full Text Sources
Medical
Miscellaneous
