. 2024 Nov 19;121(47):e2404927121.
doi: 10.1073/pnas.2404927121. Epub 2024 Nov 14.

Monocytes give rise to Langerhans cells that preferentially migrate to lymph nodes at steady state

Affiliations

Monocytes give rise to Langerhans cells that preferentially migrate to lymph nodes at steady state

Hayley M Raquer-McKay et al. Proc Natl Acad Sci U S A. .

Abstract

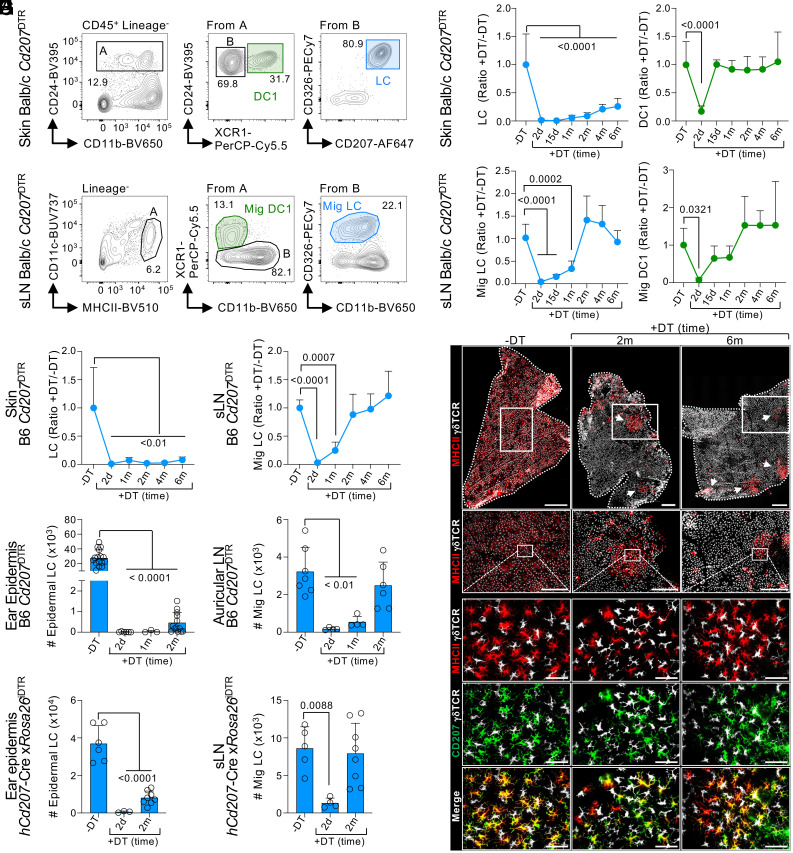
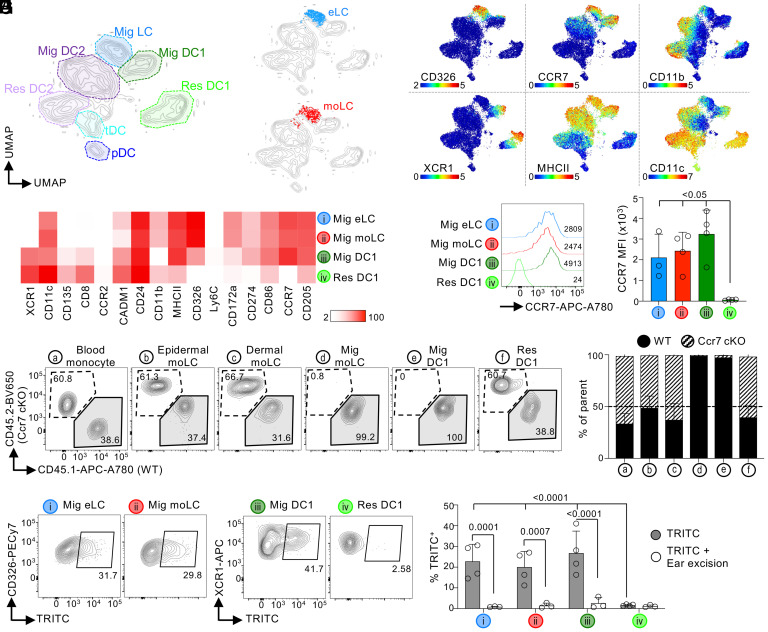
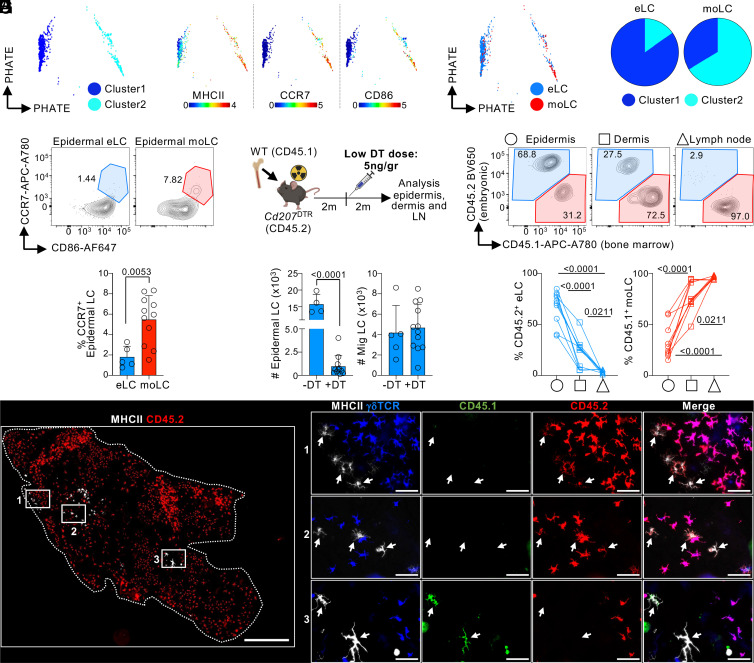
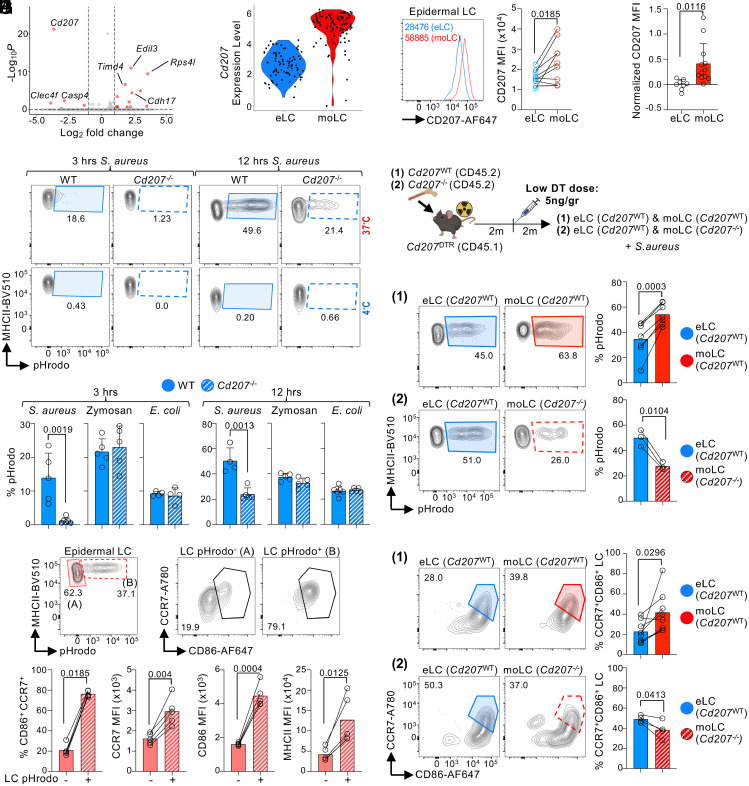
Current evidence suggests that ontogeny may account for the functional heterogeneity of some tissue macrophages, but not others. Here, we asked whether developmental origin drives different functions of skin Langerhans cells (LCs), an embryo-derived mononuclear phagocyte with features of both tissue macrophages and dendritic cells. Using time-course analyses, bone marrow chimeras, and fate tracing models, we found that the complete elimination of embryo-derived LCs at steady state results in their repopulation from circulating monocytes. However, monocyte-derived LCs inefficiently replenished the epidermal niche. Instead, these cells preferentially migrated to skin-draining lymph nodes. Mechanistically, we show that the enhanced migratory capability of monocyte-derived LCs is associated with higher expression of CD207/Langerin, a C-type lectin involved in the capture of skin microbes. Our data demonstrate that ontogeny plays a role in the migratory behavior of epidermal LCs.

Keywords: Langerhans cells; development; macrophages; migration; skin.


Conflict of interest statement

Competing interests statement:J.I. serves on the scientific advisory board of Immunitas Therapeutics. The remaining authors declare no competing interests.

Figures

Fig. 1.
Fig. 1.
LCs repopulate sLN, but not the epidermis, after their depletion at steady state. (AD) Balb/c Cd207DTR mice were inoculated or not with 50 ng/gr body weight DT. Ears and sLN (popliteal, inguinal, brachial, and axillary) were harvested, and cell suspensions were stained for flow cytometry analysis. (A) Gating strategy to identify skin LCs and DC1s. (B) Skin LC (Left) and DC1 (Right) numbers were quantified over time and normalized to non-DT controls. Shown is the mean + SD (n = 5-13 mice in 4 to 10 exp.; one-way ANOVA with Dunnett’s multiple comparison). (C) Gating strategy to identify migratory LCs (Mig LC) and DC1s (Mig DC1) in sLN. (D) Mig LC (Left) and Mig DC1 (Right) numbers were quantified and normalized to non-DT controls (n = 4-19 mice in 4 to 10 exp.; one-way ANOVA with Dunnett’s multiple comparison). (EG) B6 Cd207DTR mice were treated or not with 50 ng/gr body weight DT. (E) LCs were quantified in the skin (Left) and sLN (Right) and normalized to non-DT controls (n = 3-22 mice in 2 to 7 exp.; one-way ANOVA with Dunnett’s multiple comparison). (F) The ear epidermis was stained for MHCII+CD207+ LCs and γ δTCR+ T cells by microscopy (1 of 4 exp.). Top panel, epidermal sheet stitching (scale bar: 500 μm); second row, magnification of white squares from the Top panel (scale bar: 100 μm); and Bottom panels, magnification of second row (scale bar: 50 μm). (G) LC numbers were quantified in the ear epidermis (Left; n = 3-12 mice in 2 to 4 exp.; one-way ANOVA with Dunnett’s multiple comparison) and ear-draining auricular LN (n = 4-7 mice in 2 to 3 exp.; one-way ANOVA with Dunnett’s multiple comparison). (H) hCd207-Cre xRosa26iDTR mice were inoculated or not with 50 ng/gr body weight DT. Numbers of epidermal LCs (Left) and Mig LCs in sLN (Right) are shown as the mean + SD (n = 3-8 mice in 3 exp.; one-way ANOVA with Dunnett’s multiple comparison). d: days; m: months; Mig: migratory.
Fig. 2.
Fig. 2.
Monocytes give rise to LCs at steady state. (AC) CD45.2 B6 Cd207DTR mice were lethally irradiated and transplanted with CD45.1 WT bone marrow, followed by inoculation with 50 ng/gr body weight of DT. The epidermis and sLN were analyzed at 2 or 4 mo post-DT. (A) Experimental design (Left) and epidermal LC numbers as the mean + SD (n = 3-4 mice in 2 to 3 exp.; one-way ANOVA with Dunnett’s multiple comparison). (B) Expression of CD45.2 and CD45.1 in epidermal LCs (Top) and Mig LCs (Bottom). Representative flow cytometry analysis (Left) and mean + SD (n = 3-4 mice in 2 to 3 exp.; Right). (C) The ear epidermis was stained for MHCII+ LCs, radioresistant γδTCR+ T cells, CD45.1, and CD45.2 by microscopy 4 mo post-DT (1 of 3 exp.). Top panels, epidermal sheet stitching (scale bar: 500 μm); Bottom panels, magnified region of white squares (scale bar: 50 μm). (D) As in (A), but the ears and shoulders of Cd207WT (DTR-) and Cd207DTR (DTR+) mice were shielded before 9 Gy irradiation and bone marrow transplantation, followed by inoculation with 50 ng/gr body weight of DT. Left shows epidermal LC numbers (mean + SD; Student’s t test) at 2 mo post-DT. Right shows the mean + SD of CD45.1/CD45.2 expression normalized to blood B cells (n = 4-5 mice in 3 exp.; one-way ANOVA with Dunnett’s multiple comparison). (E) B6 CD45.2 Cd207DTR mice were lethally irradiated and transplanted with 50% Ccr2−/−(CD45.2) and 50% WT (CD45.1) bone marrow, followed by 50 ng/gr body weight DT. Top shows experimental design. Bottom shows a representative flow cytometry staining, and the mean + SD of CD45.1/CD45.2 expression 2 mo post-DT (n = 3 mice in 1 exp.). (F) As in (E), but the ears and shoulders of mice were shielded before irradiation (9 Gy) and transplantation with 50% Ccr2−/−(CD45.2) and 50% WT (CD45.1) bone marrow. Shown is the mean + SD of CD45.2/CD45.1 expression normalized to blood B cells (n = 5 mice in 1 exp; one-way ANOVA with Tukey’s multiple comparison). (G) B6 CD45.1 Cd207DTR mice were lethally irradiated, transplanted with CD45.2 Ms4a3cre xRosa26LSL-TdTomato bone marrow, and inoculated with 50 ng/gr body weight DT. Top shows the experimental design and a representative flow cytometry analysis of TdTomato expression by epidermal LCs 2 mo post-DT. Bottom shows the mean + SD of TdTomato expression (n = 4-7 mice in 3 exp.). m: months.
Fig. 3.
Fig. 3.
moLCs migrate from the skin to sLN. (AD) B6 Cd207DTR mice were inoculated or not with 50 ng/gr body weight DT. Two months later, Mig LCs were analyzed by CyTOF. (A) UMAP showing all myeloid cells in sLN (1 of 3 exp.). (B) eLCs (−DT; Top), and moLCs (+DT; Bottom) were overlaid into the UMAP of all sLN cells (1 of 3 exp.). (C) UMAPs showing the expression of selected markers (1 of 3 exp.; scale: ArcSinh). (D) Heatmap of the expression of each marker in each cell population (n = 3 mice in 3 exp.; scale: MSI). (E) CCR7 expression by flow cytometry (1 of 3 exp.). A representative flow cytometry plot (Right) and the mean fluorescence intensity (MFI) + SD (n = 3-4 mice in 3 exp.; Left). (F and G) B6 Cd207DTR CD45.2 mice were lethally irradiated and transplanted with 50% WT (CD45.1) and 50% Ccr7 cKO bone marrow (CD45.2), followed by 50 ng/gr body weight DT. (F) Representative flow cytometry plots are shown. (G) As in (F), but the frequency of cells expressing CD45.1 or CD45.2 (mean + SD; n = 9 mice in 2 exp.). (H) B6 Cd207DTR mice were treated or not with 50 ng/gr body weight of DT. Two months later, TRITC was applied onto the ears. In some cases, ears were excised 4 h after TRITC application. Auricular LN were collected 96 h later for flow cytometry analysis. Left shows representative plots. Right shows the frequency of TRITC+ cells (mean + SD; n = 3-4 mice in 2 exp.; two-way ANOVA with Fisher’s Least Significant Difference). Res: lymphoid-resident; MSI: Mean Signal Intensity.
Fig. 4.
Fig. 4.
moLCs have a superior migratory capacity than eLCs. (AD) B6 Cd207DTR mice were inoculated or not with 50 ng/gr body weight DT, and whole skin was analyzed by CyTOF after 2 mo (1 of 2 exp.) (A) Skin LCs were gated as in S1A, analyzed by X-shift, and represented using PHATE. (B) PHATE map colored by the expression of the indicated marker (scale: ArcSinh). (C) Overlay of eLCs (−DT) and moLCs (+DT) onto the PHATE map of (A). (D) Frequency of eLCs (−DT) and moLCs (+DT) falling within cluster 1 and cluster 2 of the PHATE map (n = 2-4 in 2 exp.). (E) As in (A), but the epidermis was analyzed by flow cytometry for the expression of CCR7 and CD86 expression on eLCs (−DT) and moLCs (+DT). Bottom, frequency of CCR7+ LCs shown as the mean + SD of n = 5-11 mice (3 exp.; Student’s t test). (FH) B6 CD45.2 Cd207DTR mice were lethally irradiated and transplanted with CD45.1 WT bone marrow, followed by inoculation of a low dose of 5 ng/gr body weight of DT. Tissues were collected 2 mo later. (F) Top, experimental design. Bottom, number of epidermal LCs (Left) and Mig LCs in sLN (Right) as mean + SD (n = 4-12 in 3 exp.; Student’s t test). (G) Top, expression of CD45.1 and CD45.2 by flow cytometry. Bottom, frequency of CD45.2 eLCs and CD45.1 moLCs in each tissue shown as individual mice (n = 12 mice in 3 exp.; one-way ANOVA with Tukey’s multiple comparison). (H) Microscopy analysis showing CD45.1 and CD45.2 expression in epidermal LCs (1 of 2 exp.). Left panel, epidermal sheet stitching (scale bar: 500 μm); Right panels, magnification of white squares (scale bar: 50 μm).
Fig. 5.
Fig. 5.
moLCs have a higher capacity to capture S. aureus through CD207. (AC) CD45.1 Cd207DTR mice were lethally irradiated and transplanted with CD45.2 WT bone marrow. Two months later, a low dose of 5 ng/gr body weight DT was inoculated. (A) Epidermal eLCs and moLCs were purified and analyzed by SMART-seq2 2 mo post-DT. Volcano plot showing differentially expressed genes between eLCs and moLCs (log2 fold change = 1; P-value < 0.05). (B) As in (A), but Violin plot showing Cd207 gene expression. (C) CD207 protein expression by flow cytometry. Left, representative histogram. Right, MFI expression (n = 9 mice in 3 exp.; Student’s paired t test). (D) Cd207DTR mice were inoculated or not with 50 ng/gr of body weight DT, and the epidermis was analyzed 2 mo later. CD207 expression on eLCs (−DT) and moLCs (+DT) shown as normalized MFI + SD (n = 8-12 mice in 3 exp.; Student’s t test). (E and F) Epidermis cell suspensions of WT B6 and Cd207−/− mice were incubated with pHrodo-labeled microbes. (E) Flow cytometry plots showing the uptake of S. aureus by epidermal LCs after 3 (Left) and 12 (Right) hours of culture. (F) Bar plots showing uptake as the mean + SD (n = 4-6 in 2 to 3 exp.; Student’s t test). (G and H) CD45.1 Cd207DTR mice were lethally irradiated and reconstituted with CD45.2 WT (1) or CD45.2 Cd207−/ (2) bone marrow. Two months later, a low dose of 5 ng/gr body weight DT was inoculated. Epidermis cell suspension was incubated with pHrodo S. aureus for 9 to 12 h. (G) Schematic of the experimental design. (H) S. aureus uptake in experimental setups (1) and (2), respectively. Representative flow cytometry plots (Left) and the bar graph of the mean + SD (n = 3-7 mice in 2 to 4 exp.; Student’s paired t test). (I) WT epidermis cell suspension was incubated with S. aureus for 9 to 12 h and then stained for migration markers. Top, flow cytometry plots in pHrodo and pHrodo+ LCs. Bottom, %CCR7+CD86+ and MFI of CCR7, CD86, and MHCII, shown as the mean + SD (n = 5 mice in 3 exp.; Student’s paired t test). (J) As in (G) but epidermal cell suspensions were analyzed by flow cytometry for CCR7 and CD86 expression after 6 to 9 h incubation with S. aureus (n = 4-7 in 3 to 4 exp.; Student’s paired t test).

References

    1. Okabe Y., Medzhitov R., Tissue biology perspective on macrophages. Nat. Immunol. 17, 9–17 (2016). - PubMed
    1. Blériot C., Chakarov S., Ginhoux F., Determinants of resident tissue macrophage identity and function. Immunity 52, 957–970 (2020). - PubMed
    1. Guilliams M., Thierry G. R., Bonnardel J., Bajenoff M., Establishment and maintenance of the macrophage niche. Immunity 52, 434–451 (2020). - PubMed
    1. Yona S., et al. , Fate mapping reveals origins and dynamics of monocytes and tissue macrophages under homeostasis. Immunity 38, 79–91 (2013). - PMC - PubMed
    1. Hashimoto D., et al. , Tissue-resident macrophages self-maintain locally throughout adult life with minimal contribution from circulating monocytes. Immunity 38, 792–804 (2013). - PMC - PubMed