. 2024 Nov 15;386(6723):eado9336.
doi: 10.1126/science.ado9336. Epub 2024 Nov 15.

Sequence modeling and design from molecular to genome scale with Evo

Affiliations

Sequence modeling and design from molecular to genome scale with Evo

Eric Nguyen et al. Science. .

Abstract

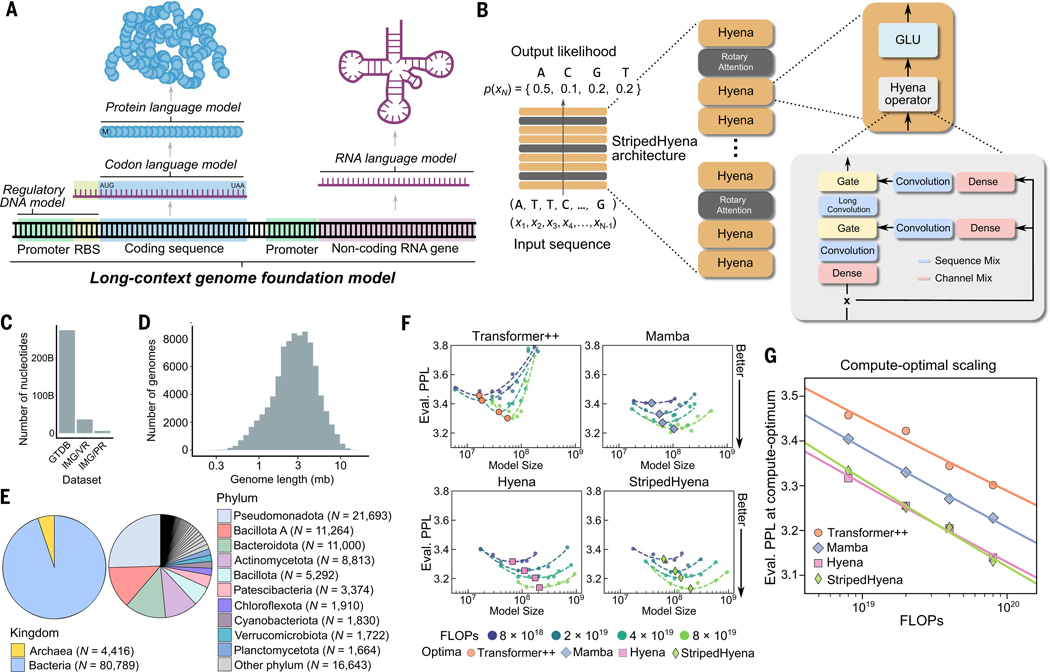
The genome is a sequence that encodes the DNA, RNA, and proteins that orchestrate an organism's function. We present Evo, a long-context genomic foundation model with a frontier architecture trained on millions of prokaryotic and phage genomes, and report scaling laws on DNA to complement observations in language and vision. Evo generalizes across DNA, RNA, and proteins, enabling zero-shot function prediction competitive with domain-specific language models and the generation of functional CRISPR-Cas and transposon systems, representing the first examples of protein-RNA and protein-DNA codesign with a language model. Evo also learns how small mutations affect whole-organism fitness and generates megabase-scale sequences with plausible genomic architecture. These prediction and generation capabilities span molecular to genomic scales of complexity, advancing our understanding and control of biology.


Conflict of interest statement

Competing interests: All other authors declare no competing interests.

Figures

Fig. 1.
Fig. 1.. Pretraining a genomic foundation model across prokaryotic life.
(A) A model of genome sequences at single-nucleotide resolution could learn all of the information encoded in regulatory DNA and in the sequences of the other modalities within the central dogma (proteins, coding RNA, and ncRNA). Even further, it could learn covariation involving multiple genes and regulatory elements. The status of DNA as the fundamental layer of biological information makes it a productive modality at which to develop a biological foundation model. (B)A model that predicts the likelihood of the next token given a sequence of tokens, referred to as autoregressive modeling, can learn complex patterns underlying DNA sequences. StripedHyena is a deep signal processing architecture for long sequences, obtained by hybridizing attention and hyena operators. GLU, gated linear units. (C) We pretrained Evo, a 7-billion-parameter model with the StripedHyena architecture, on bacterial genome sequences from GTDB and IMG/PR and viral sequences from IMG/VR, excluding sequences from viruses that infect eukaryotic hosts. (D) A histogram depicting the sequence length of the genomes in GTDB. mb, megabases. (E) Pie charts depicting the taxonomic makeup of GTDB based on the kingdom (left) and phylum (right). (F) Results from a first-of-its-kind scaling laws analysis for large-scale DNA pretraining. Models improve monotonically with scale, with significant differences between architectures. Eval. PPL, evaluation perplexity. (G) To determine optimal architecture and scaling for Evo, we compared scaling rates of different models pretrained on the compute-optimal frontier, i.e., with optimal allocation of compute between dataset size and model size.
Fig. 2.
Fig. 2.. Evo learns function across proteins, ncRNAs, and regulatory DNA.
(A) We obtained DMS datasets in which many mutations are made to a protein and a corresponding fitness score is experimentally measured for each protein variant. On the same set of mutated sequences, we compute its likelihood (or pseudolikelihood) under a protein language model or a nucleotide language model (LM). We then correlated these likelihoods with the experimental fitness measurements and used the strength of the correlation to measure the performance of zero-shot function prediction. (B) Correlation between zero-shot language model likelihoods or pseudolikelihoods and experimental fitness across nine prokaryotic protein DMS datasets. Bar height indicates the mean; each dot indicates a different DMS study. Nucl. Trans., Nucleotide Transformer. (C) We obtained datasets in which many mutations are made to a ncRNA and a corresponding fitness score is experimentally measured. Predictive performance is measured as in the method described in (A). (D) Correlation between zero-shot language model likelihoods or pseudolikelihoods and experimental fitness across seven ncRNA DMS datasets. Bar height indicates the mean; each dot indicates a different DMS study. (E) We obtained datasets in which many regulatory DNA sequences were measured for their effect on mRNA or protein expression. (F) Correlation between promoter activity across four studies and zero-shot language model likelihoods, sequence GC content, or supervised models. The supervised models include ridge regression or a CNN trained on one-hot embeddings or Evo embeddings, as well as a state-of-the-art supervised biophysical model of promoter activity, Promoter Calculator (52). Supervised models are evaluated in an out-of-domain prediction setting (Materials and methods). Ridge reg., ridge regression. Bar height indicates the mean; each dot indicates a different promoter activity study. (G) We obtaineda dataset in which Kosuri et al. (56) measured protein expression of a gene downstream of ~12,000 promoter-RBS pairs in E. coli. When provided with both the promoter and RBS sequences, Evo has higher predictive performance of protein expression compared with zero-shot sequence statistics or a method trained with some supervision to predict protein expression data from mRNA sequence.
Fig. 3.
Fig. 3.. Fine-tuning on CRISPR-Cas sequences enables generative design of protein-RNA complexes.
(A) Design task: Generating sequences encoding CRISPR-Cas defense complexes composed of protein and ncRNA components. (B) Fine-tuning Evo on 8-kb-length genomic sequences containing CRISPR-Cas systems after its initial 8k pretraining phase. Special conditioning tokens (“cas9,” “cas12,” or “cas13”) prepended to the beginning of each sequence during fine-tuning. (C) When prompting with the token for a given type of Cas protein, the most common Cas protein found in the resulting generated sequences corresponds to that token prompt (Materials and methods). (D) Histograms representing the distribution of percentage identity of a generated Cas protein sequence to any Cas protein sequence in the training dataset. Samples from a model trained only on CRISPR-Cas sequences (top) and samples from a model fine-tuned on CRISPR-Cas off the base Evo model (bottom). Both models were trained on CRISPR-Cas sequences using the same hyperparameters. (E) Annotated core protein-coding genes and ncRNA components found in type II CRISPR systems in the EvoCas9–1 locus as determined by pHMMs and CRISPR ncRNA prediction algorithms. (F) Time course results for SpCas9 and EvoCas9–1 cleavage reactions after incubation with cognate sgRNAs and 1 nM DNA target at a 10:10:1 molar ratio of Cas9:sgRNA:target. Nontargeting guide RNA used to verify in vitro cleavage specificity. (G) Predicted secondary structure of the sgRNA from the EvoCas9–1 generation. Secondary structure differences between the EvoCas9–1 sgRNA and the SpCas9 sgRNA are highlighted in red. (H) AlphaFold3 (AF3) structure prediction of EvoCas9–1 aligned to the crystal structure of SpCas9 (PDB: 4OO8). (I) AlphaFold3 (AF3) structure prediction of the EvoCas9–1 sgRNA aligned to the crystal structure (PDB: 4OO8) of the SpCas9 sgRNA (79 nt scaffold + 20 nt spacer). nt, nucleotide. (J) AlphaFold3 (AF3) structure prediction of EvoCas9–1 in complex with its codesigned sgRNA (81 nt scaffold + 20 nt spacer).
Fig. 4.
Fig. 4.. Fine-tuning on IS200/IS605 sequences enables generative design of transposable biological systems.
(A) IS200 and IS605 MGEs contain a TnpA transposase and are flanked by left and right end terminal hairpins that interact with the TnpA to accomplish transposition. IS605 MGEs additionally encode a TnpB-ωRNA complex that performs DNA cleavage. Our design task is to produce sequences that contain these DNA, ncRNA, and protein components. (B) We fine-tuned Evo, after its initial 8k pretraining phase, on natural sequences containing IS200/IS605 systems. (C) Histograms representing the distribution of the percentage identity of Evo-generated TnpA and TnpB proteins to their best match in the fine-tuning set of natural TnpA and TnpB proteins. (D) Schematic of the in vitro assay for evaluating designed TnpA activity on codesigned DNA ends. Excision will produce a band corresponding to the formation of the RE-LE junction in the resulting circular product, and (re-)insertion will produce a band from the joining of two ssDNA substrates, both detectable by a single PCR. (E) Schematic of the Evo-generated IS200-like system, ISEvo1, containing element annotations and its relevant DNA and protein features. (F) A 2% agarose gel with SYBR Gold showing that ISEvo1 TnpA functions in vitro on ssDNA substrates, requiring the catalytically active tyrosine (Y124) and with substantially reduced activity on dsDNA substrates. (G) Example reads from nanopore sequencing of PCR products from the ISEvo1 TnpA in vitro assay. (H) Schematic of the Evo-generated IS605-like system, ISEvo2, containing element annotations and its relevant DNA, RNA, and protein features. (I) A 2% agarose gel with SYBR Gold showing that ISEvo2 TnpA functions in vitro on ssDNA substrates, requiring the catalytically active tyrosine (Y125) and with substantially reduced activity on dsDNA substrates. (J) Example reads from nanopore sequencing of PCR products from the ISEvo2 TnpA in vitro assay.
Fig. 5.
Fig. 5.. Evo learns mutational effects on organismal fitness across diverse bacterial and phage genomes.
(A) For genome-scale prediction and generation tasks, we first pretrained Evo on sequences with 8192 tokens and then extended its context window size in a second pretraining phase to sequences of 131,072 tokens. (B) We performed an in silico, genome-wide mutagenesis screen in which we introduced premature stop codons at each coding sequence in a genome. We computed the language model (LM) likelihood of the mutated gene sequence plus some amount of additional genomic context (up to 66 kb). We then took the ratio of this likelihood to the likelihood of the unmutated sequence. We tested whether these likelihood ratios would be predictive of gene essentiality. (C) Violin and strip plots of the distribution of the strength of gene essentiality prediction across 58 studies (each dot corresponds to a different study), in which each study conducted a genome-wide essentiality screen in a bacterial (N = 56) or phage (N = 2) species. We measured predictive performance as the AUROC in which the LM likelihood ratio is used to predict a binary label of “essential” or “nonessential.” “Gene-only context” indicates that the model is provided with only the gene sequence and no additional flanking genomic context. “8k context” and “66k context” indicate that the LM is provided with the gene sequence and flanking genomic context up to a total of 8192 or 65,536 tokens, respectively. Evo has some predictive performance with gene-only context, has vastly improved performance from gene-only to 8k context, and some outlier improvements from 8k to 66k context. (D) Histograms representing the distributions of the log of the likelihood ratios (“Evo score”) for the essential genes (blue) and the nonessential genes (yellow) in two genomes: lambda phage (top) and P. aeruginosa (bottom). These results are based on providing Evo with 66k context.
Fig. 6.
Fig. 6.. Evo generates megabase-scale sequences with plausible genomic architecture.
(A) We prompted Evo with species-level tokens used during the second pretraining stage. We use bacterial species prompts and generate sequences of ~650 kb in length. (B) Histograms depicting the distribution of coding density scores among 131-kb crops of sequences generated by Evo (“Evo generated”), sequences from natural bacteria (“natural genomes”), or sequences in which the four base pairs were sampled uniformly at random (“random sequences”). (C) Arrow plots depicting the organization of coding sequences on an example 131-kb sequence generated by Evo, derived from a natural genome, or sampled randomly. Coding sequences are depicted as arrows in which the horizontal length of the arrow corresponds to the genomic interval and the direction of the arrow indicates the strand. The top and bottom rows of arrows indicate the 5′-to-3′ and 3′-to-5′ strands, respectively, and the Evo-generated sequence was designated as the 5′-to-3′ strand. Both Evo-generated and natural genomes exhibit operon-like structure in which clusters of colocated genes are on the same strand. (D and E) An ~1-Mb generated sequence is represented as an arrow plot, as in (C). Below this arrow plot are ESMFold structure predictions of all protein coding sequences from 100 through 1024 amino acids in length, as identified by Prodigal. Structure predictions are aligned to natural proteins, which are then mapped to associated GO molecular function terms (Materials and methods). The largest GO categories are displayed as clusters alongside a large cluster containing all other proteins. ATP, adenosine triphosphate. (F) Log2 of TUDs of Evo-generated versus natural genomes for each species prompt. Statistics are the Pearson correlation coefficient test. Shaded regions indicate a 95% confidence interval. (G) Hierarchical clustering of Evo-generated and natural genomes based on Euclidean distances of the TUDs. (H) Percent usage of each stop codon in all three reading frames of Evo-generated, natural, and random ORFs.

Comment in

  • Learning the language of DNA.
    Theodoris CV. Theodoris CV. Science. 2024 Nov 15;386(6723):729-730. doi: 10.1126/science.adt3007. Epub 2024 Nov 14. Science. 2024. PMID: 39541478

References

    1. Morgan TH, Sex limited inheritance in Drosophila. Science 32, 120–122 (1910). doi: 10.1126/science.32.812.120 - DOI - PubMed
    1. Watson JD, Crick FHC, Molecular structure of nucleic acids: A structure for deoxyribose nucleic acid. Nature 171, 737–738 (1953). doi: 10.1038/171737a0 - DOI - PubMed
    1. Nirenberg MW, Matthaei JH, The dependence of cell-free protein synthesis in E. coli upon naturally occurring or synthetic polyribonucleotides. Proc. Natl. Acad. Sci. U.S.A. 47, 1588–1602 (1961). doi: 10.1073/pnas.47.10.1588 - DOI - PMC - PubMed
    1. Dobzhansky T, Genetics and the Origin of Species (Columbia Univ. Press, 1951).
    1. Jumper J. et al., Highly accurate protein structure prediction with AlphaFold. Nature 596, 583–589 (2021). doi: 10.1038/s41586-021-03819-2 - DOI - PMC - PubMed

Publication types

LinkOut - more resources