. 2024 Nov 15;386(6723):802-810.
doi: 10.1126/science.adl0666. Epub 2024 Nov 14.

Isolation of psychedelic-responsive neurons underlying anxiolytic behavioral states

Affiliations

Isolation of psychedelic-responsive neurons underlying anxiolytic behavioral states

J Muir et al. Science. .

Abstract

Psychedelics hold promise as alternate treatments for neuropsychiatric disorders. However, the neural mechanisms by which they drive adaptive behavioral effects remain unclear. We isolated the specific neurons modulated by a psychedelic to determine their role in driving behavior. Using a light- and calcium-dependent activity integrator, we genetically tagged psychedelic-responsive neurons in the medial prefrontal cortex (mPFC) of mice. Single-nucleus RNA sequencing revealed that the psychedelic drove network-level activation of multiple cell types beyond just those expressing 5-hydroxytryptamine 2A receptors. We labeled psychedelic-responsive mPFC neurons with an excitatory channelrhodopsin to enable their targeted manipulation. We found that reactivation of these cells recapitulated the anxiolytic effects of the psychedelic without driving its hallucinogenic-like effects. These findings reveal essential insight into the cell-type-specific mechanisms underlying psychedelic-induced behavioral states.


Conflict of interest statement

Competing interests: DEO is a co-founder of Delix Therapeutics, Inc. and serves as the chief innovation officer and head of the scientific advisory board. All other authors declare no other competing interests.

Figures

Fig. 1.
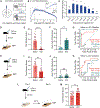
Fig. 1.. DOI can reduce anxiety-like behaviors beyond its hallucinogenic effects.
(A) Schematic of psychLight2 fluorescent sensor and AAV-hSyn::psychLight2 injection location in the mPFC of mice. (B) PsychLight2 fluorescence signal measured over the course of 4 hours after a 6 mg/kg DOI injection (n = 6 mice). (C) Mean binned psychLight2 fluorescence signal from panel (B), normalized by subtracting the baseline signal before DOI injection. (D) Schematic of MBT behavioral paradigm performed 30 minutes after DOI injection. (E) Total number of marbles buried during the MBT for mice injected with either saline or DOI (n = 20 mice per group). (F) Number of HTRs during the first 10 minutes of the MBT (n = 8 mice per group). (G) ROC curves for classifiers predicting saline versus DOI treatment, modeled using either the number of marbles buried (“Marble Model”) or the number of head twitches (“HTR Model”) (n = 8 mice per classifier, 8-fold cross-validation). Solid dots represent the model operating point. (H) Schematic of MBT behavioral paradigm performed 6 hours after DOI injection. (I) Total number of marbles buried during the MBT for mice injected with either saline or DOI (n = 12 mice per group). (J) Number of head twitch responses during the first 10 minutes of the MBT (n = 10 to 11 mice per group). (K) ROC curves for classifiers predicting saline versus DOI treatment, as in panel (G) (n = 10 to 11 mice per classifier). (L) Schematic of MBT behavioral paradigm performed in mice from panels (D)-(G), but 24 hours later. (M) Total number of marbles buried during the MBT for mice injected with either saline or DOI (n = 20 mice per group). Data are plotted as mean ± SEM. P values were calculated using a One-way repeated measures ANOVA with Dunnett’s multiple comparisons test in panel (C), and an unpaired Student’s t-test in panels (E), (F), (I), (J), and (M). *P < 0.05, **P < 0.01, ***P < 0.001, ****P < 0.0001; ns, not significant.
Fig. 2.
Fig. 2.. Recording and tagging DOI-activated neuronal ensembles in vivo.
(A) Experimental timeline. Mice were injected with AAV-CaMK2a::GCaMP6f in mPFC, and a GRIN lens was implanted above to allow for single-cell 2-photon calcium imaging. (B) Example mean GCaMP6f image and (C) cell masks from a single FOV identified using Suite2P. Scale bar, 140 μm. (D) Histology image showing viral expression and GRIN lens placement above mPFC. (E) Representative calcium fluorescence traces from DOI-activated, DOI-inhibited, and neutral (unchanged) neurons (see “Materials and Methods” for classification details). Pie chart shows percentage of neurons belonging to each group (n = 361 neurons pooled from 3 mice). (F) Data from pie chart in panel (E), averaged for each biological replicate (n = 3 mice). (G) Mean normalized fluorescence of DOI-activated cells during the saline period, 0–10 min after DOI injection, and 30–40 min after DOI injection (n = 2 mice). (H) Schematic of scFLARE2. The presence of both light and calcium triggers the release of the transcription factor, tTA, which translocates to the nucleus to drive the expression of the reporter gene, TRE::GFP. (I) Experimental timeline. Mice were injected with AAV-hSyn::scFLARE2 and AAV-TRE::GFP in mPFC, and a fiber-optic cannula was implanted above. Immediately after injection with DOI or saline, blue light was delivered to the mPFC to allow for scFLARE2 tagging and activity-dependent GFP expression. (J) Representative fluorescence images of scFLARE2 and GFP expression. Scale bar, 130 μm. (K) Quantification of the number of GFP+ cells/mm2 in mice treated with either saline or DOI (n = 4 slices from 2 mice per group). (L) Quantification of the number of scFLARE2+ cells/mm2 in mice treated with either saline or DOI (n = 4 slices per group). (M) GFP fluorescence as a function of scFLARE2 fluorescence for all scFLARE2+ cells. Dashed line indicates the GFP activation threshold, which is defined as the 95th percentile of GFP cell fluorescence in saline mice. Data are plotted as mean ± SEM. P values were calculated using a One-way repeated measures ANOVA with Tukey’s multiple comparisons test in panel (G), and an unpaired Student’s t-test in panels (K) and (L). **P<0.01, ****P < 0.0001; ns, not significant.
Fig. 3.
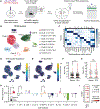
Fig. 3.. snRNA-seq of scFLARE2-tagged neurons reveals DOI-induced network activation.
(A) Experimental timeline. Mice were injected with AAV-hSyn::scFLARE2 and AAV-TRE::mCherry-p2a-bReaChES in the mPFC. 24 hours after scFLARE2 tagging, the mPFC was micro-dissected and dissociated into single nuclei. Nuclei were barcoded using a 3’ 10x library kit followed by Illumina next-gen sequencing. (B) UMAP visualization of individual nuclei corresponding to different neuronal cell-types. (C) Heatmap showing the expression of representative cell-type marker genes reported from prior mouse mPFC snRNA-seq datasets. (D-E) UMAP visualization of log1p normalized TRE-reporter and tTA expression in all nuclei across clusters. (F-G) Average log1p normalized TRE-reporter and tTA expression in all nuclei between saline and DOI treated animals. (H) Average unit variance scaled, log1p normalized TRE-reporter gene expression across nuclei within each cluster for saline- and DOI-treated animals (I) Dot plot representing the fraction of nuclei within each cluster that are mCherry+ (unit variance scaled, log1p normalized count > 0). P values in panels (F) and (G) were calculated using an unpaired Student’s t-test; ***P < 0.001, ns, not significant. Data in panel (H) are plotted as mean ± SEM, and FDR values were calculated following a 1-sided permutation test with 10,000 shuffles; *FDR < 0.05.
Fig. 4.
Fig. 4.. 5-HT2A/C receptor expression in scFLARE2-tagged neuronal clusters.
(A) UMAP visualization of log1p normalized Htr2a expression in all nuclei across clusters. (B) Average Z-scored, log1p normalized Htr2a expression of all nuclei within each cluster. (C) Dot plot representing the fraction of nuclei within each cluster that are Htr2a+ (log1p normalized count > 0). (D-F) Same as panels (A-C), except for Htr2c. Data are plotted as mean ± SEM. P values were calculated using a Wilcoxon Rank-sum test with Bonferroni correction testing in panel (B,E). *adjusted P <0.0001.
Fig. 5.
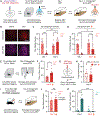
Fig. 5.. Reactivation of DOI-tagged neurons reduces anxiety-like behaviors without hallucinogenic side-effects.
(A) Experimental timeline. Mice were injected with AAV-hSyn::scFLARE2 and AAV-TRE::mCherry-p2a-bReaChES in mPFC. (B) Representative fluorescence images of scFLARE2 and mCherry-p2a-bReaChES expression. Scale bar, 130 μm. (C) Total number of marbles buried by control mice undergoing saline- or DOI-tagging, but not receiving orange light stimulation on day 2 (n = 13 to 14 mice per group). (D) Total number of marbles buried by mice receiving orange light stimulation of saline- or DOI-tagged neurons on day 2 (n = 13 to 14 mice per group). (E) Experimental timeline. Mice were prepared as in panel (A) and given blue light during DOI or saline injection. 24 hours later, they underwent an EPM assay. (F) Time spent in the open arms of the EPM by mice receiving orange light stimulation of saline- or DOI-tagged mPFC neurons on day 2 (n = 10 to 11 mice per group). (G) Mice were injected with AAV-hSyn::mCherry-p2a-bReaChES in the mPFC for non-specific stimulation and underwent an MBT assay on day 2. (H) Total number of marbles buried by mice receiving no light or orange light stimulation on day 2 (n = 10 mice per group). (I) Experimental timeline. Mice were prepared as in panel (A) but received a 5-HT2AR antagonist with either DOI or saline injection. 24 hours after tagging, mice were run through the MBT with orange light stimulation. (J) Total number of marbles buried by mice receiving orange light stimulation on day 2 (n = 7 to 8 mice per group). (K) Number of HTRs during the first 10 minutes of the MBT on day 1 after saline or DOI injection, or on day 2 during orange light stimulation of saline- or DOI-tagged mPFC neurons (n = 9 to 10 mice per group). Data are plotted as mean ± SEM. P values were calculated using a Two-way ANOVA with Tukey’s multiple comparisons test in panels (C), (D), and (K), and an unpaired Student’s t-test in panels (F), (H), and (J). *P < 0.05, ***P < 0.001, ****P < 0.0001; ns, not significant.

References

    1. Merikangas KR et al., Lifetime Prevalence of Mental Disorders in U.S. Adolescents: Results from the National Comorbidity Survey Replication-Adolescent Supplement (NCS-A). J Am Acad Child Psy 49, 980–989 (2010). - PMC - PubMed
    1. Burcusa SL, Iacono WG, Risk for Recurrence in Depression. Clin Psychol Rev 27, 959–985 (2007). - PMC - PubMed
    1. Roth BL, Gumpper RH, Psychedelics as Transformative Therapeutics. Am J Psychiatry 180, 340–347 (2023). - PubMed
    1. Vollenweider FX, Vollenweider-Scherpenhuyzen MF, Bäbler A, Vogel H, Hell D, Psilocybin induces schizophrenia-like psychosis in humans via a serotonin-2 agonist action. Neuroreport 9, 3897–3902 (1998). - PubMed
    1. Ly C et al., Psychedelics promote structural and functional neural plasticity. Cell reports 23, 3170–3182 (2018). - PMC - PubMed

Publication types

MeSH terms