. 2024 Nov 15;386(6723):eado4298.
doi: 10.1126/science.ado4298. Epub 2024 Nov 15.

SPL13 controls a root apical meristem phase change by triggering oriented cell divisions

Affiliations

SPL13 controls a root apical meristem phase change by triggering oriented cell divisions

Baojun Yang et al. Science. .

Abstract

Oriented cell divisions are crucial for determining the overall morphology and size of plants, but what controls the onset and duration of this process remains largely unknown. Here, we identified a small molecule that activates root apical meristem (RAM) expression of SQUAMOSA PROMOTER BINDING PROTEIN-LIKE13 (SPL13) a known player in the shoot's juvenile-to-adult transition. This expression leads to oriented cell divisions in the RAM through SHORT ROOT (SHR) and cell cycle regulators. We further show that the RAM has distinct juvenile and adult phases typed by morphological and molecular characteristics and that SPL factors are crucially required for this transition in Arabidopsis and rice (Oryza sativa). In summary, we provide molecular insights into the age-dependent morphological changes occurring in the RAM during phase change.


Conflict of interest statement

Competing interests: Part of this work is included in patent filings: EP 23160385.3 and EP 23160362.2

Figures

Fig. 1
Fig. 1. Chemical genetics screen for small molecules affecting cell division orientation.
(A) Overview of the screening procedure. (B) Overview of the dual color BY2 cell culture. Scale bar is 200 μm. (C-E) A BY2 filament undergoing oriented cell divisions in control conditions (DMSO). Scale bar is 50 μm. (F) Chemical structure of coral7. (G-I) Effect of coral7 treatment on cell division orientation. Scale bar is 50 μm. (J-K) Confocal images of root meristems of 5 DAG seedlings expressing p35S::FH6-GFP (green plasma membrane) and p35S::H2B-RFP (magenta nuclei) showing the effect of coral7 in cortex cells. Arrowheads: induced ectopic cell divisions. Scale bar is 25 μm. (L-M) Histochemical cross sections through the root meristem of 6 DAG seedlings grown on control medium (L) or 50 μM coral7 for 48 hours. Black asterisks: endodermis; red asterisks: additional ground tissue layer. Scale bar is 50 μm. (N) Quantification of the total cell numbers in L-M. (O-P) Histochemical cross sections through the root meristem of 6 DAG seedlings grown on control medium or 50 μM coral7 for 72 hours. Black asterisks: endodermis; red asterisks: additional ground tissue layer. Scale bar is 50 μm. (Q) Quantification of the vascular cell numbers in O-P.
Fig. 2
Fig. 2. Coral7 induces oriented cell divisions by triggering SPL13 expression.
(A) RNA-seq strategy. (B) Root meristem stained with propidium iodide showing the effect of SPL13 overexpression. Arrowheads: induced reoriented cell divisions. Scale bar is 25 μm. (C-E) GUS-stained 6 DAG root meristems grown on mock (C-D) medium, or 50 μM coral7 for 48 hours (E). Scale bar in (D) is 50 μm. (F-G) Sections of 10 DAG root meristems grown on control medium. Scale bar is 100 μm. (H) Quantification of the cell numbers in (F-G) (n = 12 for each). (I-J) 8 DAG root meristems stained with propidium iodide (yellow). Scale bar is 25 μm. (K-L) 10 DAG root meristems counterstained using propidium iodide. Arrowheads: end of the meristem. Scale bar is 75 μm. (M) Quantification of the cell numbers in longitudinal cortex cell files in the root meristem (K-L). (N) Quantification of the primary root length in 4 independent pRPS5A::SPL13-GFP lines compared to the Col-0 control. (O) Relative expression levels of SPL13 transcripts (n = 3 technical replicates for each genotype). (P) Lateral root density in the indicated genotypes (n = 10 for each genotype). Black asterisks in (D) and (F-G): endodermis; red asterisks: additional ground tissue layer.
Fig. 3
Fig. 3. SPL transcription factors control the transition from a juvenile to an adult state of the primary root meristem.
(A-E) Histochemical cross sections through the root meristem of seedlings grown on control medium for 5 days for the indicated genotypes. Scale bar is 25 μm. (F) Quantification of the total cell numbers in (A-E). (G-J) Expression of pSPL13::sSPL13-GUS in root meristems grown on mock medium for the indicated time. Arrowheads indicate the first visible expression. (K) Quantification of the meristem length in (G-J). (L) Quantification of the meristem width in (G-J). (M-Q) Histochemical cross sections of root meristems of Col-0 grown for the indicated time. Scale bar is 25 μm. (R-T) Quantification of the number of cortex (R), middle cortex (S) and total (T) cell numbers from cross section in Col-0 control plants grown from 5 to 40 DAG (see also Fig. S22). (U) Quantification of the total cell numbers in (V-Z). (V-Z) Histochemical cross sections through the root meristem of seedlings grown on control medium for 20 days for the indicated genotypes. Black asterisks in (A-E), (M-Q) and (V-Z) indicate the endodermis; red asterisks middle cortex. Scale bar is 25 μm.
Fig. 4
Fig. 4. Pathways acting downstream of SPL13.
(A-B) Confocal images of 6 DAG root meristems expressing pCYCB1;1::nGFP (green nuclei) and counterstained with propidium iodide (magenta). (C-E) Light microscopy images of root meristems expressing pCYCD6;1::GUS-GFP, grown for the indicated time. Scale bars are 50 μm. (F-I) Histochemical cross sections through the root meristem of seedlings, grown for 20 days for the indicated genotypes. Black asterisks indicate the endodermis; red asterisks indicate the middle cortex cells. Note that since shr-2 mutant has a single ground tissue layer with cortical cell identity we mark it here with a blue asterisk. Scale bar is 20 μm. (J) quantification of the number of cells in (F-I) for indicated genotypes. (K) quantification of primary root length for indicated genotypes.
Fig. 5
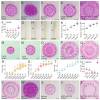
Fig. 5. SPL function in the root apical meristem is conserved in rice.
(A-J) Cross sections of rice root meristems of the control (ZH11), Osspl14 single, Osspl14 17 double, Osspl7 14 17 triple mutants and the OsmiR156 overexpression line grown for the indicated time and counterstained with calcofluor white (white). Scale bar is 100μm. (K) Quantification of the number of cortical cell files on a cross section in (A-J). (L) Quantification of the total number of cells in the cortex cell files in (A-J). (M) Quantification of the diameter of the meristem in (A-J). n = 10 for each genotype in (K-M).

Similar articles

References

    1. Sablowski R, Gutierrez C. Cycling in a crowd: Coordination of plant cell division, growth, and cell fate. The Plant Cell. 2021;34:193–208. doi: 10.1093/plcell/koab222. - DOI - PMC - PubMed
    1. Ohashi-Ito K, Fukuda H. Transcriptional networks regulating root vascular development. Curr Opin Plant Biol. 2020;57:118–123. - PubMed
    1. Ruonala R, Ko D, Helariutta Y. Genetic Networks in Plant Vascular Development. Annu Rev Genet. 2017;51:335–359. - PubMed
    1. De Rybel B, Mähönen AP, Helariutta Y, Weijers D. Plant vascular development: from early specification to differentiation. Nat Rev Mol Cell Biol. 2016;17:30–40. - PubMed
    1. Sun Y, Yang B, De Rybel B. Hormonal control of the molecular networks guiding vascular tissue development in the primary root meristem of Arabidopsis thaliana. J Exp Bot. 2023 doi: 10.1093/jxb/erad232. - DOI - PMC - PubMed

Publication types

LinkOut - more resources