. 2024 Nov 20;15(11):1092-1102.e2.
doi: 10.1016/j.cels.2024.10.006. Epub 2024 Nov 13.

Systematic analysis identifies a connection between spatial and genomic variations of chromatin states

Affiliations

Systematic analysis identifies a connection between spatial and genomic variations of chromatin states

Xuan Cao et al. Cell Syst. .

Abstract

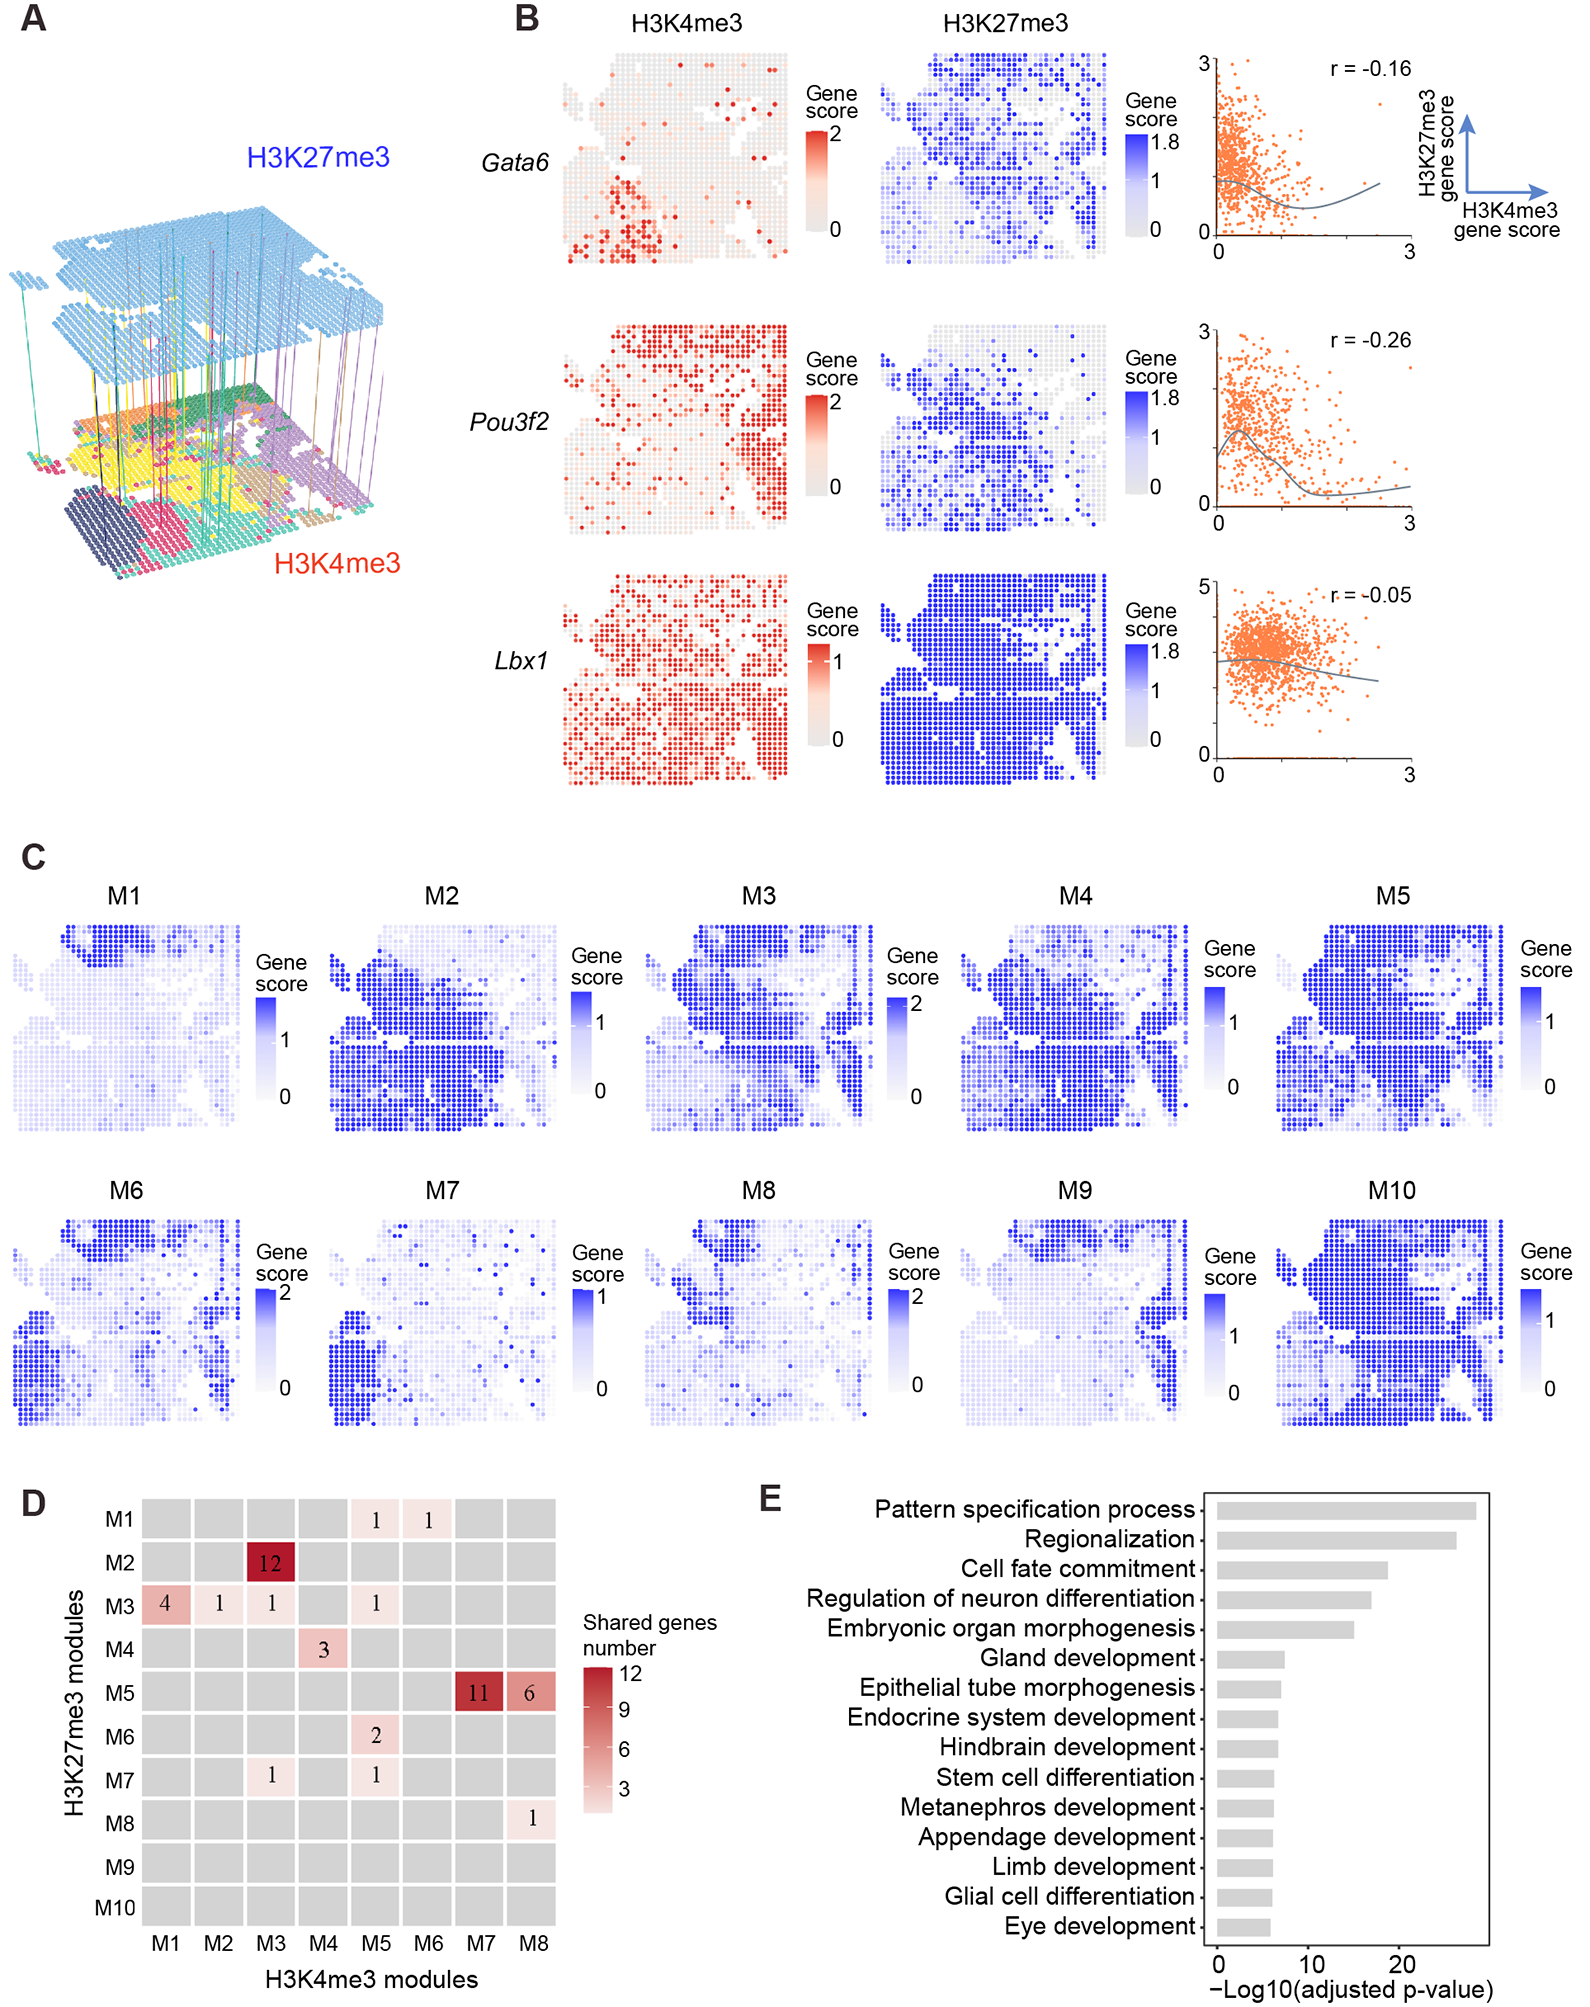
Chromatin states play important roles in the maintenance of cell identities, yet their spatial patterns remain poorly characterized at the organism scale. We developed a systematic approach to analyzing spatial epigenomic data and then applied it to a recently published spatial-CUT&Tag dataset that was obtained from a mouse embryo. We identified a set of spatial genes whose H3K4me3 patterns delineate tissue boundaries. These genes are enriched with tissue-specific transcription factors, and their corresponding genomic loci are marked by broad H3K4me3 domains. Integrative analysis with H3K27me3 profiles showed coordinated spatial transitions across tissue boundaries, which is marked by the continuous shortening of H3K4me3 domains and expansion of H3K27me3 domains. Motif-based analysis identified transcription factors whose activities change significantly during such transitions. Taken together, our systematic analyses reveal a strong connection between the genomic and spatial variations of chromatin states. A record of this paper's transparent peer review process is included in the supplemental information.

Keywords: CUT&Tag; chromatin state; computational biology; development; epigenomics; spatial biology.


Conflict of interest statement

Declaration of interests R.F. is a scientific founder and advisor of IsoPlexis, Singleron Biotechnologies, and AtlasXomics.

Figures

Figure 1.
Figure 1.. Identification of spatial genes and colocalization modules.
(A) The average spatial pattern for identified 8 distinct H3K4me3 colocalization modules (M1–M8). (B) The three most significantly enriched GO terms associated with each colocalization module. (C-D) Mapping colocalization modules to annotated clusters. (C) Using gene set enrichment analysis to quantify the degree of association between colocalization modules and clusters. The raw enrichment scores are converted to z-scores for comparison. (D) The discretized mapping between modules and clusters resulting from using z-score = 0.7 as the cutoff. (E) Clusters specific H3K4me3 signals of the top spatial genes in each colocalization module.
Figure 2.
Figure 2.. Broad H3K4me3 domains mark spatial genes.
(A) Genome browser tracks showing H3K4me3 raw and binarized signals along with the diHMM output: nucleosome- and domain-level chromatin state annotation at representative spatial genes (Pou2f2 and Gata6) and housekeeping genes (Actb and Copb2). (B) The distribution of domain width at the genomic loci of the spatial genes. (C-D) Comparisons of the H3K4me3 domain width (C) and height (D) between spatial genes, activate genes, and all genes (genome-wide) in each cluster. spatial genes in each cluster are identified from related modules as in 2B and 2E. Activate genes are genes that promoter regions occupancy by H3K4me3 domains excluding the spatial genes. ns (not significant) indicate p-value > 0.05 using Wilcoxon rank-sum test; *** indicate p-value ≤ 0.001; **** indicate p-value ≤ 0.0001. (E) Rank for enriched TF motifs in module M3 based on −log10(P value). P-value was calculated based on TF motif deviation scores using t-test. Top 5 significant motifs highlighted in red. (F) Spatial distribution of TF motifs deviation z-score for motifs highlighted in Figure 2E.
Figure 3.
Figure 3.. Integrated analysis of H3K4me3 and H3K27me3 data.
(A) A schematic view of our approach to align H3K4me3 and H3K27me3 data. (B) The relationship between H3K4me3 and H3K27me3 patterns. The spatial distribution of H3K4me3 (left) and H3K27me3 (middle) signals and color bar represent the gene score. Scatter plot (right) shows different patterns of correlation between H3K4me3 and H3K27me3 signals. r is the Pearson correlation coefficient; black lines are fitted curves by loess regression. (C) The average H3K27me3 gene scores of spatial genes for identified 10 distinct H3K27me3 colocalization modules (M1–M10). (D) Confusion matrix comparing spatial genes overlapping between H3K4me3 and H3K27me3. Tiles are colored and numbered according to the number of genes shared. Tiles colored in gray represent no genes being shared. (E) A gene ontology analysis was performed on top 200 spatial genes based on H3K27me3.
Figure 4.
Figure 4.. Spatial transition of chromatin states across tissues (using heart as a representative example)
(A) A schematic illustration of the spatial pseudo distance between a source (red circle) and target (blue triangle) spot. It incorporates both physical distance (Sij) and chromatin state similarity (Dij). (B) The spatial distribution of the spatial pseudo distance to the center of the heart. (C) Genome browser tracks showing H3K4me3 signal at Gata6 in each equidistance group from the heart center. (D) The H3K4me3 domain width corresponds to each equidistance group. (E) Similar to (C) but for H3K27me3. (F) Similar to (D) but for H3K27me3. (G) The distribution of domain width for all spatial genes in the H3K4me3 module M1. (H) Similar to (G) but for H3K27me3. (I) The distribution of motif deviation z-score averaged on H3K4me3 for top 5 enriched motifs identified from H3K4me3 module M1 (related to heart; shown in Figure S3A) corresponds to each equidistance group. (J) Similar to (I) but for H3K27me3.

References

    1. Jenuwein T, and Allis CD (2001). Translating the histone code. Science 293, 1074–1080. - PubMed
    1. Kouzarides T (2007). Chromatin modifications and their function. Cell 128, 693–705. - PubMed
    1. Ren B, Robert F, Wyrick JJ, Aparicio O, Jennings EG, Simon I, Zeitlinger J, Schreiber J, Hannett N, Kanin E, et al. (2000). Genome-wide location and function of DNA binding proteins. Science 290, 2306–2309. - PubMed
    1. Barski A, Cuddapah S, Cui K, Roh T-Y, Schones DE, Wang Z, Wei G, Chepelev I, and Zhao K (2007). High-resolution profiling of histone methylations in the human genome. Cell 129, 823–837. - PubMed
    1. Mikkelsen TS, Ku M, Jaffe DB, Issac B, Lieberman E, Giannoukos G, Alvarez P, Brockman W, Kim T-K, Koche RP, et al. (2007). Genome-wide maps of chromatin state in pluripotent and lineage-committed cells. Nature 448, 553–560. - PMC - PubMed

LinkOut - more resources