. 2024 Nov 20;15(11):1002-1017.e4.
doi: 10.1016/j.cels.2024.10.007. Epub 2024 Nov 13.

Spatiotemporal dynamics during niche remodeling by super-colonizing microbiota in the mammalian gut

Affiliations

Spatiotemporal dynamics during niche remodeling by super-colonizing microbiota in the mammalian gut

Guillaume Urtecho et al. Cell Syst. .

Abstract

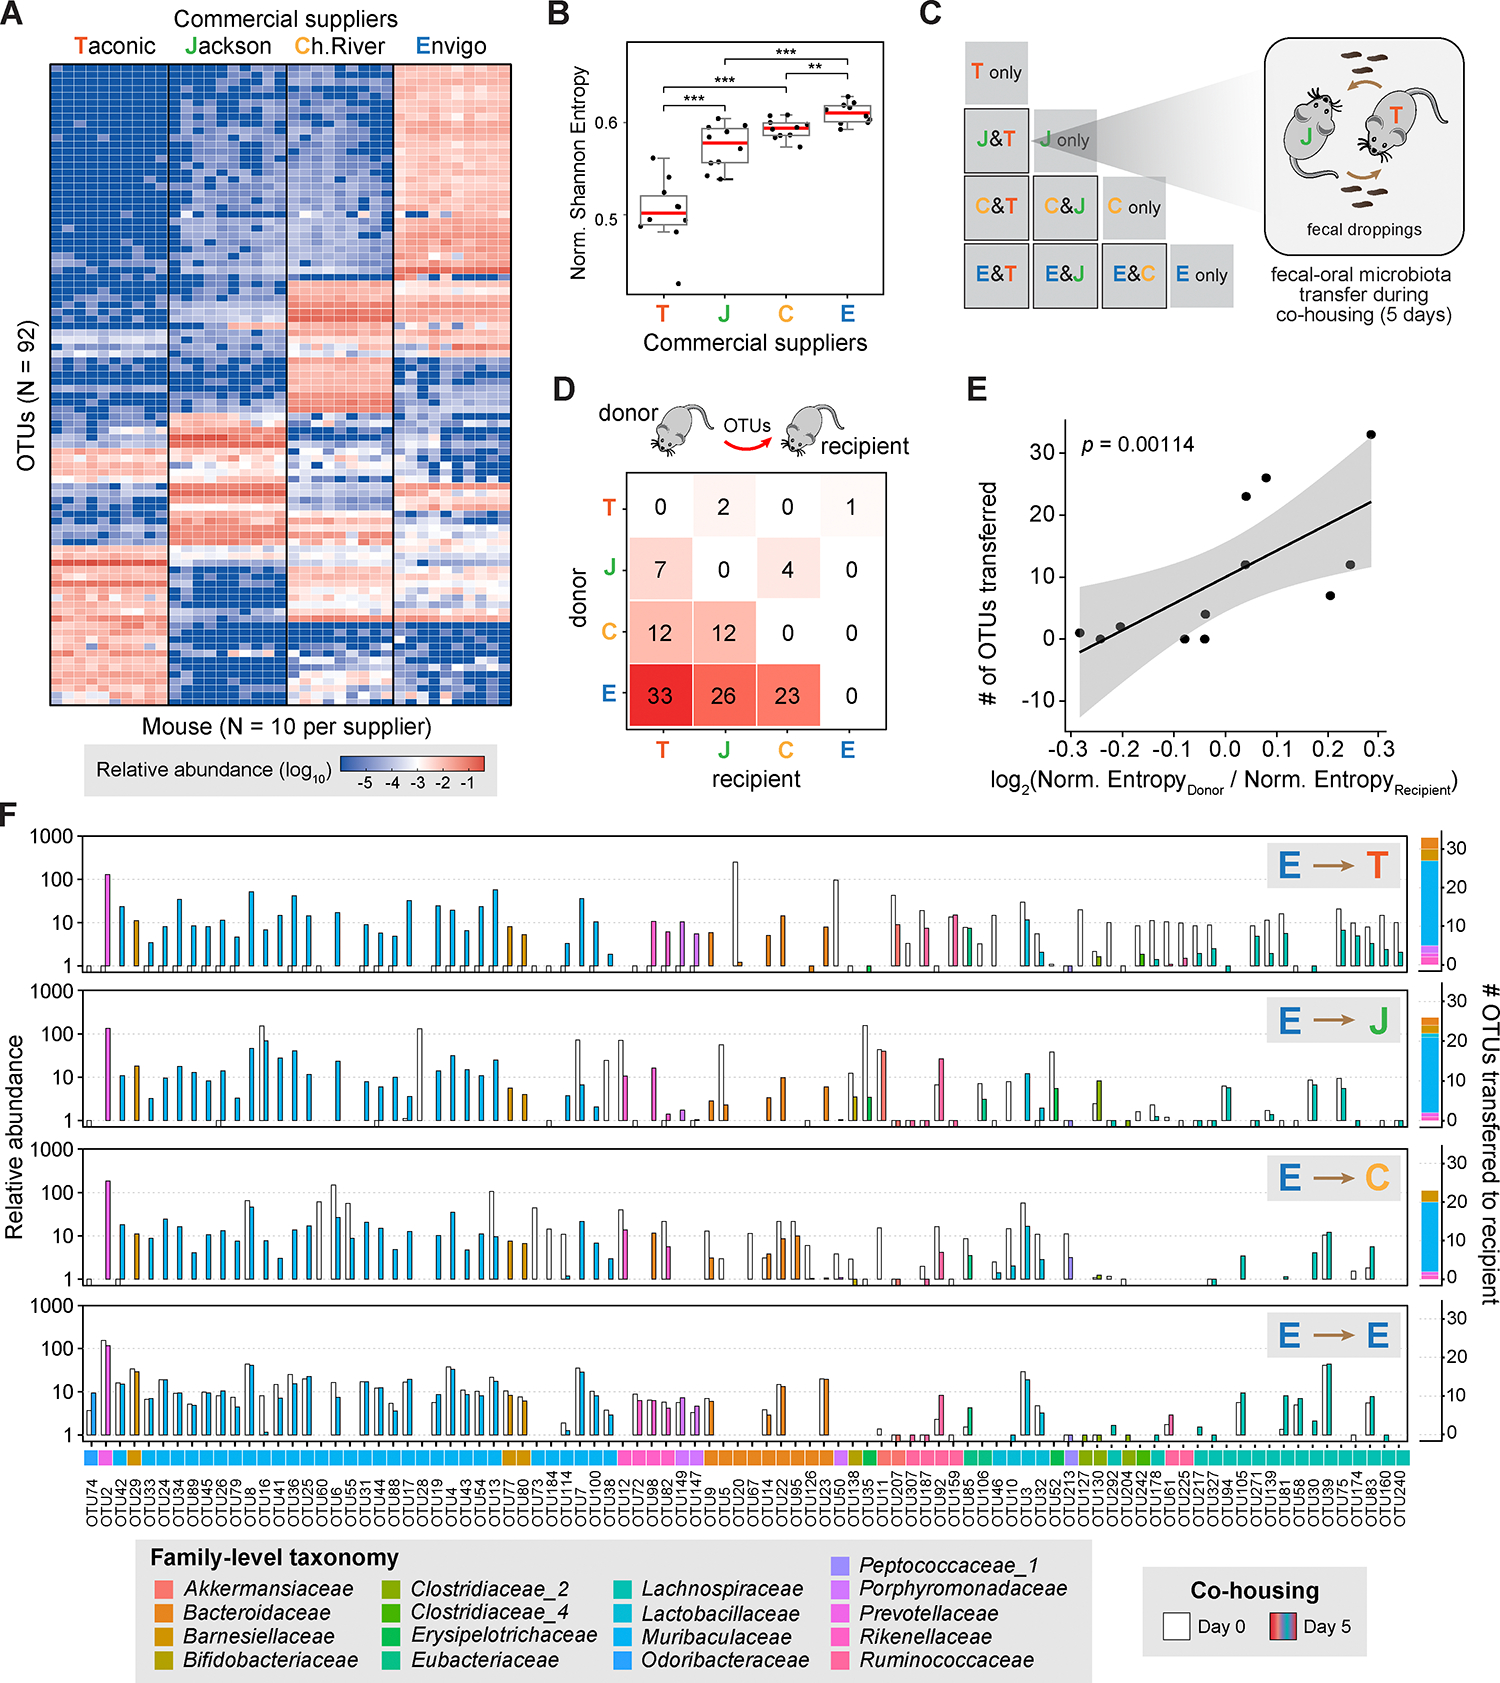
While fecal microbiota transplantation (FMT) has been shown to be effective in reversing gut dysbiosis, we lack an understanding of the fundamental processes underlying microbial engraftment in the mammalian gut. Here, we explored a murine gut colonization model leveraging natural inter-individual variations in gut microbiomes to elucidate the spatiotemporal dynamics of FMT. We identified a natural "super-donor" consortium that robustly engrafts into diverse recipients and resists reciprocal colonization. Temporal profiling of the gut microbiome showed an ordered succession of rapid engraftment by early colonizers within 72 h, followed by a slower emergence of late colonizers over 15-30 days. Moreover, engraftment was localized to distinct compartments of the gastrointestinal tract in a species-specific manner. Spatial metagenomic characterization suggested engraftment was mediated by simultaneous transfer of spatially co-localizing species from the super-donor consortia. These results offer a mechanism of super-donor colonization by which nutritional niches are expanded in a spatiotemporally dependent manner. A record of this paper's transparent peer review process is included in the supplemental information.

Keywords: FMT; fecal microbiota transplantation; gut microbiome; metabolic exchange; microbial ecology; microbial systems; spatial metagenomics; spatiotemporal dynamics; super-colonizers.


Conflict of interest statement

Declaration of interests H.H.W. is a scientific advisor of SNIPR Biome, Kingdom Supercultures, Fitbiomics, VecX Biomedicines, and Genus PLC and a scientific cofounder of Aclid and Foli Bio, all of whom are not involved in the study. R.U.S. is a cofounder of Kingdom Supercultures.

Figures

Figure 1.
Figure 1.. Diverse murine gut microbiomes exhibit variable outcomes to pairwise FMT
(A) Microbiome composition of C57BL/6 mice sourced from four vendors by 16S rRNA sequencing (N = 10 mice / vendor). (B) Shannon diversity index of mouse microbiomes (N = 10, Mann-Whitney U Test, *** = p < .001). (C) Pairwise fecal microbiota transfer (FMT) model by cohousing female C57BL/6 mice from different vendors. (D) Number of OTUs transferred between mice from different vendors (N = 2 per combination). (E) The number of OTUs transferred from donor to recipient correlates with the ratio of their normalized Shannon Entropies. (F) (left) Relative abundance of OTUs at Day 0 and Day 5 of cohousing with Envigo mice (N = 2 per combination). OTUs are ordered by Phylogenetic distance(right). Number and taxonomic identity of OTUs transferred from Envigo microbiome to various recipients.
Figure 2.
Figure 2.. The transfer of microbes by FMT occurs over short and long-time scales.
(A) Longitudinal 16S microbiome profiling of JaxEnv mice (N = 4). Detectable colonization by transferred OTUs occurs during both early (days 1–5) and late (days 15–32) sampling points. Representative Envigo microbiome is an average of day 1 Env-Env cohoused mice (N = 4). (B) Number of Env OTUs transferred and Jax OTUs remaining over longitudinal sampling. (C) Number of OTUs detected over time within each mouse cohort. We observed a significant increase in the number of OTUs present within JaxEnv mice compared to JaxWT after 32 days of cohousing (Mann-Whitney U Test p = 0.029, N = 4). (D) Changes in bacterial biomass within feces of JaxEnv and EnvJax mice. Biomass is colored by whether OTUs are uniquely found in microbiomes of Envigo donors (Donor specific), uniquely found in Jackson Recipients (Recipient specific), or observed in both. Values normalized to Day 0 of cohousing ( * = p < 0.05, one-sided Mann-Whitney U Test).
Figure 3.
Figure 3.. Microbial transplantation dynamics vary across murine gut compartments.
(A) 16S profiling of luminal contents of mice cohorts after 32 days of cohousing. Rows are arranged by hierarchical clustering (Euclidean distance, Complete Linkage) of cohoused Jackson cohort (N = 4). (B) Quantification of absolute bacterial biomass gained (left) and displaced (right) across all gut compartments stratified by taxonomic identity. Values are presented as relative to total JaxWT biomass. (C) Absolute bacterial biomass in all gut compartments across mouse cohorts (N = 4). (D) Proportion of bacterial biomass in each gut compartment uniquely found in Envigo donors (Env specific), uniquely found in Jackson Recipients (Jax specific), or observed in both. (E) Absolute abundance of select OTUs across gut compartments in JaxWT and JaxEnv mouse cohorts.
Figure 4.
Figure 4.. FMT results in dramatic restructuring of microbial spatial co-localizations.
A-B) Co-association map indicating significant spatial co-associations amongst native OTUs unique to A) Env and B) JaxWT mice (N = 4 per group). FMT outcomes determined by differential analysis comparing abundances in JaxWT and JaxEnv mice. Rows and columns are clustered using Ward’s Linkage. C) Co-association map indicating significant spatial co-associations within the JaxEnv microbiota. OTUs are indicated depending on if they are uniquely found in Env, uniquely found in Jax, or shared. D) Sankey diagram indicating the transfer of OTUs from Jax/Env spatial subgroups to JaxEnv subgroups. E) Correlation between the number of observed spatial-associations in the Env microbiome and engraftment in JaxEnv across Env-enriched OTUs. Engraftment Efficiency indicates the log2 fold change in abundance comparing JaxWT and JaxEnv mice. F) Number of interactions found amongst Env microbes separated by whether they were depleted, unchanged, or enriched in JaxEnv following cohousing (Mann-Whitney U Test).
Figure 5.
Figure 5.. Envigo microbiota possess efficient metabolisms and unique glycoside hydrolases to metabolize diverse carbohydrate substrates.
(A) MAG size comparison between Muribaculaceae and Bacteroidaceae taxa from Jackson (J), Taconic (T), Envigo (E), and Charles River (C) (Mann-Whitney U test, p = 0.044). (B) Metabolic in dependence score comparison between Muribaculaceae and Bacteroidaceae taxa from different vendors (Mann-Whitney U Test, p = 5.92 × 10⁻⁴). (C) Growth Rates of all Env, Jax, and JaxEnv OTUs simulated under High Fiber and Western Diet (Student’s T-Test, Jax vs JaxEnv, High Fiber: p = 3.40 × 10⁻³, Western: p = 2.34 × 10⁻³). (D) Abundance of glycoside hydrolase genes within Muribaculaceae MAGs from each vendor. (E) OD600 Growth assays of fecal communities acquired from JaxWT, EnvWT, and JaxEnv mice after five days of cohousing. Communities were inoculated in defined minimal media supplemented with single sources of carbohydrates (indicated). Number of MAGs characterized in Figures A through C: J, N = 7; T, N = 21, E, N = 38; C, N = 9.
Figure 6.
Figure 6.. Humanized mouse microbiomes simulate human FMT outcomes.
(A) Pairwise fecal microbiota (FMT) transfer model of gnotobiotic female C57BL/6 mice harboring ‘humanized’ microbiomes from individuals spanning the three canonical enterotypes. (B) 16S profiling of mouse fecal communities following nine days of cohousing separated by pairs (N = 2 per pair). Clusters 1 & 2 indicate observed microbial transfer events. Rows arranged by hierarchical clustering. (C) PCA of euclidean distance in OTU composition comparing humanized mice before and after cohousing. The primary label indicates the original mouse microbiome and superscript indicates the cohousing partner. (D) Taxonomic composition of transferred OTUs between C57BL/6 mice harboring ‘humanized’ microbiomes. The number in the top left indicates the total number of OTUs transferred. OTU color scheme matches (B).

References

    1. Lynch SV, Pedersen O. The Human Intestinal Microbiome in Health and Disease. N Engl J Med. 2016. Dec 15;375(24):2369–79. - PubMed
    1. Chiu L, Bazin T, Truchetet ME, Schaeverbeke T, Delhaes L, Pradeu T. Protective Microbiota: From Localized to Long-Reaching Co-Immunity. Front Immunol [Internet]. 2017. [cited 2022 Oct 21];0. Available from: 10.3389/fimmu.2017.01678 - DOI - PMC - PubMed
    1. Martin AM, Sun EW, Rogers GB, Keating DJ. The Influence of the Gut Microbiome on Host Metabolism Through the Regulation of Gut Hormone Release. Front Physiol [Internet]. 2019. [cited 2022 Oct 21];0. Available from: 10.3389/fphys.2019.00428 - DOI - PMC - PubMed
    1. Donaldson GP, Lee SM, Mazmanian SK. Gut biogeography of the bacterial microbiota. Nat Rev Microbiol. 2016. Jan;14(1):20–32. - PMC - PubMed
    1. Wernroth ML, Peura S, Hedman AM, Hetty S, Vicenzi S, Kennedy B, et al. Development of gut microbiota during the first 2 years of life. Sci Rep. 2022. May 31;12(1):9080. - PMC - PubMed