. 2024 Dec;300(12):107984.
doi: 10.1016/j.jbc.2024.107984. Epub 2024 Nov 13.

The methyltransferase MLL4 promotes nonalcoholic steatohepatitis by enhancing NF-κB signaling

Affiliations

The methyltransferase MLL4 promotes nonalcoholic steatohepatitis by enhancing NF-κB signaling

Junekyoung Lee et al. J Biol Chem. 2024 Dec.

Abstract

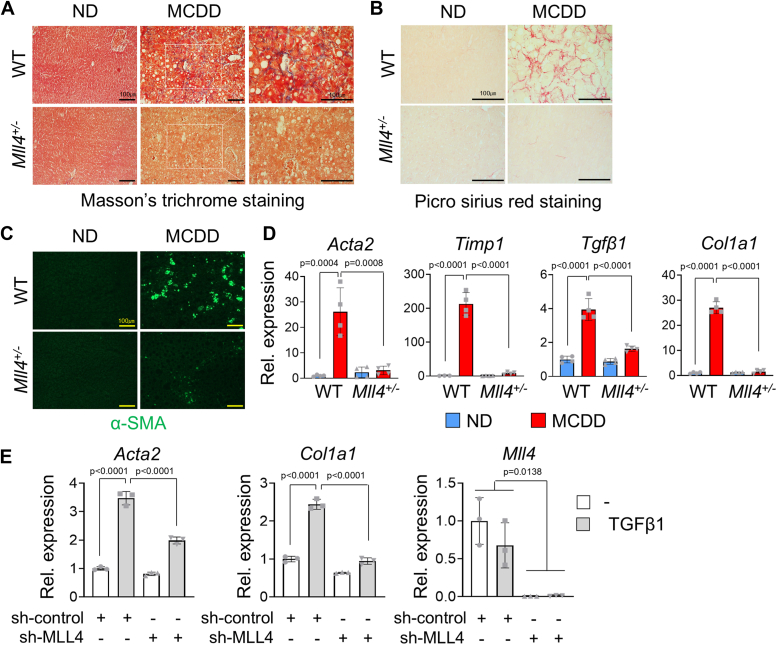
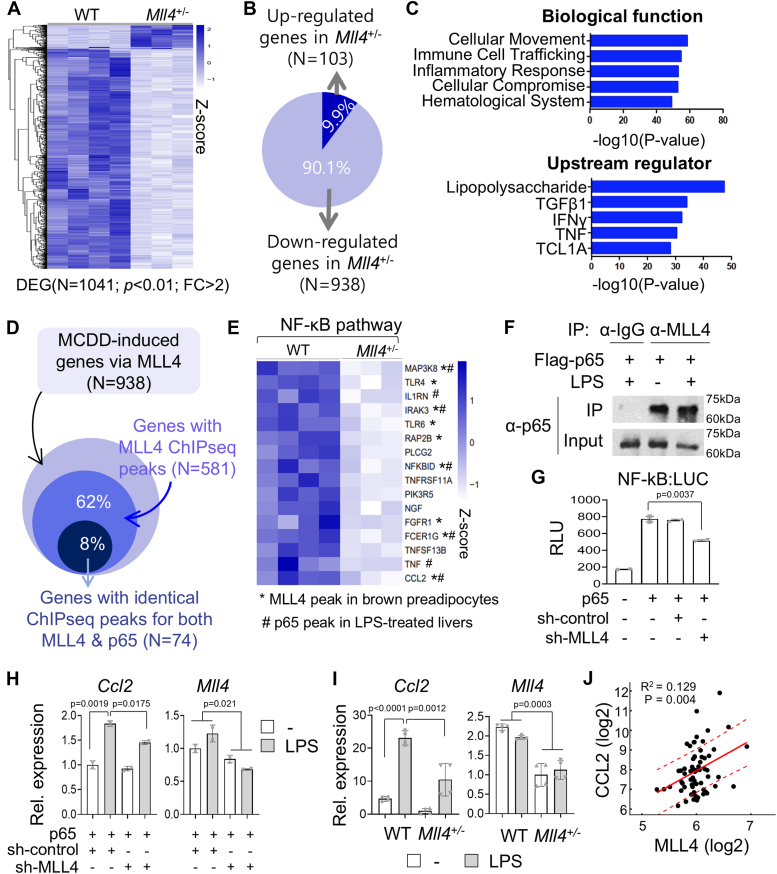
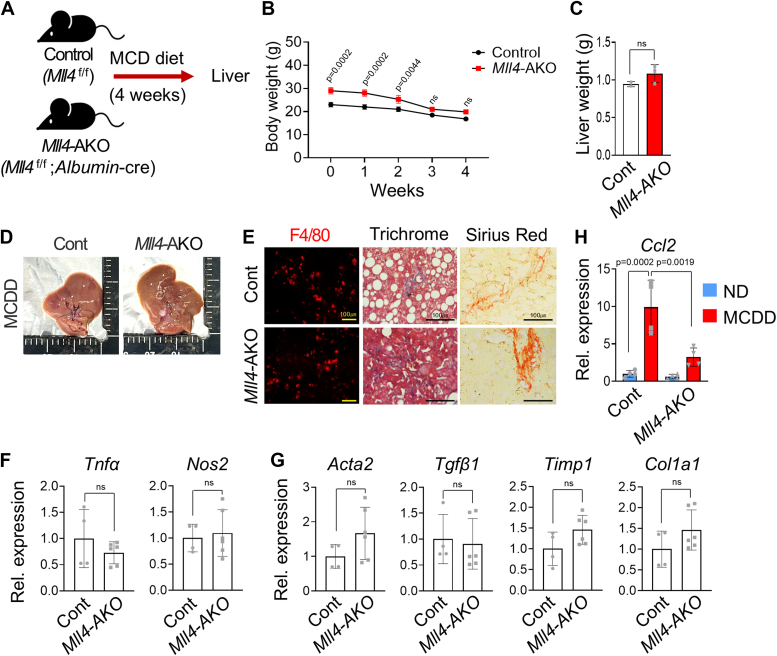
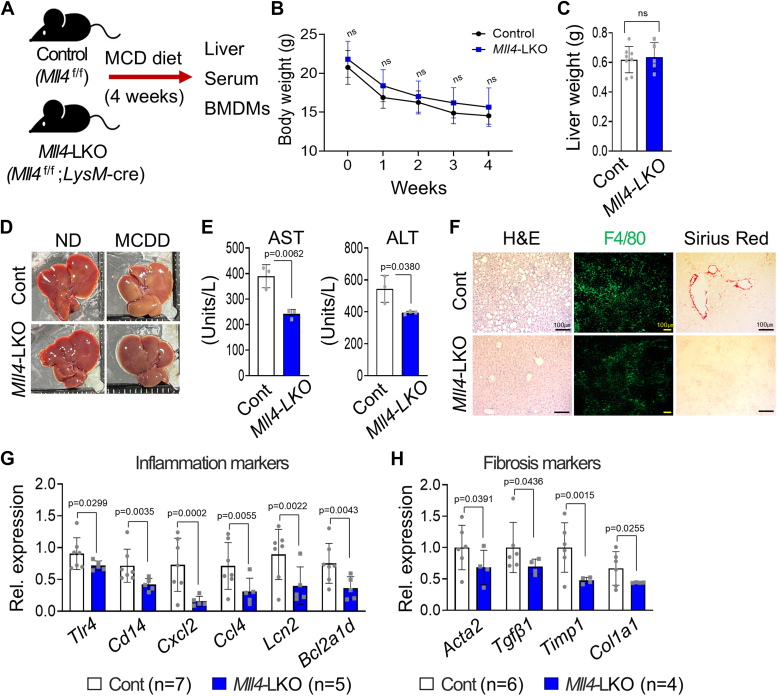
Non-alcoholic fatty liver disease (NAFLD) is a growing health problem worldwide, ranging from non-alcoholic fatty liver (NAFL) to the more severe metabolic non-alcoholic steatohepatitis (NASH). Although many studies have elucidated the pathogenesis of NAFLD, the epigenetic regulatory mechanism from NAFL to NASH remains incompletely understood. The histone H3 lysine 4 methyltransferase, MLL4 (also called KMT2D), is a critical epigenetic transcriptional coactivator that mediates overnutrition-induced steatosis in mice, but its potential role in the progression of NASH remains largely unknown. Here, we show that mice lacking the one allele of the Mll4 gene are resistant to hepatic steatosis, inflammation, and fibrosis in NASH conditions compared to wild-type controls. Transcriptome analysis of the livers of control and Mll4+/- mice identified pro-inflammatory genes regulated by the nuclear factor kappa B (NF-κB) signaling pathway as major target genes of MLL4. We show that MLL4 binds to p65 and that MLL4 is required for NF-κB transactivation. Myeloid-specific Mll4 knockout mice showed an almost complete block of NASH, while hepatocyte-specific Mll4 knockout mice showed mild inhibition of steatosis. Pro-inflammatory M1 polarization is decreased and anti-inflammatory M2 polarization is increased in liver macrophages from myeloid-specific Mll4 knockout mice. Importantly, we show that histone H3-lysine 4 methylation mediated by the MLL4-complex plays a critical role in promoting the expression of Ccl2 in hepatocytes and M1 marker genes in macrophages. Our results demonstrate that MLL4, through the NF-κB-MLL4 regulatory axis, exacerbates steatohepatitis in the context of an inflammatory response and represents a potential therapeutic target for NASH.

Keywords: NF-kappa B (NF-κB); epigenetics; gene expression; hepatocyte; histone methylation; inflammation; macrophage.


Conflict of interest statement

Conflict of interests The authors declare that they have no conflicts of interest with the contents of this article.

Figures

Figure 1
Figure 1
MLL4 expression in NASH patients and NASH protection in Mll4+/−mouse livers.A, MLL4 gene expression analysis in liver tissues from NASH patients was conducted using GEO data sets (GSE48452 and GSE61260) from the NCBI database. Gene expression levels are presented on a log2 scale, comparing normal (n = 25) and NASH (n = 38) samples. BI, eight-week-old WT and Mll4+/− male mice were fed a normal diet (ND) or a methionine and choline-deficient diet (MCDD) for 8 weeks (n = 4–6 for each group). B, weakly body weights (g) were measured. MCDD-fed WT and Mll4+/− mice showed a significant decrease in body weight compared to ND-fed mice. C, liver weights (g) were measured after 8 weeks of ND and MCDD feeding. D, gross morphology of livers from WT and Mll4+/− mice was observed after 8 weeks of ND or MCDD feeding. E, serum transaminase levels (AST and ALT) were measured in WT and Mll4+/− mice (n = 4–5 for each group). F, oil red O staining was performed on liver tissues to assess lipid accumulation. G, H & E staining of liver tissues was used to examine histological changes. H, immunofluorescence staining for F4/80 and DAPI was conducted on liver tissues from WT and Mll4+/− mice-fed ND or MCDD. Scale bars represents 100 μm. I, qRT-PCR was used to analyze the expression of inflammation-associated genes in liver tissues by (n = 3–4 for each group). Results are presented as mean ± SD. Statistical differences were determined by two-sided Student’s t test (A) and two-way ANOVA with Tukey’s multiple comparisons test (B, C, E, and I). The exact p-values are reported in each graph.
Figure 2
Figure 2
Resistance of Mll4+/−mice to MCDD-induced liver fibrosis.A, Masson’s trichrome staining was performed on liver tissues to assess fibrosis. B, Picro Sirius Red staining was used to evaluate collagen deposition in liver tissues. C, immunofluorescence (IF) analysis for α–SMA was conducted on liver sections from WT and Mll4+/− mice-fed ND or MCDD. Scale bars represents 100 μm. D, expression levels of fibrosis-associated genes in liver tissues were measured by qRT-PCR (n = 3–4 for each group). E, treatment of LX2 cells with TGFβ1 (8 ng/ml) for 24 h elevated fibrosis-associated gene expression, whereas MLL4 knockdown reduced their expression, as measured by qRT-PCR. Data represent the mean ± SD from experiments performed in triplicate. Statistical differences were determined using two-way ANOVA with Tukey’s multiple comparisons test. The exact p-values are reported in each graph.
Figure 3
Figure 3
MLL4 target genes in NASH formation.A, heatmap showing differentially expressed MLL4 target genes under NASH-inducing conditions (MCDD-fed WT: n = 4, MCDD-fed Mll4+/−: n = 3). B, schematic illustrating that a significant portion of MCDD-regulated genes are MLL4-dependent. C, top significant biological functions and upstream regulators of differentially expressed genes in Mll4+/− livers. The p-value was calculated using a right-tailed Fisher’s Exact test. D, schematic representation showing that a portion of MCDD-induced genes contain ChIP-seq peaks for both MLL4 and p65. E, heatmap clustering of MCDD-induced MLL4 target genes involved in the NF-κB pathway for NASH formation. An asterisk (∗) denotes MLL4 peaks in brown preadipocytes, and a hash (#) denotes p65 peaks in LPS-treated livers. F, co-immunoprecipitation (CoIP) of MLL4 and p65 in HepG2 cells. HepG2 cells expressing Flag-p65 were subjected to immunoprecipitation with an anti-MLL4 antibody, followed by immunoblotting with an anti-p65 antibody. This revealed that MLL4 interacts with p65, and this interaction is enhanced by LPS (100 ng/ml) treatment for 2 h. G, Hepa1c1c7 cells were transfected with NF-κB:luciferase reporter and expression vectors for p65, sh-control, or sh-MLL4. Luciferase activity was normalized to β-galactosidase activity. Transfections were repeated independently at least three times. Data are shown as relative luciferase units (RLU) (mean ± SD). H, qRT-PCR results indicated that Ccl2, an NF-κB target gene, was induced by LPS (100 ng/ml) treatment for 6 h, but this induction was suppressed by MLL4 knockdown in Hepa1c1c7 cells. The reduced expression of MLL4 by sh-MLL4 was confirmed by qRT-PCR. I, Ccl2 expression in primary hepatocytes from WT mice was induced by LPS (100 ng/ml) treatment for 6 h but not in hepatocytes from Mll4+/− mice (n = 2 for each group). J, public datasets from the NCBI GEO database (http://www.ncbi.nlm.nih.gov/geo/) were analyzed for gene expression correlation between MLL4 and CCL2 using NASH patient GEO datasets (GSE48452 and GSE61260). The correlation coefficient (r2) was calculated using Pearson’s correlation test. The x- and y-values in Figure 3J are log2-transformed. The red solid line represents the regression line, and the red dashed line indicates one standard error bounds. Results are presented as mean ± SD. Statistical differences were determined by two-sided Student’s t test (G) and two-way ANOVA with Tukey’s multiple comparisons test (H and I). Exact p-values are reported in each graph.
Figure 4
Figure 4
Mild inhibition of NASH in hepatocyte-specific MLL4-deleted mice.A, eight-week-old Mll4f/f (Control) (n = 2) and Mll4f/f; Albumin-cre (Mll4-AKO) (n = 3) mice were fed an MCDD for 4 weeks. B and C, body weight (g) and liver weight (g) of Mll4f/f (n = 2) and Mll4-AKO (n = 3) mice after 4 weeks of MCDD feeding. D, gross liver morphology from WT and Mll4-AKO mice sacrificed after 4 weeks of MCDD. E, IF analysis for F4/80, Masson’s trichrome staining, and Picro Sirius Red staining of liver tissues from Mll4f/f and Mll4-AKO mice-fed MCDD. Scale bars represents 100 μm. F and G, expression of pro-inflammatory genes and fibrosis-associated genes in liver tissues from Mll4f/f and Mll4-AKO mice-fed MCDD (n = 2–3 for each group). H, expression of Ccl2 in liver tissues from Mll4f/f and Mll4-AKO mice-fed ND or MCDD, as measured by qRT-PCR (n = 2 for each group). Results are presented as mean ± SD. Statistical differences were determined by two-sided Student’s t test (C, F and G) and two-way ANOVA with Tukey’s multiple comparisons test (B and H). The exact p-values are reported in each graph.
Figure 5
Figure 5
Deletion of MLL4 in KCs/macrophages reduces NASH.A, eight-week-old Mll4f/f (Control) (n = 8) and Mll4f/f;LysM-cre (Mll4-LKO) (n = 5) mice were fed with MCDD for 4 weeks. Schematic outline of experimental approaches and analysis. B and C, body weight (g) and liver weight (g) of Mll4f/f (n = 8) and Mll4-LKO (n = 5) mice after 4 weeks of MCDD feeding. D, representative captured liver tissues of experimental mice at the end of experiments. E, levels of serum transaminases (AST and ALT) measured from Mll4-LKO (n = 3) and Mll4f/f mice (n = 3) fed MCDD. F, H & E staining, IF analysis for F4/80, and Sirius Red staining of liver tissues from Mll4f/f (n = 6) and Mll4-LKO (n = 3) fed MCDD. Scale bars represents 100 μm. G and H, qRT-PCR analysis for inflammation- and fibrosis-associated genes in liver tissues from MCDD-fed Mll4f/f (n = 6–7) and Mll4-LKO (n = 4–5). Results are presented as mean ± SD. Statistical differences were determined by two-sided Student’s t test (C, E, G and H) and two-way ANOVA with Tukey’s multiple comparisons test (B). The exact p-values are reported in each graph.
Figure 6
Figure 6
Macrophage/monocyte-specific MLL4 deletion inhibits M1 phenotype.A, flow cytometry analysis of primary Kupffer cells (KCs) from Mll4f/f (n = 3) and Mll4-LKO (n = 3) mice fed an MCDD for 4 weeks. Bottom: Mean fluorescence intensity (MFI) of CD80+ M1 KCs and CD163+ M2 KCs was measured. B, expression of M1 and M2 markers in primary bone marrow–derived macrophages (BMDMs) from MCDD-fed Mll4f/f (n = 4–8) and Mll4-LKO (n = 3–5) mice, determined by qRT-PCR. C, M1 marker expression in primary BMDMs from ND-fed Mll4f/f (n = 3) and Mll4-LKO (n = 3) mice treated with LPS (100 ng/ml) for 6 h, assessed by qRT-PCR. Results are shown as mean ± SD. Statistical differences were determined by two-sided Student’s t test (A and B) and two-way ANOVA with Tukey’s multiple comparisons test (C). The exact p-values are reported in each graph.
Figure 7
Figure 7
Critical roles of MLL4 in NF-κB target gene expression in the liver.A, chromatin immunoprecipitation (ChIP) analysis showing MCDD-enhanced recruitment of p65 and MLL4 to the Ccl2-κB site in primary hepatocytes from WT mice-fed ND or MCDD. B, ChIP results displaying elevated H3K4me1 levels at the Ccl2-κB site in primary hepatocytes from WT livers under MCDD, but not in primary hepatocytes from Mll4+/− livers. C and D, ChIP for LPS-enhanced recruitment of p65 and MLL4 to the Tnfα-κB and Nos2-κB sites in primary BMDMs from WT mice. E, ChIP showing increased H3K4me1 levels at the Tnfα-κB and Nos2-κB sites in primary BMDMs from Mll4f/f, but not from Mll4-LKO. Results are shown as mean ± SD. Statistical differences were evaluated using a two-sided Student’s t test (A, C, and D) and two-way ANOVA with Tukey’s multiple comparisons test (B and E). The exact p-values are reported in each graph. F, working model: MLL4 plays a key role in NASH development. MCDD or LPS triggers activation of the NF-κB-MLL4 axis, promoting the decoration of NF-κB target genes with H3K4me1/2 marks in the liver. This leads to the transactivation of Ccl2 in hepatocytes, which recruits macrophages to damaged liver sites. In macrophages, MLL4 drives the transcription of inflammatory, fibrotic, and M1 marker genes, exacerbating NASH progression.

References

    1. Eslam M., Newsome P.N., Sarin S.K., Anstee Q.M., Targher G., Romero-Gomez M., et al. A new definition for metabolic dysfunction-associated fatty liver disease: an international expert consensus statement. J. Hepatol. 2020;73:202–209. - PubMed
    1. Michelotti G.A., Machado M.V., Diehl A.M. NAFLD, NASH and liver cancer. Nat. Rev. Gastroenterol. Hepatol. 2013;10:656–665. - PubMed
    1. Dulai P.S., Singh S., Patel J., Soni M., Prokop L.J., Younossi Z., et al. Increased risk of mortality by fibrosis stage in nonalcoholic fatty liver disease: systematic review and meta-analysis. Hepatology. 2017;65:1557–1565. - PMC - PubMed
    1. Day C.P., James O.F. Steatohepatitis: a tale of two "hits"? Gastroenterology. 1998;114:842–845. - PubMed
    1. Kazankov K., Jørgensen S.M.D., Thomsen K.L., Møller H.J., Vilstrup H., George J., et al. The role of macrophages in nonalcoholic fatty liver disease and nonalcoholic steatohepatitis. Nat. Rev. Gastroenterol. Hepatol. 2019;16:145–159. - PubMed

Publication types

MeSH terms

Associated data