. 2024 Dec;300(12):107987.
doi: 10.1016/j.jbc.2024.107987. Epub 2024 Nov 13.

The circular RNA circNFIX regulates MEF2C expression in muscle satellite cells in spastic cerebral palsy

Affiliations

The circular RNA circNFIX regulates MEF2C expression in muscle satellite cells in spastic cerebral palsy

Brigette Romero et al. J Biol Chem. 2024 Dec.

Abstract

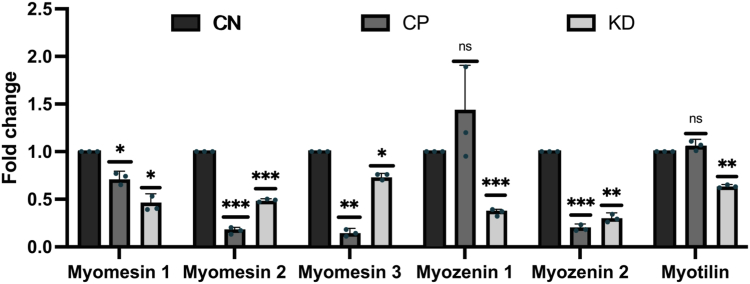
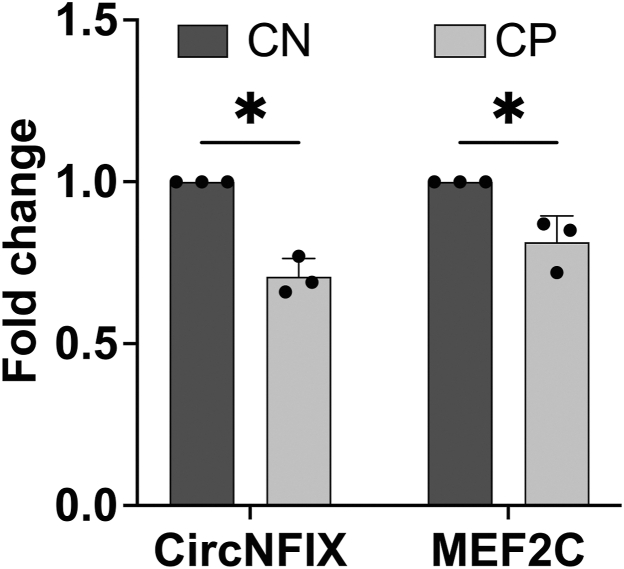
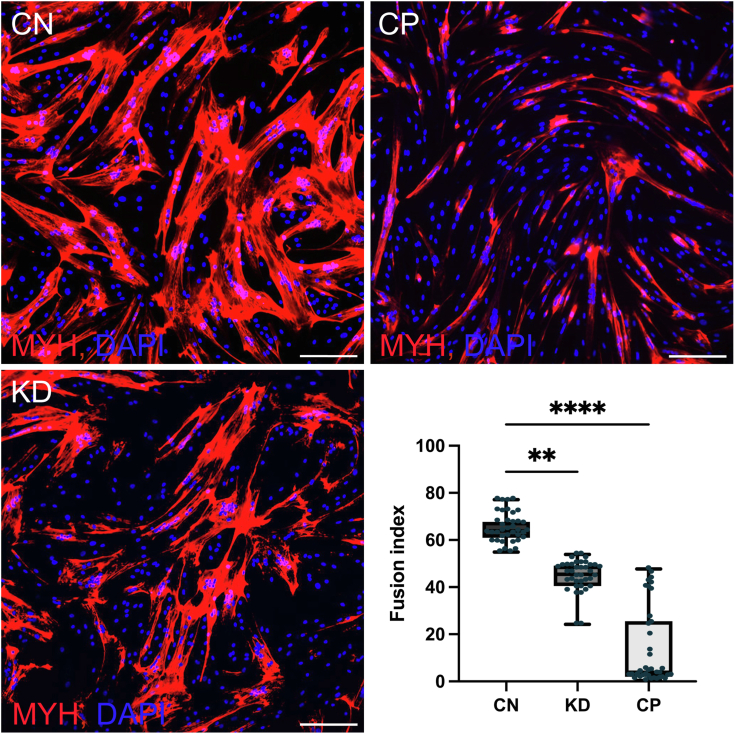
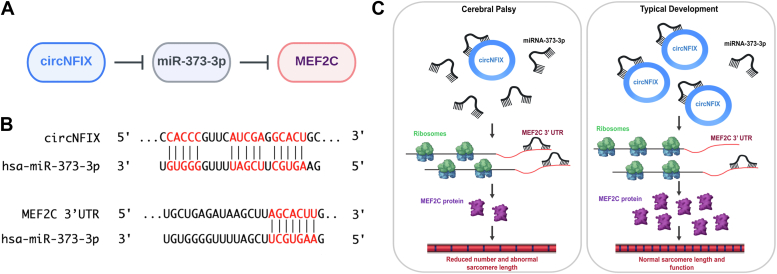
Cerebral palsy (CP) is a pediatric onset disorder with poorly understood molecular causes and progression, making early diagnosis difficult. Circular RNAs are regulatory RNAs that show promise as biomarkers in various diseases but the role of circular RNAs in CP is beginning to be understood. This study identified the role of circNFIX in regulating the expression of myocyte-specific enhancer factor 2C (MEF2C), an important transcription factor for sarcomere development. We found that circNFIX is downregulated in the muscle cells of individuals with CP, and its localization shifts toward the nucleus as visualized using single-molecule resolution imaging. The decreased expression of circNFIX, MEF2C, and MEF2C targets persisted throughout myoblasts to myotubes differentiation, and in the skeletal muscle tissue. Bioinformatic and experimental validation confirmed that circNFIX acts as a sponge for miR373-3p, a microRNA that represses MEF2C translation. In normal muscle, circNFIX derepresses MEF2C translation by sponging miR373-3p, allowing for normal sarcomere generation. In CP, reduced circNFIX expression results in loss of miRNA sponging, leading to lower MEF2C expression and downregulation of sarcomere genes, potentially causing shortened and dysfunctional muscle fibers. Knockdown (KD) of circNFIX reduced myogenic capacity of myoblasts to fuse and form myotubes similar to CP cells evident from the lower fusion index in CP and KD as compared to control myotubes. This is the first study reporting reduction of MEF2C in CP and single-molecule resolution imaging of circNFIX's subcellular distribution and its role in CP, suggesting circNFIX as a potential therapeutic target and biomarker for early CP diagnosis.

Keywords: MEF2C; biomarker; cerebral palsy; circFISH; circNFIX; circular RNA; miR-373-3p; miRNA sponging; regulatory noncoding RNAs; satellite cells; spastic cerebral palsy.


Conflict of interest statement

Conflicts of interest The authors declare that they have no conflicts of interest with the contents of this article.

Figures

Figure 1
Figure 1
Verification of isolated satellite cells.A, graphical representation of workflow of isolating satellite cells derived myoblasts from muscle biopsies. B, representative immunofluorescence images of SC-MBs isolated from control (CN) and cerebral palsy (CP) stained with anti-PAX7 and anti-MYF5 antibodies. PAX7 and MYF5 signals are pseudo colored red and merged with DAPI staining shown as blue. The scale bar represents 5 μm. SC-MB, satellite cell-derived myoblast; DAPI, 4′,6-diamidino-2-phenylindole.
Figure 2
Figure 2
Validating expression of circNFIX and MEF2C in SC-MBs.A, graphical representation of circNFIX and validation of the back splice junction of circNFIX by Sanger sequencing of the PCR product obtained using divergent primers using RNA isolated from SC-MBs. B, average fold change in expression levels of circNFIX and MEF2C RNA between nine control (CN) and nine CP derived SC-MBs by qRT-PCR. C, relative expression levels of circNFIX, MEF2C, and GAPDH RNA represented as fold changes upon treatment with RNase R (RNase R+) compared to untreated samples (RNase R-). Error bars indicate standard deviation. Significance (∗ = p < 0.05, ∗∗∗∗ = p < 0.0001, ns = not significant) was established using unpaired, two-tailed Student’s t test. All experiments were performed in triplicate. CP, cerebral palsy; MEF2C, myocyte-specific enhancer factor 2C; NFIX, nuclear factor IX; qRT-PCR, quantitative reverse transcriptase PCR; SC-MB, satellite cell-derived myoblast.
Figure 3
Figure 3
Effect of circNFIX knockdown on MEF2C.A, fold change in expression levels of circNFIX and MEF2C RNA between control (CN), CN circNFIX KD (KD), and CN scramble (SCR) SC-MBs by qRT-PCR. B, representative images and quantification of MEF2C protein levels (corrected total cell fluorescence–CTCF) measured by immunofluorescence confirming downregulation of MEF2C protein in CP and KD. Red dots depicting MEF2C protein are merged with DAPI (blue). Error bars indicate standard deviation. Significance (∗ = p < 0.05, ∗∗ = p < 0.01, ∗∗∗ = p < 0.001, ns = not significant) was established using unpaired, two-tailed Student’s t test. All experiments were performed in triplicate. The scale bar represents 5 μm. CP, cerebral palsy; DAPI, 4′,6-diamidino-2-phenylindole; MEF2C, myocyte-specific enhancer factor 2C; NFIX, nuclear factor IX; qRT-PCR, quantitative reverse transcriptase PCR; SC-MB, satellite cell-derived myoblast.
Figure 4
Figure 4
Polysome fractionation of MEF2C mRNA distri.A, the UV chromatograms of SEC from CN, CP, and CN circNFIX KD. Polysome bound (PB) represents mRNA bound to polysomes, while non-polysome bound (non-PB) represents mRNAs bound to ribosomal subunits, including 80S, 60S, and 40S. The x-axis indicates the retention time, and the y-axis shows the UV absorbance at 215 nm (pink line), 260 nm (blue line), and 280 nm (black line). B, the fractions were analyzed by qRT-PCR. The expression of MEF2C mRNA was normalized with GAPDH to compare its expression in CP and KD samples in polysomes (PB) and subunits (non-PB). Error bars indicate standard deviation. Significance (∗∗∗ = p < 0.001, ∗∗∗∗ = p < 0.0001) was established using unpaired, two-tailed Student’s t test. All experiments were performed in triplicate. CN, control; CP, cerebral palsy; MEF2C, myocyte-specific enhancer factor 2C; NFIX, nuclear factor IX; qRT-PCR, quantitative reverse transcriptase PCR; SEC, size-exclusion chromatography.
Figure 5
Figure 5
Cellular localization of circNFIX and linear NFIX at single molecule resolution.A, schematic showing biogenesis of the linear and circular NFIX transcripts from the NFIX gene as well as the binding sites of PC (probes binding exon 2, found in both circNFIX and linear NFIX) and PL (probes binding exon 11, only found in linear NFIX) probes. B, representative images of SC-MBs from control (CN), control treated with RNase R, KD, and CP. Left most panels are bright field images of cells, middle panels are merged z stacks of raw images in Texas red (PC) and Cy5 (PL) channels, right most panels show merge of two channels (Texas red pseudo colored as green, Cy5 pseudo colored as red over DAPI. C, nuclear and cytoplasmic distribution of linear and circNFIX in CN- and CP-derived SCMBs. D, quantification of circFISH images from CN, CN treated with RNase R, CN circNFIX knockdown, and CP-derived SC-MBs. At least 100 cells were counted for each set, each experiment was performed in triplicate. Error bars indicate 95% CI. Significance (∗ = p < 0.05, ∗∗∗ = p < 0.005) was established using unpaired, two-tailed Student’s t test. Scale bar is 5 μm. CI, confidence interval; DAPI, 4′,6-diamidino-2-phenylindole; NFIX, nuclear factor IX; SC-MB, satellite cell-derived myoblast.
Figure 6
Figure 6
Identification of miRNA binding site in the 3UTR of MEF2C.A, schematic of MEF2C 3′ UTR regions used in the luciferase assay. B, the results of the luciferase assay after transfecting SC-MBs from control (CN), CP, CN cNFIX KD, and CN SCR with psiCHECK2 dual-luciferase vectors expressing different fragments of 3′UTRs of MEF2C in frame with Renilla luciferase. Cells were lysed 24 h post transfection, and the expression of Renilla (RL) and firefly (FL) was measured in relative light units (RLU) for three different fragments (F1, F2, and F3) of the MEF2C 3′ UTR, empty vector, and mock transfection sample. We calculated the ratio of renilla luciferase/firefly luciferase (RL/FL) for all the samples and normalized the RL/FL of F1, F2, and F3 samples to RL/FL of mock transfection, and then to RL/FL of empty plasmid by subtraction. The normalized RL/FL of CP, CN circNFIX KD, and CN SCR was compared to the respective normalized RL/FL of CN SC-MBs. All experiments were done in triplicate. Error bars indicate 95% CI. Significance (∗∗∗ = p < 0.001) was established using unpaired, two-tailed Student ‘s t test. CI, confidence interval; CN, control; CP, cerebral palsy; MEF2C, myocyte-specific enhancer factor 2C; NFIX, nuclear factor IX; SC-MB, satellite cell-derived myoblast.
Figure 7
Figure 7
Bioinformatic analysis to identify miRNAs interacting with circNFIX and MEF2C.A, common human miRNAs predicted to interact with circNFIX and MEF2C 3’UTR fragment 1. B, common muscle specific miRNAs reported in miRTarBase and associated with both circNFIX and MEF2C 3′UTR fragment 1. C, functional miRNAs associated with circNFIX-MEF2C mediated regulation in human skeletal muscle. Red color indicates muscle miRNAs and predicted to bind to MEF2C 3′ UTR fragment 1 by two different miRNA analysis algorithms. D, expression levels of miR-373-3p in SC-MBs from CN, CP, KD, and SCR measured by qRT-PCR. Each experiment was performed in triplicate. Error bars indicate standard deviation. Significance (∗ = p < 0.05) was established using unpaired, two-tailed Student’s t test. CN, control; CP, cerebral palsy; MEF2C, myocyte-specific enhancer factor 2C; NFIX, nuclear factor IX; qRT-PCR, quantitative reverse transcriptase PCR; SC-MB, satellite cell-derived myoblast.
Figure 8
Figure 8
Luciferase assay to confirm specific interaction between miR-373-3p and MEF2C.A, the normalized fold change in Relative Light Unit (RLU) after 24-h post transfection with increasing concentrations of hsa-miR-373-3p mimic to SC-MBs from control (CN) samples. The relative expression of Renilla normalized to firefly did not change upon increasing concentrations of mimic (Fig. S3). B, pairwise alignment between miR-373-3p and the WT and mutated dual luciferase construct expressing fragment 1 of MEF2C 3′UTR. C, luciferase assay using SC-MBs from control (CN) transfected with psiCHECK2 dual-luciferase vectors expressing either WT or mutated fragment 1. Each assay was performed in the presence of 10 nM of hsa-miR-373-3P mimic or NT (no treatment control) indicating absence of the mimic was used to normalize the readings. D, normalized fold change in RLU after transfecting control SC-MBs with WT dual luciferase construct expressing fragment 1 of MEF2C 3′UTR along with 10 nM of mirVana miRNA Mimic Negative Control #1 (NC) mimic or No treatment (NT) which include no mimic. Cells were lysed 24 h post transfection and the ratio of Renilla to firefly RLU was normalized to empty psicHECK2 plasmid. Error bars indicate standard deviation. Significance (∗ = p < 0.05, ns = no significant) was established using unpaired, two-tailed Student’s t test. All the experiments were repeated in triplicate and on cells obtained from multiple samples. MEF2C, myocyte-specific enhancer factor 2C; SC-MB, satellite cell-derived myoblast.
Figure 9
Figure 9
Effect of circNFIX reduction on MEF2C expression in myotubes derived from satellite cells.A, fold change in expression levels of circNFIX and MEF2C RNA between control (CN) and CP derived SC-MTs by qRT-PCR. B, representative images of MEF2C protein levels. Red dots depicting MEF2C protein are merged with DAPI (blue). C, corrected total cell fluorescence (CTCF) of MEF2C protein in CN and CP SC-MTs. Each experiment was performed in triplicate. Error bars indicate standard deviation. The whiskers of the box plot represent the minimum and maximum values. Significance (∗ = p < 0.05, ∗∗ = p < 0.01, ∗∗∗= < 0.001) was established using unpaired, two-tailed Student’s t test and Kruskal–Wallis test. The scale bar represents 10 μm. CP, cerebral palsy; DAPI, 4′,6-diamidino-2-phenylindole; MEF2C, myocyte-specific enhancer factor 2C; NFIX, nuclear factor IX; qRT-PCR, quantitative reverse transcriptase PCR; SC-MT, satellite cell-derived myotube.
Figure 10
Figure 10
Expression levels of MEF2C downstream targets measured by qRT-PCR analysis in CN and CP, and circNFIX KD derived SC-MTs. The experiment was performed in triplicate. Error bars indicate standard deviation. Significance (∗ = p < 0.05; ∗∗ = p < 0.01; ∗∗ = p < 0.001; ns = not significant) was established using unpaired, two-tailed Student’s t test. CN, control; CP, cerebral palsy; MEF2C, myocyte-specific enhancer factor 2C; NFIX, nuclear factor IX; qRT-PCR, quantitative reverse transcriptase PCR; SC-MT, satellite cell-derived myotube.
Figure 11
Figure 11
Average expression of circNFIX and MEF2C using total RNA isolated from skeletal muscle tissue of six individuals with CP normalized to the average expression in skeletal tissue of six CN samples as obtained by qRT-PCR. Experiment was performed in triplicate. Error bars indicate standard deviation. Significance (∗ = p < 0.05) was established using unpaired, two-tailed Student’s t test. CN, control; CP, cerebral palsy; MEF2C, myocyte-specific enhancer factor 2C; NFIX, nuclear factor IX; qRT-PCR, quantitative reverse transcriptase PCR.
Figure 12
Figure 12
Representative images confirm that the fusion index of CP and KD is lower compared to CN. The staining of myosin heavy chain (MYH) depicts SC-MTs. The fusion index is the ratio of the number of nuclei (shown in blue with DAPI staining) inside a myotube (depicted in red with MYH staining) to the total number of nuclei per field of view. The whiskers represent the minimum and maximum values. Significance (∗∗ = p < 0.01, ∗∗∗∗ = p < 0.0001) was established using Kruskal–Wallis test. All experiments were performed in triplicate. The scale bar represents 10 μm. CN, control; CP, cerebral palsy; DAPI, 4′,6-diamidino-2-phenylindole; SC-MT, satellite cell-derived myotube.
Figure 13
Figure 13
Model of the regulation of MEF2C expression in spastic cerebral palsy by circNFIX.A, the schematic of circRNA-miRNA-mRNA regulatory axis. B, binding sites for miR-373-3p in circNFIX and binding site of miR373-3p in the fragment 1 of MEF2C 3′UTR. C, hypothetical model for the functional role of circNFIX in muscle satellite cells. circRNA, circular RNA; DAPI, 4′,6-diamidino-2-phenylindole; MEF2C, myocyte-specific enhancer factor 2C; NFIX, nuclear factor IX.

References

    1. Patel D.R., Neelakantan M., Pandher K., Merrick J. Cerebral palsy in children: a clinical overview. Transl Pediatr. 2020;9:S125–S135. - PMC - PubMed
    1. Lieber R.L., Fridén J. Spasticity causes a fundamental rearrangement of muscle-joint interaction. Muscle Nerve. 2002;25:265–270. - PubMed
    1. Accardo P., Capute A. 3er ed Edition. Paul H. Brookes; Baltimore, MD: 2008. Capute & Accardo’s Neurodevelopmental Disabilities in Infancy and Childhood.
    1. Mockford M., Caulton J.M. The pathophysiological basis of weakness in children with cerebral palsy. Pediatr. Phys. Ther. 2010;22:222–233. - PubMed
    1. Sankar C., Mundkur N. Cerebral palsy-definition, classification, etiology and early diagnosis. Indian J. Pediatr. 2005;72:865–868. - PubMed

Publication types