. 2024 Nov 14;15(11):830.
doi: 10.1038/s41419-024-07159-7.

p63 affects distinct metabolic pathways during keratinocyte senescence, evaluated by metabolomic profile and gene expression analysis

Affiliations

p63 affects distinct metabolic pathways during keratinocyte senescence, evaluated by metabolomic profile and gene expression analysis

Maria Cristina Piro et al. Cell Death Dis. .

Abstract

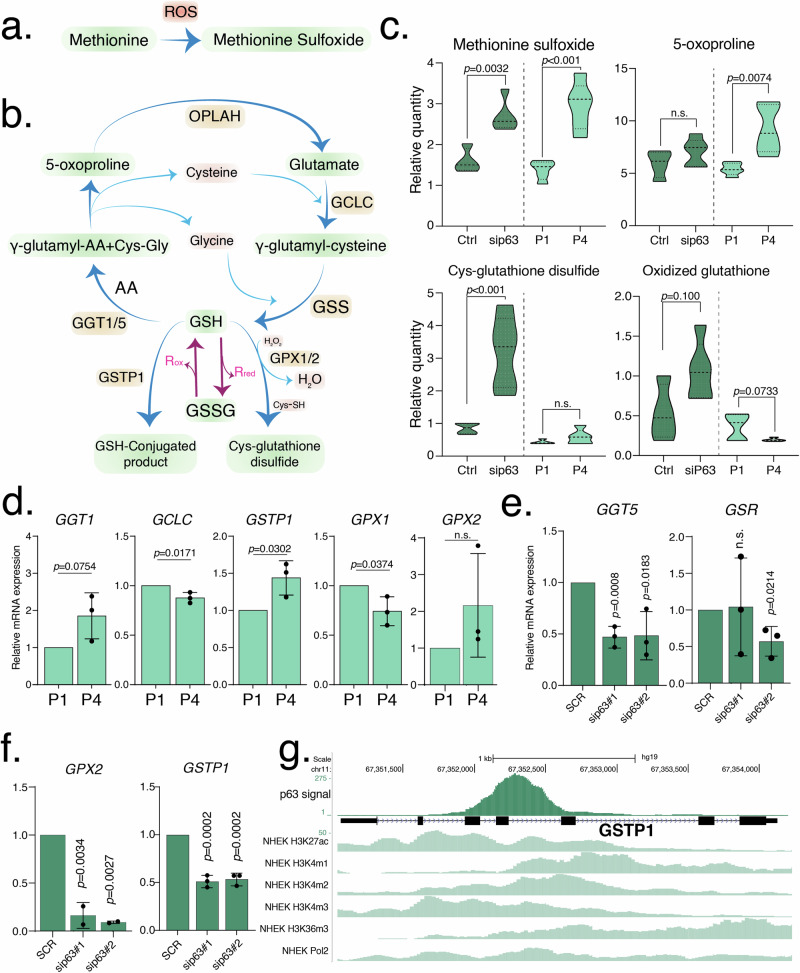
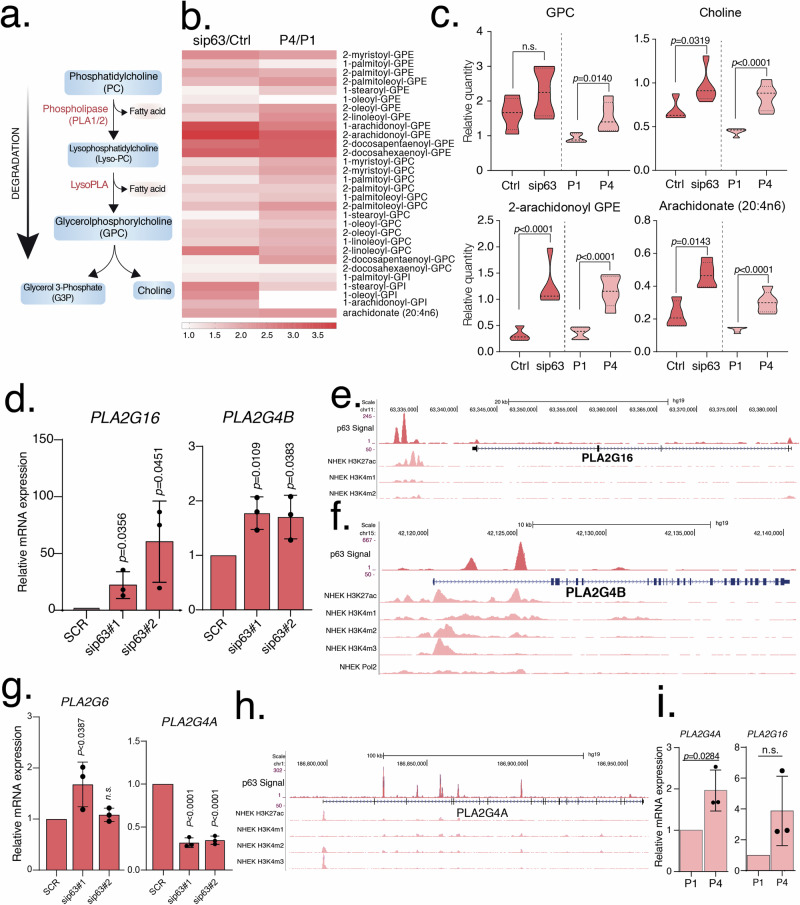
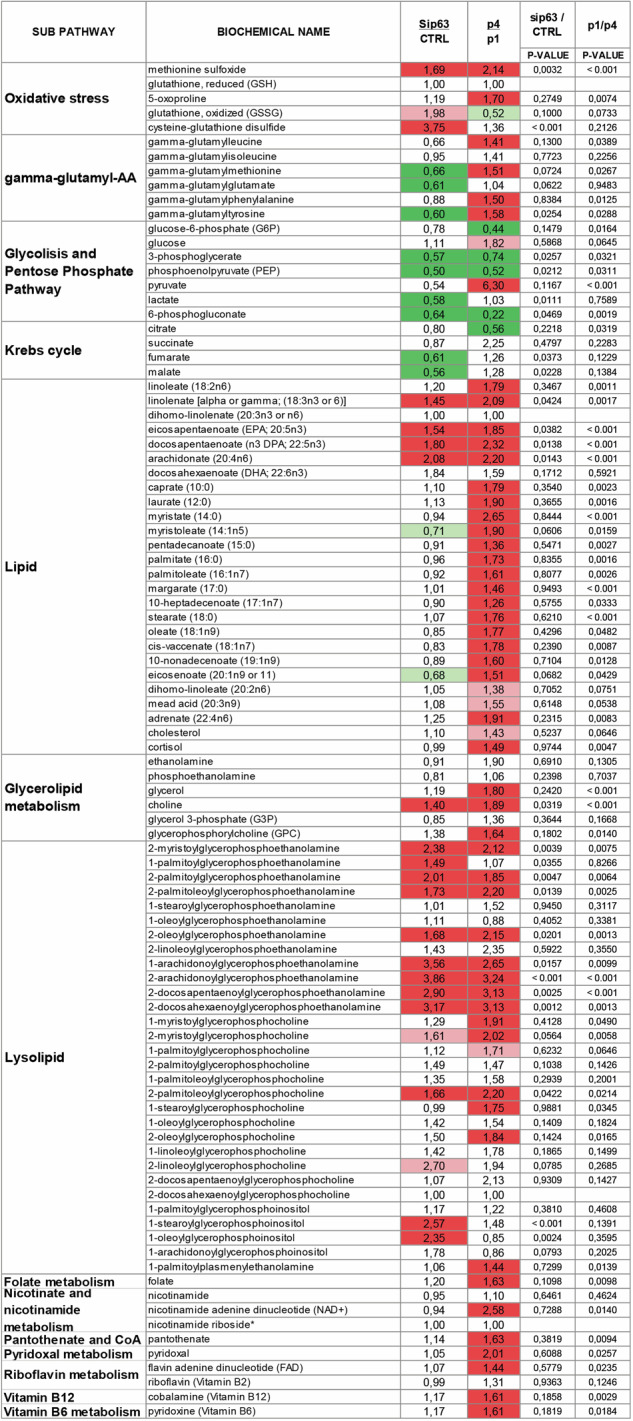
Unraveling the molecular nature of skin aging and keratinocyte senescence represents a challenging research project in epithelial biology. In this regard, depletion of p63, a p53 family transcription factor prominently expressed in human and mouse epidermis, accelerates both aging and the onset of senescence markers in vivo animal models as well as in ex vivo keratinocytes. Nonetheless, the biochemical link between p63 action and senescence phenotype remains largely unexplored. In the present study, through ultrahigh performance liquid chromatography-tandem mass spectroscopy (UPLC-MS/MS) and gas chromatography/mass spectrometry (GC/MS) metabolomic analysis, we uncover interesting pathways linking replicative senescence to metabolic alterations during p63 silencing in human keratinocytes. Integration of our metabolomic profiling data with targeted transcriptomic investigation empowered us to demonstrate that absence of p63 and senescence share similar modulation profiles of oxidative stress markers, pentose phosphate pathway metabolites and lyso-glycerophospholipids, the latter due to enhanced phospholipases gene expression profile often under p63 direct/indirect gene control. Additional biochemical features identified in deranged keratinocytes include a relevant increase in lipids production, glucose and pyruvate levels as confirmed by upregulation of gene expression of key lipid synthesis and glycolytic enzymes, which, together with improved vitamins uptake, characterize senescence phenotype. Silencing of p63 in keratinocytes instead, translates into a blunted flux of metabolites through both glycolysis and the Krebs cycle, likely due to a p63-dependent reduction of hexokinase 2 and citrate synthase gene expression. Our findings highlight the potential role of p63 in counteracting keratinocyte senescence also through fine regulation of metabolite levels and relevant biochemical pathways. We believe that our research might contribute significantly to the discovery of new implications of p63 in keratinocyte senescence and related diseases.


Conflict of interest statement

Competing interests YS in EiC of CD&Disease, EC and GM are editors.

Figures

Fig. 1
Fig. 1. Increased oxidative stress.
a Methionine oxidation involving reactive oxygen species (ROS). b Graphical representation of the glutathione pathway. c Relative quantity of methionine sulfoxide, 5-oxoproline, cys-glutathione disulfide and GSSG in senescent (P1, P4) and transfected (Ctrl, sip63 siRNAs) keratinocytes. Data are shown as mean ± SD of N = 5 biological replicates. The adjusted p values were calculated using Student’s t-test. d The mRNA expression level of GGT1, GCLC, GSTP1, GPX1 and GPX2 were evaluated using qRT-PCR in senescent (P1, P4) keratinocytes. Data are shown as mean ± SD of N = 3 biological replicates. The adjusted p values were calculated using Student’s t-test. n.s. = non-significant. e The mRNA expression level of GGT5, and GSR were evaluated using qRT-PCR in transfected (Ctrl, sip63#1 and sip63#2 siRNAs) keratinocytes. Data are shown as mean ± SD of N = 3 biological replicates. The adjusted p values were calculated using Student’s t-test. n.s. = non-significant. f The mRNA expression level of GPX2 and GSTP1 were evaluated using qRT-PCR in transfected (Ctrl, sip63#1 and sip63#2 siRNAs) keratinocytes. Data are shown as mean ± SD of N = 3 biological replicates. The adjusted p values were calculated using Student’s t-test. g ChIP-seq signals profiles of p63, H3K27Ac, H3K4me1, H3K4me2, H3K4me3, H3K36me3 and Polymerase II (range 1–50) in NHEK at GSTP1 gene region.
Fig. 2
Fig. 2. Altered glycerophospholipid metabolism.
a Graphical representation of the glycerophospholipids degradation. b Heatmap shows the relative quantity of lysophospholipids in senescent (P1, P4) and transfected (Ctrl, sip63 siRNAs) keratinocytes. Data are shown as mean of N = 5 biological replicates. c Relative quantity of GPC, choline, 2-arachidonoyl GPE and arachidonate (20:4n6) in senescent (P1, P4) and transfected (Ctrl, sip63 siRNAs) keratinocytes. Data are shown as mean ± SD of N = 5 biological replicates. The adjusted p values were calculated using Student’s t-test. d The mRNA expression levels of PLA2G16 and PLA2G4B were evaluated using qRT-PCR in transfected (Ctrl, sip63#1 and sip63#2 siRNAs) keratinocytes. Data are shown as mean ± SD of N = 3 biological replicates. The adjusted p values were calculated using Student’s t-test. e ChIP-seq signals profiles of p63, H3K27Ac, H3K4me1 and H3K4me2 (range 1–50) in NHEK at PLA2G16 gene region. f ChIP-seq signals profiles of p63, H3K27Ac, H3K4me1, H3K4me2, H3K4me3 and Polymerase II (range 1–50) in NHEK at PLA2G4B gene region. g The mRNA expression levels of PLA2G6 and PLA2G4A were evaluated using qRT-PCR in transfected (Ctrl, sip63#1 and sip63#2 siRNAs) keratinocytes. Data are shown as mean ± SD of N = 3 biological replicates. The adjusted p values were calculated using Student’s t-test. h ChIP-seq signals profiles of p63, H3K27Ac, H3K4me1, H3K4me2 and H3K4me3 (range 1–50) in NHEK at PLA2G4A gene region. i The mRNA expression levels of PLA2G4A and PLA2G16 were evaluated using qRT-PCR in senescent (P1, P4) keratinocytes. Data are shown as mean ± SD of N = 3 biological replicates. The adjusted p values were calculated using Student’s t-test. n.s. non-significant.
Fig. 3
Fig. 3. Increased fatty acid metabolism in senescent keratinocytes.
a Graphical representation of the fatty acids synthesis pathway. b Heatmap shows the relative quantity of free fatty acids in senescent (P1, P4) and transfected (Ctrl, sip63 siRNAs) keratinocytes. Data are shown as mean of N = 5 biological replicates. c Relative quantity of palmitate (16:0), stearate (18:0) and myristate (14:0) in senescent (P1, P4) keratinocytes. Data are shown as mean ± SD of N = 5 biological replicates. The adjusted p values were calculated using Student’s t-test. d The mRNA expression levels of ACLY, ACACA, ACACB and FASN were evaluated using qRT-PCR in senescent (P1, P4) keratinocytes. Data are shown as mean ± SD of N = 3 biological replicates. The adjusted p values were calculated using Student’s t-test. e The mRNA expression level of ACLY was evaluated using qRT-PCR in transfected (Ctrl, sip63#1 and sip63#2 siRNAs) keratinocytes. Data are shown as mean ± SD of N = 3 biological replicates. The adjusted p values were calculated using Student’s t-test. f ChIP-seq signals profiles of p63, H3K27Ac, H3K4me1, H3K4me2, H3K4me3 and H3K36me3 (range 1–50) in NHEK at ACLY gene region. g Graphical representation of the Krebs cycle. h Relative quantity of citrate, succinate, fumarate and malate in senescent (P1, P4) keratinocytes. Data are shown as mean ± SD of N = 5 biological replicates. The adjusted p values were calculated using Student’s t-test. n.s. non-significant. i The mRNA expression levels of CS and SIRT3 were evaluated using qRT-PCR in senescent (P1, P4) keratinocytes. Data are shown as mean ± SD of N = 3 biological replicates. The adjusted p values were calculated using Student’s t-test. j Relative quantity of citrate, succinate, fumarate and malate in transfected (Ctrl, sip63#1 and sip63#2 siRNAs) keratinocytes. Data are shown as mean ± SD of N = 5 biological replicates. The adjusted p values were calculated using Student’s t-test. n.s. non-significant. k The mRNA expression level of CS was evaluated using qRT-PCR in transfected (Ctrl, sip63#1 and sip63#2 siRNAs) keratinocytes. Data are shown as mean ± SD of N = 3 biological replicates. The adjusted p values were calculated using Student’s t-test. l ChIP-seq signals profiles of p63, H3K27Ac, H3K4me1, H3K4me2, H3K4me3 (range 1–50) in NHEK at CS gene region.
Fig. 4
Fig. 4. Altered glucose metabolism.
a Graphical representation of glycolysis pathway. b Relative quantity of glucose, glucose-6-P, 3-PG, PEP and pyruvate in senescent (P1, P4) keratinocytes. Data are shown as mean ± SD of N = 5 biological replicates. The adjusted p values were calculated using Student’s t-test. c The mRNA expression levels of PFKFB3, PDK2 and PDK1 were evaluated using qRT-PCR in senescent (P1, P4) keratinocytes. Data are shown as mean ± SD of N = 3 biological replicates. The adjusted p values were calculated using Student’s t-test. d The mRNA expression level of HK2 was evaluated using qRT-PCR in transfected (Ctrl, sip63#1 and sip63#2 siRNAs) keratinocytes. Data are shown as mean ± SD of N = 3 biological replicates. The adjusted p values were calculated using Student’s t-test. e Relative quantity of Glucose, Glucose-6-P, 3-PG, PEP, pyruvate and lactate in transfected (Ctrl, sip63 siRNAs) keratinocytes. Data are shown as mean ± SD of N = 5 biological replicates. The adjusted p values were calculated using Student’s t-test. n.s. non-significant. f Graphical representation of pentose phosphate pathway. g Relative quantity of 6-phosphogluconate in senescent (P1, P4) and transfected (Ctrl, sip63 siRNAs) keratinocytes. Data are shown as mean ± SD of N = 5 biological replicates. The adjusted p values were calculated using Student’s t-test. h The mRNA expression level of G6PD was evaluated using qRT-PCR in senescent (P1, P4) keratinocytes. Data are shown as mean ± SD of N = 3 biological replicates. The adjusted p values were calculated using Student’s t-test. i The mRNA expression level of G6PD was evaluated using qRT-PCR in transfected (Ctrl, sip63#1 and sip63#2 siRNAs) keratinocytes. Data are shown as mean ± SD of N = 3 biological replicates. The adjusted p values were calculated using Student’s t-test. j ChIP-seq signals profiles of p63, H3K27Ac, H3K4me1, H3K4me2, H3K4me3, H3K36me3 and Polymerase II (range 1–50) in NHEK at G6PD gene region.
Fig. 5
Fig. 5. Summary of results from the metabolomic study.
The pathway heatmap shows the relative ratios, or fold of change values, between biochemicals detected in the sip63 keratinocytes vs control, and P4 senescent vs P1 control keratinocytes. Green and coral shading indicate statistically significant (P ≤ 0.05) decreases or increases in fold of change, respectively. Light green and light pink shading indicate a trend (0.1 ≥ P ≥ 0.05).

References

    1. Hayflick L, Moorhead PS. The serial cultivation of human diploid cell strains. Exp Cell Res. 1961;25:585–621. - PubMed
    1. Jiang S-Y, Tian T, Yao H, Xia X-M, Wang C, Cao L, et al. The cGAS-STING-YY1 axis accelerates progression of neurodegeneration in a mouse model of Parkinson’s disease via LCN2-dependent astrocyte senescence. Cell Death Differ. 2023;30:2280–92. - PMC - PubMed
    1. Li J, Shao J, Zeng Z, He Y, Tang C, Park SH, et al. Mechanosensitive turnover of phosphoribosyl pyrophosphate synthetases regulates nucleotide metabolism. Cell Death Differ. 2022;29:206–17. - PMC - PubMed
    1. Di Micco R, Krizhanovsky V, Baker D, d’Adda di Fagagna F. Cellular senescence in ageing: from mechanisms to therapeutic opportunities. Nat Rev Mol Cell Biol. 2021;22:75–95. - PMC - PubMed
    1. Wiley CD, Campisi J. The metabolic roots of senescence: mechanisms and opportunities for intervention. Nat Metab. 2021;3:1290–301. - PMC - PubMed

LinkOut - more resources