. 2024 Nov 14;15(1):9865.
doi: 10.1038/s41467-024-54123-2.

Force-transducing molecular ensembles at growing microtubule tips control mitotic spindle size

Affiliations

Force-transducing molecular ensembles at growing microtubule tips control mitotic spindle size

Lee-Ya Chu et al. Nat Commun. .

Abstract

Correct mitotic spindle size is required for accurate chromosome segregation during cell division. It is controlled by mechanical forces generated by molecular motors and non-motor proteins acting on spindle microtubules. However, how forces generated by individual proteins enable bipolar spindle organization is not well understood. Here, we develop tools to measure contributions of individual molecules to this force balance. We show that microtubule plus-end binding proteins act at microtubule tips synergistically with minus-end directed motors to produce a system that can generate both pushing and pulling forces. To generate pushing force, the system harnesses forces generated by the growing tips of microtubules providing unique contribution to the force balance distinct from all other motors that act in the mitotic spindle. Our results reveal that microtubules are essential force generators for establishing spindle size and pave the way for understanding how mechanical forces can be fine-tuned to control the fidelity of chromosome segregation.


Conflict of interest statement

Competing interests Authors declare no competing interests.

Figures

Fig. 1
Fig. 1. Microtubule dynamics, molecular motors and tip trackers stabilize bipolar organization of two microtubule asters.
a Schematics of the double optical trap artificial spindle assay. Microtubule seeds are tethered to plastic beads that are held in two optical traps and capped at their minus ends to mimic two microtubule organization centers. The assay measures the force acting between asters. b Example recording shows pulling force (top) and the corresponding decrease in distance between the beads (bottom) in the presence of HSET only. Maximum force inferred from traces is shown. c Example recording shows pushing force (top) and the increase in the distance between beads (bottom) in the presence of EB3 and HSET. d Example recording of a balance trace with no force generated while microtubules are engaged in the presence of EB3 and HSET. In bd light blue are original data and dark blue is smoothed with 100 point moving average. e Histograms of maximum pulling and pushing forces extracted from individual traces. Bars show mean values and whiskers standard deviation. Number of measurements (left to right): n = 24, n = 20, n = 0 (no events detected), n = 19. f Quantification of the fraction of time that the system spends pushing, pulling, and being balanced (with at least two antiparallel microtubules from the opposite asters engaged) or disengaged (when microtubules from opposite asters do not interact) depending on the experimental conditions (n = 84 total traces). Source data for this figure are provided as a Source Data file.
Fig. 2
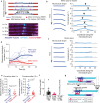
Fig. 2. Two antiparallel growing microtubules generate pushing force.
a Schematics and montage images of an example buckling event between two antiparallel microtubules (See also Supplementary Fig. 2a). At least 10 independent experiments were carried out. b Shapes of a microtubule undergoing buckling in the presence of 100 nM EB3 and 10 nM HSET as it grows in an antiparallel overlap. Only one microtubule from pair is shown. On the right - curvatures of the microtubule at the corresponding time points along the microtubule length. Arrowhead points to the maximum curvature. c Same as in ‘b’, but no EB3 present (HSET only). d Maximum microtubule curvatures determined from ‘b’ and ‘c’ plotted as function of time passed since the first antiparallel engagement event. Thin curves are individual examples and thick curves are averages. Blue corresponds to 100 nM EB3 and 10 nM HSET, red − 10 nM HSET. e Curvatures of all microtubules digitized following 5 and 15 seconds after engagement is shown. Significance calculated by the two-sided Wilcoxon test. f Buckling force measured for different HSET concentrations. Bars are mean and whiskers standard deviation. Number of measurements (left to right): n = 16, n = 19, n = 0 (zero events detected). g Schematics of the model proposing how coupling between minus-end directed motor and a growing microtubule tip can harness pushing force generated by the microtubule growth. Protein action is shown at one microtubule tip only. HSET complexes acting in the overlap as well as HSET and EB acting at the other tips are not shown for simplicity. Source data for this figure are provided as a Source Data file.
Fig. 3
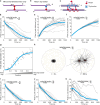
Fig. 3. EB dimers connected by a flexible scaffold move processively and harness force from a growing microtubule tip.
a Schematics of EB3 ensembles on a 200 bp DNA scaffold. b Kymograph of a single DNA scaffold with two EB3 heterodimers tracking the tip of a growing microtubule. c (Left), Red points are run lengths of individual EB3 scaffolds. Blue points are growth distances of the microtubule tips that these scaffolds ran on. Corresponding tips and scaffolds are connected by lines. (Right) residency times of the scaffolds from the left (n = 162 for 2xEB3, n = 56 for 3xEB3). d Schematics of the experimental setup for measuring forces generated by EB3 scaffolds. eh Individual examples of force traces for scaffolds with different numbers of EBs. Traces shown are smoothed to 20 Hz and fitted with logistic function (red line) to determine the force. In ‘e’ extracted force and slope are shown (F and ν). 42 out of 200 beads tested showed detectable force generation. i Extracted forces plotted as a function of the number of EBs in the scaffold. Bars are mean and whiskers are standard deviation. Number of measurements left to right: n = 9, n = 9, n = 10, n = 7. On the right, experiment in which EB dimers were coupled directly to the streptavidin bead (No scaffold used. One bead has estimated > 170,000 EB binding sites). In ‘ei’ 2x, 3x and 4x corresponds to single scaffolds with 2, 3 and 4 EB3 dimers respectively. Source data for this figure are provided as a Source Data file.
Fig. 4
Fig. 4. Organization of the two microtubule asters by the microtubule/motor/tip tracker system.
a, b Schematics of the activity of minus-end directed motors and their combination with tip tracker in antiparallel microtubule overlaps. c In the model one motor/tip tracker unit is represented as EB scaffold in which EBs are connected via HSET to the antiparallel microtubule. df Pole-to-pole distances as a function of time for different ratios between motors alone and motor/tip tracker complexes. Gray lines are individual simulations, blue lines are averages. Microtubule growth was 2x faster than motor movement (Supplementary Fig. 2b). g Steady state pole-to-pole separation as a fraction of the motors/tip tracker complexes to all complexes in the system. Line is trendline. h Snapshot images of the simulations for the 90% motor/tip tracker complexes in the beginning and in the middle of the simulation (Corresponds to Supplementary Movie 6). Colors: Black – microtubules, Green – unbound HSET, Orange – unbound EB/HSET, Dark green – microtubule bound HSET, Red – microtubule bound EB/HSET. ik Pole-to-pole distances as a function of time in the simulations for different ratios between HSET and EB/HSET in which EB/HSET was assumed to detach at forces exceeding 0.1 pN. Notations follow (df). Source data for this figure are provided as a Source Data file.
Fig. 5
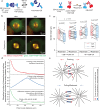
Fig. 5. Metaphase spindle length in H1299 cells depends on the pushing force generated by EB/HSET.
a Schematics of the two systems that allow endogenous EB light inactivation (π-EB1) and rapamycin-induced EB3 – HSET interaction. b Fluorescent images of π-EB1 H1299 cells with or without rapamycin treatment, light and dark blue-light activation. EB1 light inactivation induces spindle shortening, but only in cells lacking additional rapamycin activated EB/HSET system. At least five independent experiments with the same conditions independently for π-EB1 H1299 cells and wt H1299 cells were carried out. c Spindle length measured in H1299 and π-EB1 H1299 cells before (red points) and after (blue points) EB light deactivation with and without rapamycin. Gray lines connect single cell spindle length measurements before and after the blue light exposure. The boxes show mean, lower and upper quartiles. Whiskers represent ranges that fall within 1.5 times the interquartile range. Individual independent measurements are also shown. Number of measurements left to right: n = 11, 11, 26, 26, 14, 14, 14, 14. Significance was tested by Wilcoxon two-sided test, exact p values are shown. d Top data are simulations of the number of antiparallel tip/lattice interactions (red) and the area of the antiparallel lattice/lattice overlaps (blue) as the function of the pole-pole distance between asters. Points are simulations, lines are trendlines. Green is the difference between red and blue lines. e Illustration how a single minus-end directed motor and pushing microtubule tips separate microtubule asters and stabilize bipolar organization. See text for details. Source data for this figure are provided as a Source Data file.

Similar articles

Cited by

References

    1. McIntosh, J. R., Molodtsov, M. I. & Ataullakhanov, F. I. Biophysics of mitosis. Q Rev. Biophys.45, 147–207 (2012). - PMC - PubMed
    1. Forth, S. & Kapoor, T. M. The mechanics of microtubule networks in cell division. J. Cell Biol.216, 1525–1531 (2017). - PMC - PubMed
    1. Valdez, V. A., Neahring, L., Petry, S. & Dumont, S. Mechanisms underlying spindle assembly and robustness. Nat. Rev. Mol. Cell Biol.24, 523–542 (2023). - PMC - PubMed
    1. Hannabuss, J. et al. Self-Organization of Minimal Anaphase Spindle Midzone Bundles. Curr. Biol.29, 2120–2130.e2127 (2019). - PMC - PubMed
    1. Subramanian, R. et al. Insights into antiparallel microtubule crosslinking by PRC1, a conserved nonmotor microtubule binding protein. Cell142, 433–443 (2010). - PMC - PubMed

Publication types

LinkOut - more resources