. 2024 Nov 14;15(1):9857.
doi: 10.1038/s41467-024-54247-5.

An interaction network of inner centriole proteins organised by POC1A-POC1B heterodimer crosslinks ensures centriolar integrity

Affiliations

An interaction network of inner centriole proteins organised by POC1A-POC1B heterodimer crosslinks ensures centriolar integrity

Cornelia Sala et al. Nat Commun. .

Abstract

Centriole integrity, vital for cilia formation and chromosome segregation, is crucial for human health. The inner scaffold within the centriole lumen composed of the proteins POC1B, POC5 and FAM161A is key to this integrity. Here, we provide an understanding of the function of inner scaffold proteins. We demonstrate the importance of an interaction network organised by POC1A-POC1B heterodimers within the centriole lumen, where the WD40 domain of POC1B localises close to the centriole wall, while the POC5-interacting WD40 of POC1A resides in the centriole lumen. The POC1A-POC5 interaction and POC5 tetramerization are essential for inner scaffold formation and centriole stability. The microtubule binding proteins FAM161A and MDM1 by binding to POC1A-POC1B, likely positioning the POC5 tetramer near the centriole wall. Disruption of POC1A or POC1B leads to centriole microtubule defects and deletion of both genes causes centriole disintegration. These findings provide insights into organisation and function of the inner scaffold.


Conflict of interest statement

Competing interests The authors declare no competing interests.

Figures

Fig. 1
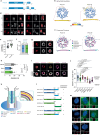
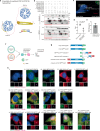
Fig. 1. POC1A and POC1B are luminal centriolar proteins with a similar domain architecture and centriolar localisation.
a Schematic representation of POC1A and POC1B with the WD40 domain at the N-terminus and the coiled-coil (CC) at the C-terminus. b Ensembles of the 10 best-ranked AlphaFold2 predictions of POC1A and POC1B. Numbers 1–7 indicate WD40 domain blades. Colouring based on pLDDT score: the linker region (dotted line) has a lower confidence level than the WD40 and CC. c Conserved features between POC1A and POC1B in the regions with the higher confidence level. d U-ExM images showing the centriolar localisation of POC1A and POC1B in different cell cycle phases. Centrioles were stained with α-tubulin (grey) and POC1A or POC1B (red) antibodies. Scale bars: 100 nm. e Quantification of G1 cells from (d) measuring the coverage rate of POC1A and POC1B along the centriole. n = 26 (POC1A), 24 (POC1B) centrioles. f Schematic representation of POC1A (blue) and POC1B (green) along the centriole normalised to centrioles with a length of 500 nm. g Top view U-ExM images from centrioles stained with α-tubulin (grey) and POC1A or POC1B (red) antibodies. Scale bar: 100 nm. n = 28 (POC1A), 20 (POC1B) centrioles. h Diameter analysis of top view centrioles shown in (g). i U-ExM images from top view centrioles stained against α-tubulin (grey) and the indicated centriolar proteins. Scale bar: 100 nm. j Quantification of (g, i) measuring the distance of the respective proteins to the α-tubulin signal. n = 28 (POC1A), 20 (POC1B), 20 (POC5), 12 (CCDC15), 10 (FAM161A), 25 (MDM1), 16 (CEP44) centrioles. k Model of the protein organisation within the centriole, comprising the inner scaffold proteins. l HA-tagged POC1A and POC1B constructs and their ability to localise to centrosomes. m Representative IF images from one experiment of control cells expressing the constructs shown in (l). Cells were stained against HA (green) and γ-tubulin (red). Scale bars: 5 µm, magnification scale bars: 1 µm. N = 3 biologically independent experiments. e, h, j Data are presented as mean ± SD. All statistics were derived from two-tail unpaired t-test. Source data are provided as a Source Data file.
Fig. 2
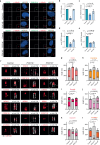
Fig. 2. Inner scaffold components are affected upon POC1A and POC1B loss.
a IF images of cycling control, POC1A−/− and POC1B−/− cells stained against the indicated proteins (green) and the centrosomal marker γ-tubulin (red). Scale bars: 10 µm, magnification scale bars: 1 µm. be Quantification of the signal intensity of the proteins at the centrosome in (a). Data are presented as mean ± SD. All statistics were derived from two-tail unpaired t-test of N = 3 biologically independent experiments, n > 100 cells per cell line for each experiment. f U-ExM images of intact G1 centrioles (longitudinal view) from control and the respective knockout cell lines stained against α-tubulin (grey) and the indicated proteins (red), M = merged channels. Scale bars: 100 nm. gl Quantification of (f). The signal distribution of the respective proteins in each cell line along the centrioles was measured. Data are presented as mean ± SD. All statistics were derived from two-tail unpaired t-test. Source data are provided as a Source Data file. g n = 17 (Control), 10 (POC1A−/−), 15 (POC1B−/−) centrioles. h n = 11 (Control), 11 (POC1A−/−), 15 (POC1B−/−) centrioles. i n = 15 (Control), 14 (POC1A−/−), 20 (POC1B−/−) centrioles. j n = 16 (Control), 10 (POC1A−/−), 11 (POC1B−/−) centrioles. k n = 11 (Control), 10 (POC1A−/−), 10 (POC1B−/−) centrioles. l n = 10 (Control), 11 (POC1A−/−), 10 (POC1B−/−) centrioles.
Fig. 3
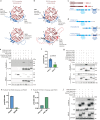
Fig. 3. The WD40 domain mediates the interaction with the inner scaffold protein POC5.
a, b AlphaFold-Multimer predictions of the WD40 domain of the POC1 proteins and POC5 reveal a potential binding site comprising blades 5 and 6 of the β-propeller and to a lesser extend blade 1. The lower panel of (a, b) focuses on blade 1, showing loss of the interaction when blade 1 is either broken in the case of POC1A or blocked due to an additional β-sheet (named Intra) from the linker region of POC1B. Percentages indicate the occurrence of the predicted ensembles. Confidence scores are shown in Supplementary Fig. 6. c Domain organisation of the POC1 proteins and POC5. d Different HA-tagged constructs of POC5 used for immunoprecipitation (IP) experiments. e Representative FLAG IP from HEK293T cells expressing either POC1A-FLAG or POC1B-FLAG together with HA-tagged subdomains of POC5. Vinculin (Vinc) was used as input control. f Quantification of the FLAG IP shown in (e). Due to differences in the expression levels of the FLAG constructs, the signal intensity of the prey band from the IP sample was normalised to the signal intensity of the bait and used as an indication for the binding efficiency between POC5 and the POC1 proteins. Data are presented as mean ± SD. All statistics were derived from two-tail unpaired t-test of N = 3 biologically independent experiments. g Representative FLAG IP from HEK293T cells expressing FLAG-tagged WD40 domain of either POC1A and POC1B or chimeric versions together with HA-tagged full-length POC5. Vinculin is input control. h, i Quantification of the prey/bait ratio of the IP samples shown in (g). Quantifications show the result from one representative experiment out of N = 3 biologically independent experiments. Although the outcomes of the experiments were identical, there was variation between them. j FLAG IP from HEK293T cells expressing FLAG-tagged POC1 proteins with HA-tagged full-length POC5 or POC5Δ472–532 to verify the predicted interacting site. GAPDH is used as input control. N = 2 biologically independent experiments. f, h, i The prey/bait ratio of each experiment and the corresponding immunoblot is provided as a Source Data file.
Fig. 4
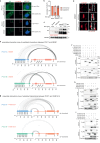
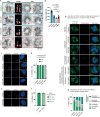
Fig. 4. Different POC1 interaction partners rely on different binding mechanisms.
a RPE1 POC5−/− cells expressing different Dox-inducible versions of HA-tagged POC5 constructs were checked for centrosomal localisation by IF. Cells were stained against HA-POC5 (green) and γ-tubulin (red). Scale bars: 5 µm, magnification scale bars: 1 µm. b Quantification of (a). Percentage of interphase cells showing centrosomal and cytoplasmatic POC5 localisation. Data are presented as mean ± SD. N = 2 biologically independent experiments, n > 110 cells per cell line for each experiment. Source data are provided as a Source Data file. c Immunoblot of the cell lines from (a). The lower HA-immunoblot is a longer exposer of the upper one. GAPDH is used as a loading control. N = 2 biologically independent experiments. d Representative U-ExM images from intact centrioles of RPE1 POC5−/− cells expressing either full-length POC5 or POC5∆472-532 and stained against α-tubulin (grey) and γ-tubulin (red), M= merged channels. POC5∆472–532 cannot rescue the luminal γ-tubulin localisation. Scale bars: 100 nm. N = 3 biologically independent experiments. e Ensemble interaction map based on AlphaFold-Multimer predictions of an interaction between POC1A (light blue) or POC1B (green) and MDM1 (salmon) (see Materials and Methods—AlphaFold-Multimer predictions). Interactions predicted to be more robust, appear darker (black) and thicker. The coiled-coil regions of POC1A and POC1B and a C-terminal segment of MDM1 mediate mainly the interactions. aa: amino acids. f Representative FLAG IP from HEK293T cells expressing FLAG-tagged full-length or subdomains of either POC1A or POC1B together with HA-tagged MDM. Vinculin is used as input control. N = 3 biologically independent experiments. g Ensemble interaction map based on AlphaFold-Multimer predictions of an interaction between POC1A (light blue) or POC1B (green) and FAM161A (salmon). The WD40 domain as well as the coiled-coil regions of both POC1 proteins might be involved in the interaction. aa: amino acids. PAE plots and confidence scores for (e, g) are shown in Supplementary Figs. 9 and 10. h, i Representative HA IP from HEK293T cells expressing HA-tagged FAM161A and FLAG-tagged subdomains of POC1A or POC1B. GAPDH was used as input control. N = 3 biologically independent experiments.
Fig. 5
Fig. 5. POC1 proteins form homo- and heterodimers.
a Ensembles of the 10 best ranked AlphaFold-Multimer predictions showing the formation of POC1A and POC1B heterodimers. Colouring based on pLDDT score. The interaction is mediated by the C-terminal coil-coiled region of the POC1 proteins. PAE plots and confidence scores are shown in Supplementary Fig. 11. b Representative FLAG IP from HEK293T cells expressing FLAG-tagged full-length or subdomains of either POC1A or POC1B together with HA-tagged full-length POC1A or POC1B. Vinculin is input control. N = 3 biologically independent experiments. c Representative image of the FLIM-FRET trajectory from the measurement of one cell co-transfected with the Donor:Acceptor pair POC1A-mNeonGreen and POC1B-mScarlet-I. Signals of the FLIM image with a shorter lifetime are located on the right side of the phasor plot, which corresponds to a quenching of the donor signal in the presence of the acceptor. The inset shows the centrosomes and in red are the signals depicted that can be found on the right side of the phasor plot. d Quantification of the fluorescence lifetime of the Donor from the representative experiment shown in c (N = 2 biologically independent experiments, with n > 5 living cells per condition in each experiment). Data are presented as mean ± SD. Statistics for the representative experiment were derived from two-tail unpaired t-test. Source data are provided as a Source Data file. e FRET efficiency of the representative experiment shown in d. Data are presented as mean ± SD. f Experiment scheme for dimerization using the GFP-Binder approach. Subdomains of POC1 proteins were fused either with GFP or with GBP (mScarlet-I functions as a reporter). Upon expression, the subdomains should dimerize via the strong affinity of the GBP for GFP. Centrosomal localisation upon dimerization was checked via IF (see h). g Constructs used for the GFP-GBP dimerization experiment within the cell. h IF of HEK293T cells transfected with the constructs shown in g. Centrosomal localisation of the EGFP-tagged (green) and m-Scarlet-I-tagged (red) proteins were analysed using γ-tubulin (magenta). Additional constructs were analysed in Supplementary Fig. 13a, b. Scale bars: 10 µm, magnification scale bars: 1 µm. N = 3 biologically independent experiments.
Fig. 6
Fig. 6. POC1A and POC1B act together in centriole biogenesis.
a EM images of G1 centrioles from POC1A−/−, POC1B−/− and POC5−/− cells. The knockout cells lines have broken centrioles (as seen in the longitudinal view, magenta arrows) with the most proximal region usually intact (indigo arrow). This phenotype can be also observed by U-ExM. Cross-sections of these centrioles from proximal and distal regions show loss of entire MT triplets (magenta arrows) and in the case of POC1A−/− and POC5−/− deformation or loss of the inner scaffold structure in the distal half of the centrioles. Scale bars: 200 nm (EM) and 100 nm (U-ExM). b Quantification of longitudinal centrioles from (a). POC1B−/− centrioles show already defects at around 150 nm, whereas POC1A−/− and POC5−/− centrioles have mostly defects at 190-200 nm. Data are presented as mean ± SD. Statistics were derived from two-tail unpaired t-test. n = 20 (Control), 14 (POC1A−/−), 6 (POC1B−/−), 19 (POC5−/−). c IF images of interphase POC1A/B−/− double knockout cells show loss of centrosomal signal. Green: γ-tubulin, red: PCNT. Scale bars: 5 µm, magnification scale bars: 1 µm. d Percentage of the cells from (c) showing co-localisation of γ-tubulin and PCNT. Data are presented as mean ± SD. N = 3 biologically independent experiments, n > 100 cells per cell line for each experiment. e Control and POC1A/B−/− cells were stained against CEP44 (green) and PCNT (red) to detect the proximal part of centrioles. Scale bars: 5 µm, and 1 µm for the inset magnifications. f Percentage of cells from (e) showing CEP44 and PCNT co-localisation. Data are presented as mean ± SD. N = 2 biologically independent experiments, n > 100 cells per cell line for each experiment. g Mitotic spindle configurations observed in control and knockout cell lines. Green: α-tubulin, red: γ-tubulin, magenta: CDK5RAP2. Scale bars: 5 µm. h Percentage of cells in the knockout cell lines showing indicated spindle configuration in g. Data are presented as mean ± SD. N = 2 biologically independent experiments, n > 50 cells per cell line for each experiment. Source data are provided as a Source Data file.
Fig. 7
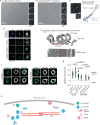
Fig. 7. An inner luminal protein network ensures the formation of the inner scaffold and the integrity of centrioles.
Representative negative stain Electron Microscopy (EM) micrograph from purified human wild type POC5-Centrin2 (a) or POC5Δ153-184-Centrin2 (b) complex expressed in insect cells. The numbers in the left upper corner of the 2D class averages indicate particle numbers. Scale bars: 100 nm and 10 nm. N = 1 biologically independent experiment. c Comparison of wild type POC5-Centrin2 and POC5Δ153-184-Centrin2 complexes. Left: negative stain 2D classes, scale bars and particles numbers are given. Right: negative stain EM 3D reconstructions of wild type POC5-Centrin2 (grey) and POC5Δ153-184-Centrin2 (blue). POC5Δ153-184-Centrin2 particles show a structure shorter than the wild type. d U-ExM images of POC5−/− cells expressing the HA-tagged mutant POC5Δ153-184 and stained against HA (magenta), γ-tubulin (green), α-tubulin (grey), M = merged channels. Scale bar: 100 nm. N = 2 biologically independent experiments. e The rod-like POC5-Centrin2 negative stain EM 3D reconstruction (salmon) presented in (a, c) was fitted into a published subtomogram average of a microtubule triplet from Paramecium tetraurelia (emd-4926). f U-ExM images of control and POC1A/B−/− cells expressing POC1A or POC1B tagged at the N-terminus with EGFP and stained against EGFP (green) and α-tubulin (grey). Scale bar: 100 nm. g Quantification of centrioles shown in (f). The distance between the EGFP signal and α-tubulin was measured from top view centrioles and compared to the distance exhibited when stained with an antibody detecting epitopes at the C-terminus of the POC1 proteins (labelled as POC1A and POC1B, respectively). The data set for centrioles stained with the antibodies detecting the M/C-portions of the POC1 proteins was shown in Fig. 1j and is included in the graph of (g) for better comparison. Data are presented as mean ± SD. Statistics were derived from two-tail unpaired t-test. n of Control cell lines: 28 (POC1A), 18 (EGFP-POC1A), 20 (POC1B), 12 (EGFP-POC1B) centrioles. n of POC1A/B−/− cell lines: 17 (EGFP-POC1A), 14 (EGFP-POC1B) centrioles. Source data are provided as a Source Data file. h Model of the inner scaffold protein network within the centriole. See Discussion for details.

References

    1. Le Guennec, M. et al. A helical inner scaffold provides a structural basis for centriole cohesion. Sci. Adv.6, 4137–4151 (2020). - PMC - PubMed
    1. Nigg, E. A. & Stearns, T. The centrosome cycle: centriole biogenesis, duplication and inherent asymmetries. Nat. Cell Biol.13, 1154 (2011). - PMC - PubMed
    1. Hall, E. A. et al. Centriolar satellites expedite mother centriole remodeling to promote ciliogenesis. Elife12, e79299 (2023). - PMC - PubMed
    1. Kilburn, C. L. et al. New Tetrahymena basal body protein components identify basal body domain structure. J. Cell Biol.178, 905–912 (2007). - PMC - PubMed
    1. Keller, L. C., Romijn, E. P., Zamora, I., Yates, J. R. & Marshall, W. F. Proteomic analysis of isolated chlamydomonas centrioles reveals orthologs of ciliary-disease genes. Curr. Biol.15, 1090–1098 (2005). - PubMed

Publication types

MeSH terms

Substances

LinkOut - more resources