. 2025 Jan;22(1):193-206.
doi: 10.1038/s41592-024-02493-2. Epub 2024 Nov 14.

A comprehensive human embryo reference tool using single-cell RNA-sequencing data

Affiliations

A comprehensive human embryo reference tool using single-cell RNA-sequencing data

Cheng Zhao et al. Nat Methods. 2025 Jan.

Erratum in

Abstract

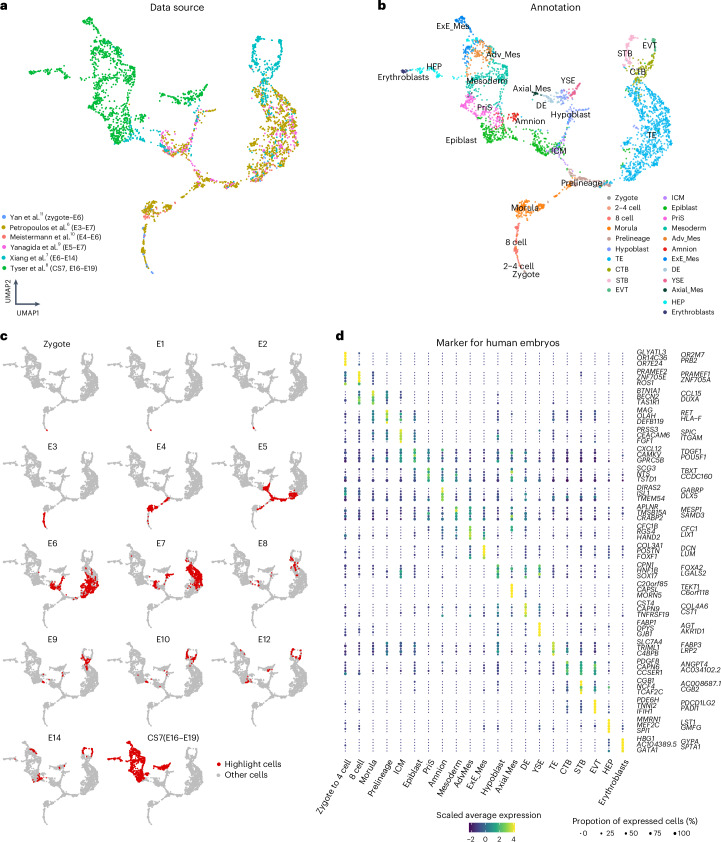
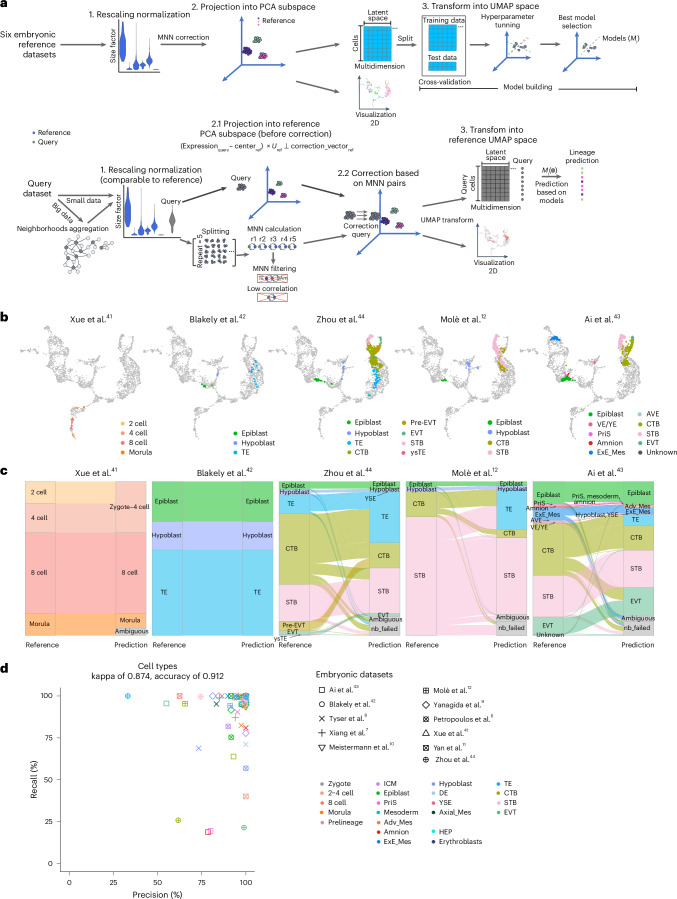
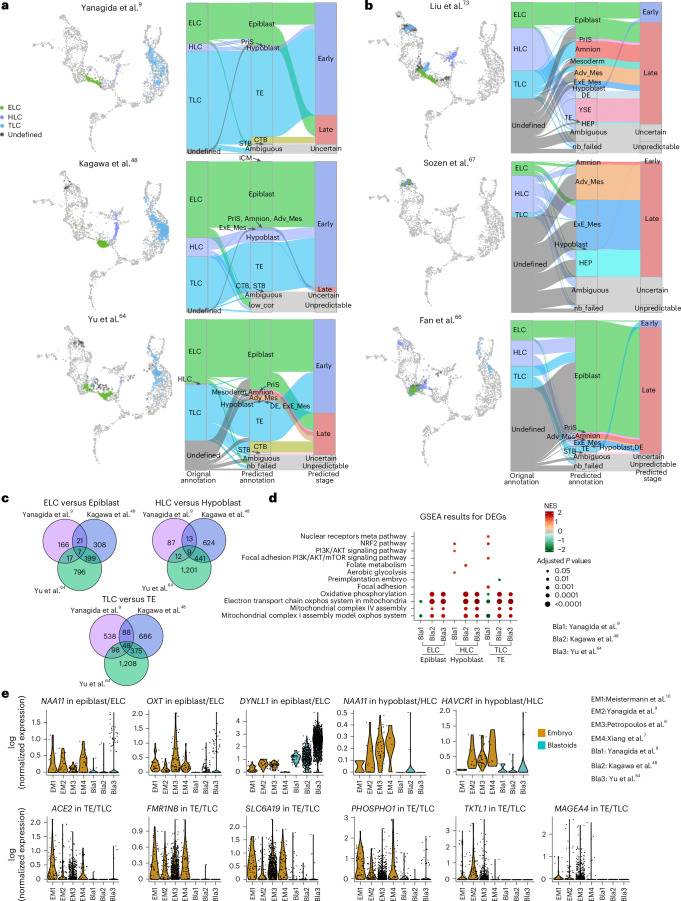
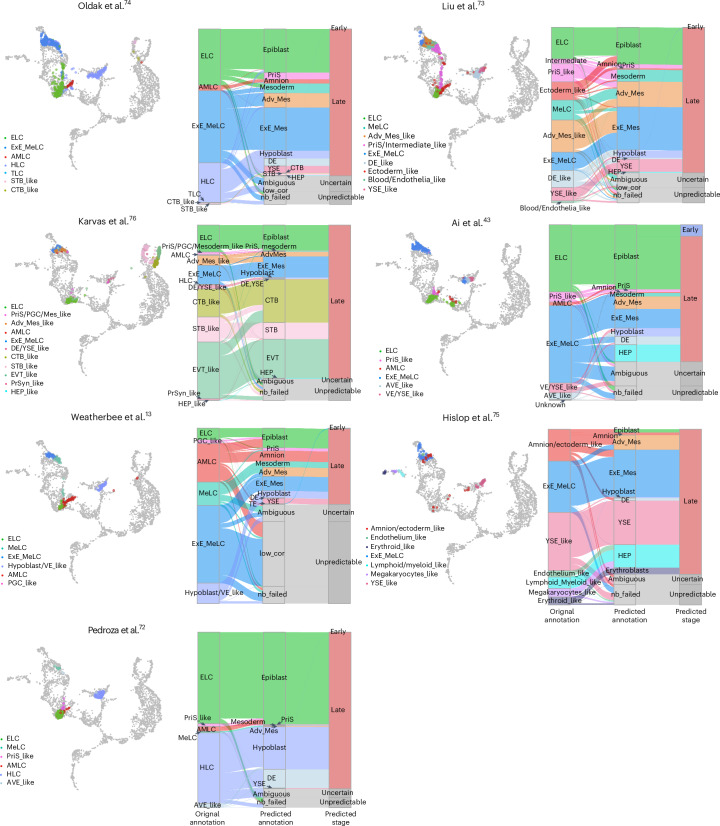
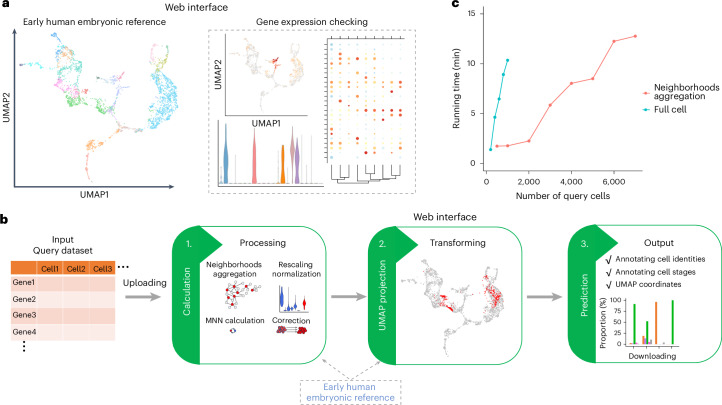
Stem cell-based embryo models offer unprecedented experimental tools for studying early human development. The usefulness of embryo models hinges on their molecular, cellular and structural fidelities to their in vivo counterparts. To authenticate human embryo models, single-cell RNA sequencing has been utilized for unbiased transcriptional profiling. However, an organized and integrated human single-cell RNA-sequencing dataset, serving as a universal reference for benchmarking human embryo models, remains unavailable. Here we developed such a reference through the integration of six published human datasets covering development from the zygote to the gastrula. Lineage annotations are contrasted and validated with available human and nonhuman primate datasets. Using stabilized Uniform Manifold Approximation and Projection, we constructed an early embryogenesis prediction tool, where query datasets can be projected on the reference and annotated with predicted cell identities. Using this reference tool, we examined published human embryo models, highlighting the risk of misannotation when relevant references are not utilized for benchmarking and authentication.


Conflict of interest statement

Competing interests: J. Fu is an editor of NPJ Regenerative Medicine. The other authors declare no competing interests.

Figures

Fig. 1
Fig. 1. Construction of a human embryonic reference from zygote to the gastrula.
a, A UMAP projection of the integration of six embryonic datasets. The color of each data point represents the source of the data. b, Similar to a, but the color indicates the cell annotations retrieved from each publication. c, Cells from different embryonic time points are highlighted on the human embryonic reference. d, A dot plot illustrating the expression of the top five lineage-specific genes used in the human embryonic reference. The size and colors of dots indicate the proportion of cells expressing the corresponding genes and scaled values of log-transformed expression, respectively. Source data
Fig. 2
Fig. 2. Validation of the early embryogenesis prediction tool.
a, The processing workflow to project query cells onto the reference and cell type prediction. (1) Query data underwent rescaled normalization to ensure that expression values were comparable with the reference datasets. This step was taken after deciding whether to aggregate cells into neighborhoods for low-depth, large datasets. Cosine normalization of query expression involved removing the same grand center values from reference calculations and performing a dot product calculation with the left singular vectors (U) obtained from singular value decomposition during reference construction. (2) Orthogonalization removes variation along the reference batch correction vector, projecting onto the reference PCA subspace. Simultaneously, the query dataset was divided into smaller samples consisting of 200 cells, repeated five times, to calculate MNN pairs with the reference datasets separately. Uncertain MNN pairs were removed. Using the filtered MNN pairs, a batch correction vector was computed to correct the PCA coordination of the query dataset. (3) UMAP embedding was transformed using the UMAP model calculated from the reference (ref) dataset. Cell identities were predicted using the SVM models trained on the reference datasets within the same latent space after UMAP transformation. TE, trophectoderm; Am, amnion; r, repeat times. b, Projection of five embryonic datasets onto the human embryonic reference. The color represents the cell annotations for each publication. The light-gray points represent cells used in embryonic reference construction. c, An alluvial plot comparing the original cell type to the predicted identities from the early embryogenesis prediction tool. Predictions identified as ‘ambiguous’ or ‘nb_failed’ represent cells with uncertain predictions or cells that fail to form neighborhoods, respectively. d, Prediction precision and recall ratio for each cell type in the embryonic datasets. The shape and color indicate queried cell types and data sources, respectively. ysTE, yolk sac TE; VE/YE, visceral/yolk endoderm; AVE, anterior VE. Source data
Fig. 3
Fig. 3. Application of the early embryogenesis prediction tool on stem cell models.
a, The projection of naive, primed and Okae cells from Kagawa et al. onto the reference. The color of each data point represent the cell identity and gray cells the reference. b, The projection of naive or primed hPS cell-derived TLCs. c, A bar plot showing the proportion of predicted cell identities for naive and primed hPS cell-derived cells. d, A Venn diagram showing the overlap of DEGs between naive or primed-derived preimplantation TLCs and embryonic preimplantation TE cells. e, A heat map showing the expression of DEGs in preimplantation TLCs and embryonic preimplantation TE cells. The DEGs were conserved in all three naive hPS cell-derived TLC comparisons or conserved in all three primed hPS cell-derived TLC comparisons, primed hPS cell-derived TLCs and embryonic TE cells. f,g, The projection of cells (neighborhood nodes) from two studies modeling ExE_Mes cells and PASE. A bar plot showing the proportion of predicted cell identities stratified by cell types or time point. h,i, The projection of cells (neighborhood nodes) from two studies modeling 8CLCs. A bar plot showing the proportion of predicted cell identities stratified by cell original annotation. EPI, epiblast; PE, primitive endoderm; TSC, trophoblast stem cells; ExE_MeLC, extraembryonic mesoderm-like cell; PGC_like, PGC-like cell; MeLC, mesoderm-like cell; AMLC, amnion-like cells; 4CL, 4 chemicals + leukemia inhibitory factor (LIF) medium; e4CL, enhanced 4CL medium; DOX, doxycycline. Source data
Fig. 4
Fig. 4. Application of early embryogenesis prediction tools on preimplantation blastoid models.
a,b, The projection of blastoid cells (or neighborhood nodes) onto the human embryonic reference in naive-derived blastoids (a) and reprogrammed or EPS cell-derived blastoids (b). The color of each data point represents the cell annotations retrieved or restored for each publication. Light gray data points indicate cells used in embryonic reference construction. An alluvial plot comparing original cell-type annotations (ELC, HLC and TLC from the six blastoids) to the predicted identities obtained from the early embryogenesis prediction tool. c, A Venn diagram showing the overlaps of DEGs between blastoids with preimplantation embryonic lineages for three naive-derived blastoids. d, Selected significant Wikipathways demonstrating differences among the three naive-derived blastoids (Bla1–3) and preimplantation embryos from the embryonic reference, stratified by lineage. The colors indicate the normalized enrichment score (NES) and the size represents the Benjamini–Hochberg-adjusted P values from one-sided tests. e, Violin plots showing the expression of representative DEGs between blastoids (Bla1–3) and embryonic references (EM1–4). low_cor, low-correlation filtered. Source data
Fig. 5
Fig. 5. Application of early embryogenesis prediction tools on postimplantation blastoid models.
The projection of blastoid cells (or neighborhood nodes) onto the human embryonic reference (left side of each reference image). The color of each data point represents the cell annotations retrieved or restored for each publication. The light gray data points indicate cells used in embryonic reference construction (right side of each reference image). The alluvial plots compare original cell-type annotations to the predicted identities obtained from the early embryogenesis prediction tool. ExE_MeLC, extraembryonic mesoderm-like cell; PGC_like, PGC-like cell; MeLC, mesoderm-like cell; AMLC, amnion-like cells; STB_like, STB-like cells; CTB_like, CTB-like cells; YSE_like, YSE-like cell; EVT, EVT-like cell; HEP_like, HEP-like cell; PriS_like, PriS-like cell; AVE_like, anterior VE-like cell; VE, VE-like cell; PrSyn_like, primitive syncytium-like cell; DE_like, definitive endoderm-like cells; AdvMes_like, advanced mesoderm-like cells; Blood/Endothelia_like, blood/endothelia-like cells; PriS/Intermediate like, primitive streak/intermediate-like cells; Ectoderm_like, ectoderm-like cells. Source data
Fig. 6
Fig. 6. Web interface for our online resources.
a, A schematic of the web interface for the human embryonic reference. b, A schematic of the web interface for the early embryogenesis prediction tool. c, The running time for webtool with different numbers of query cells. Source data
Extended Data Fig. 1
Extended Data Fig. 1. Clusters and regulon activity within the human embryonic reference.
a, UMAP projection used in Fig. 1a shown by each embryonic dataset separately, colour of each data point indicates the cell annotations. b, Unassigned cluster distribution of UMAP used in Fig. 1a. c, Cell distribution in clusters for epiblast and hypoblast cells. d, Heatmap showing expression of DEGs between early and late epiblast, early and late hypoblast and DEGs among TE, CTB, STB and EVT. e, Heatmap displaying average AUC values of top 5 enriched regulons within each lineage. f, Highlighted first-wave amnion cells from Xiang et al. 2020 (based on the annotation from Rostovskaya et al., 2022). Abbreviations, hsPostEPI-AME: intermediates between epiblast and amnion cells; hsAME-E: early amniotic epithelium. Source data
Extended Data Fig. 2
Extended Data Fig. 2. Transcription factor gene expression along the epiblast, hypoblast, and TE trajectories.
a, Principle curves, and trajectories constructed from slingshot. b, Heatmap of expression of transcription factor (TF) genes which were significantly related to trajectories pseudotime. Cluster pattern of expression was indicated on the left with numbers indicating the number of TF genes. c, Joint heatmap showing expression of TF genes related to epiblast/TE trajectories and epiblast/hypoblast trajectories. The black and white annotation on the left indicated whether corresponding TF were significantly related to pseudotime. d, Expression dynamics (pseudotime) of selected transcriptional factor genes along three main trajectories. The confidence interval (error bands, 95%) is indicated by bandwidth. The measure of center and confidence intervals were calculated using the ‘loess’ function with default parameters in R software. Different trajectories are indicated by colours, respectively. Source data
Extended Data Fig. 3
Extended Data Fig. 3. Cross-species integration involving cells from early human, cynomolgus monkey, and marmoset embryos.
a, UMAP projection of the integrated datasets from six human, three cynomolgus monkey, and two marmoset embryos. Each data point’s colour corresponds to the cell annotations retrieved from each publication. b, Similar to (a), but the colour represents the species of the data. c, Highlights cells from each lineage belonging to their respective species in the cross-species integration. d, Expression of the top 10 lineage marker genes conserved in primate species. Abbreviations, ICM: inner cell mass; TE: trophectoderm; CTB: Cytotrophoblast; STB: Syncytiotrophoblast; EVT: Extravillous trophoblast; PriS: primitive streak; AdvMes: advanced mesoderm; DE: definitive endoderm; ExE_Mes:extraembryonic mesoderm; YSE: yolk sac endoderm; HEP: haemato-endothelial progenitors; EmDisc: embryonic disc; VE: visceral endoderm; SYS: secondary yolk sac; Gast: ‘Gastrula’; ExE_mech: extraembryonic mesenchyme. Source data
Extended Data Fig. 4
Extended Data Fig. 4. Parameter selection for processing workflow.
a. Precision and recall ratios for aligned MNN pairs between the Ai et al., 2023 embryonic datasets and reference embryonic datasets under different parameters, including ‘prop’ (the proportion of randomly sampling during neighbourhood aggregation), ‘K’ (the number of neighbours considered), and downsampling size. The F-score values are shown on the plot. The colour of each data point represents the cell annotations from the Ai et al., 2023 embryonic dataset. b. CPU running time for MNN calculation under different ‘prop’ values and downsampling sizes. Here, ‘K’ was arbitrarily set to 30 as we determined this value had minimal influence on running time. c. Prediction precision and recall ratios for each cell type from all embryonic datasets using models trained with different numbers of dimensions. The colour of each data point represents the cell types. Performance metrics for the same cell types from different embryonic datasets were averaged. d. Prediction precision and recall ratios for each cell type using SingleR, scMap, and ScType. e, Prediction precision and recall ratio for merged cell types in the embryonic datasets. The shape and colour of data points indicate queried cell types and data sources, respectively. f. Shown the top 20 mean correlation coefficients of each cell from each dataset. The embryonic datasets are coloured blue, while irrelevant datasets are coloured grey. The boxplot rectangles represent the first and third quartiles, with whiskers extending 1.5 times the interquartile range above and below the box. A horizontal line inside the box indicates the median value. Outliers are indicated as dots. Source data
Extended Data Fig. 5
Extended Data Fig. 5. Module scores of cell models.
Module scores of corresponding predicted lineages in three naïve stem cells models (a), three primed stem cells models (b), two 8-cell-like models, one extraembryonic mesoderm-cell-like model, and PASE models (c). Columns represent different lineage models scores, and rows represent predicted lineages for each dataset. The predicted cell numbers are included in parentheses.
Extended Data Fig. 6
Extended Data Fig. 6. Extension of the human embryonic reference.
a, UMAP projection of the integration of eight embryonic datasets including original six embryonic datasets used in Fig. 1, spatial transcriptomics from a Carnegie stage (CS) 8 human embryo (Xiao et al., 2024) and 10X-sequenced single-cell transcriptomes of STB, EVT, and villous CTB from first-trimester placentas (Vento-Tormo et al., 2018). Colour of each data point indicates the cell annotations. b, Projection of six datasets that use naïve or primed cells to model TLCs. The colour of each data point represents whether the cells (neighbourhood nodes) are naïve, primed, or their derived cells. c. Projection of organoids derived from the first trimester (Shannon et al., 2024). Source data
Extended Data Fig. 7
Extended Data Fig. 7. UMAP projection of Mutual Nearest Neighbours (MNN) cross-species integration of blastoid models and cynomolgus macaque at Day 14.
Embryonic cells from Yanagida et al. and naïve, primed, and Okae cells from Kagawa et al. were also included in the integration. Overlay and separation by source of datasets is shown on the left and right, respectively. Colour corresponds to (Yang et al., 2021), coloured by cell type. Source data
Extended Data Fig. 8
Extended Data Fig. 8. DEG between cell models and embryo cells.
a, Heatmap displaying DEGs between early and late epiblast in primed cells, blastoids ELC cells (based on their original annotation), and naïve cells. b, Heatmap displaying DEGs between early and late hypoblast blastoids HLC cells (based on their original annotation). c, Violin plots showing log-transformed expression of key amnion and TE markers in amnion, TE, amnion-like cells (AMLC), and TLC from the six blastoids (based on their original annotation). d, Expression of DEGs between amnion and TE in embryonic amnion, TE, and TLC from the six blastoid models. For visualisation, cell types containing a large number of cells were randomly down-sampled to 200. Source data
Extended Data Fig. 9
Extended Data Fig. 9. Module score validation of predicted lineages.
a, Module score of corresponding predicted lineages in six blastoids. Columns represent different lineage models scores, and rows represent predicted lineages for each dataset. The predicted cell numbers are included in parentheses. b, Projection of most-recent blastoids from Yu et al., 2023 onto the human embryonic reference.
Extended Data Fig. 10
Extended Data Fig. 10. Analysis of post-implantation models.
a, Highlighted cells from the Day 7 blastoids (neighbourhood nodes) from Kavas et al., 2023. The colour of each data point represents the cell annotations retrieved from original publication. b, Module score of corresponding predicted lineages in seven post-implantation models. c, Presence of post-implantation lineage-like cells in post-implantation embryo models.

References

    1. Rossant, J. Why study human embryo development? Dev. Biol.509, 43–50 (2024). - PubMed
    1. Fu, J., Warmflash, A. & Lutolf, M. P. Stem-cell-based embryo models for fundamental research and translation. Nat. Mater.20, 132–144 (2020). - PMC - PubMed
    1. Rossant, J. & Tam, P. P. L. Opportunities and challenges with stem cell-based embryo models. Stem Cell Rep.16, 1031–1038 (2021). - PMC - PubMed
    1. Posfai, E. et al. Evaluating totipotency using criteria of increasing stringency. Nat. Cell Biol.23, 49–60 (2021). - PubMed
    1. Posfai, E., Lanner, F., Mulas, C. & Leitch, H. G. All models are wrong, but some are useful: establishing standards for stem cell-based embryo models. Stem Cell Rep.16, 1117–1141 (2021). - PMC - PubMed

LinkOut - more resources