. 2024 Dec;16(12):3089-3112.
doi: 10.1038/s44321-024-00169-0. Epub 2024 Nov 14.

Diagnosis and prognosis prediction of gastric cancer by high-performance serum lipidome fingerprints

Affiliations

Diagnosis and prognosis prediction of gastric cancer by high-performance serum lipidome fingerprints

Ze-Rong Cai et al. EMBO Mol Med. 2024 Dec.

Abstract

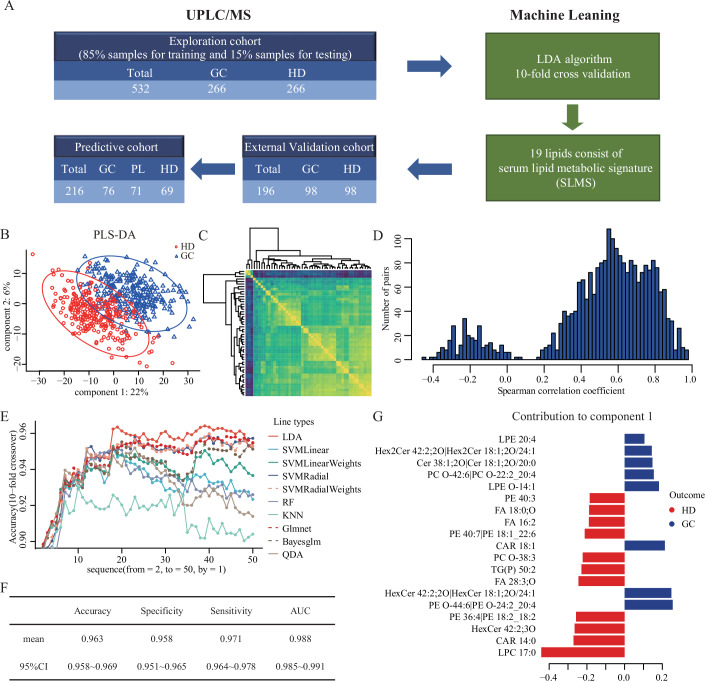
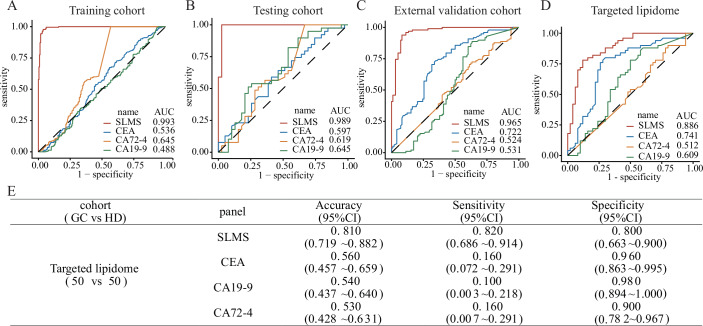
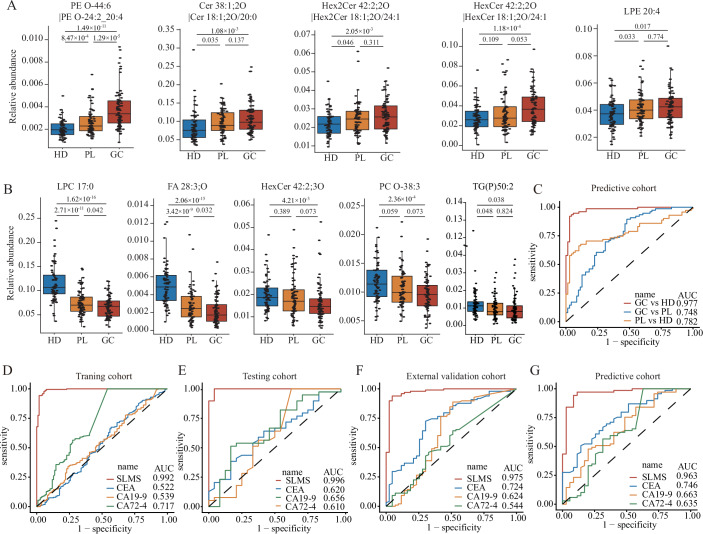
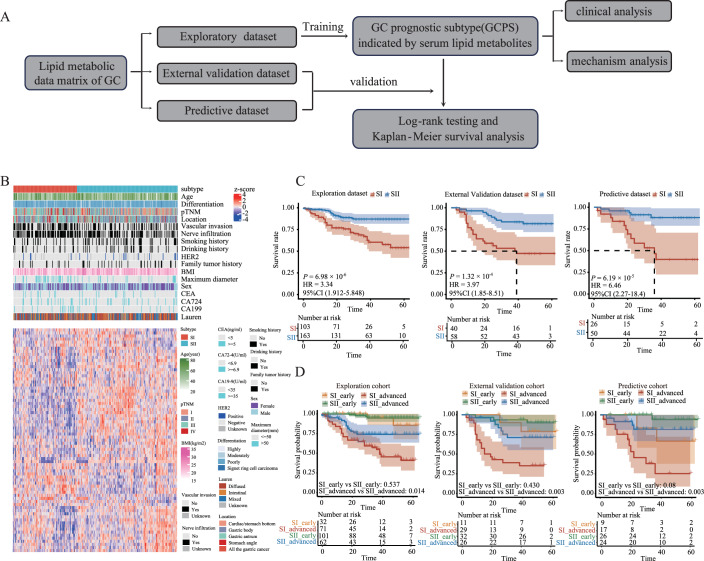
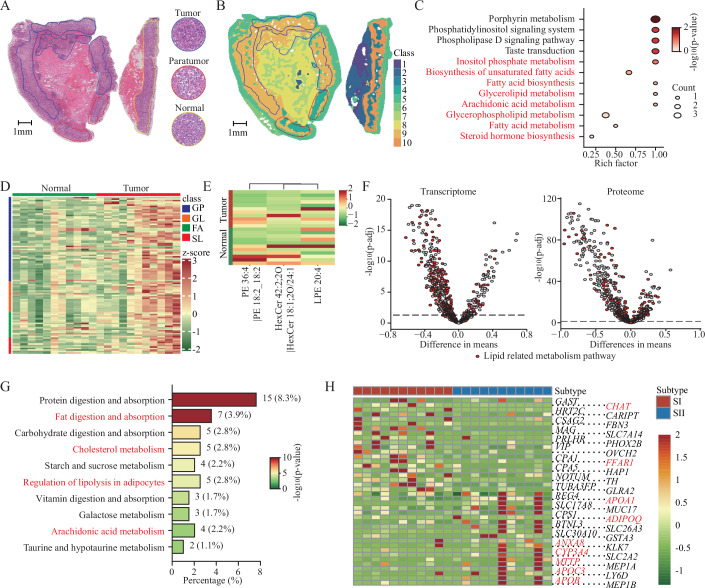
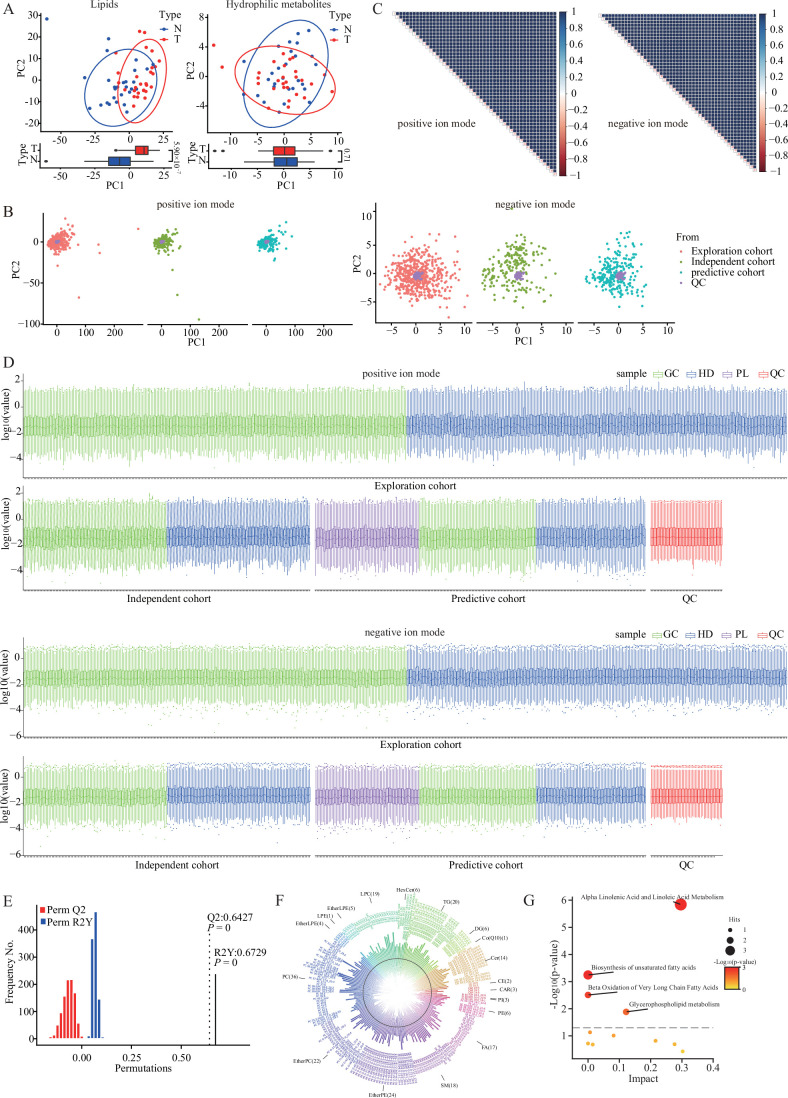
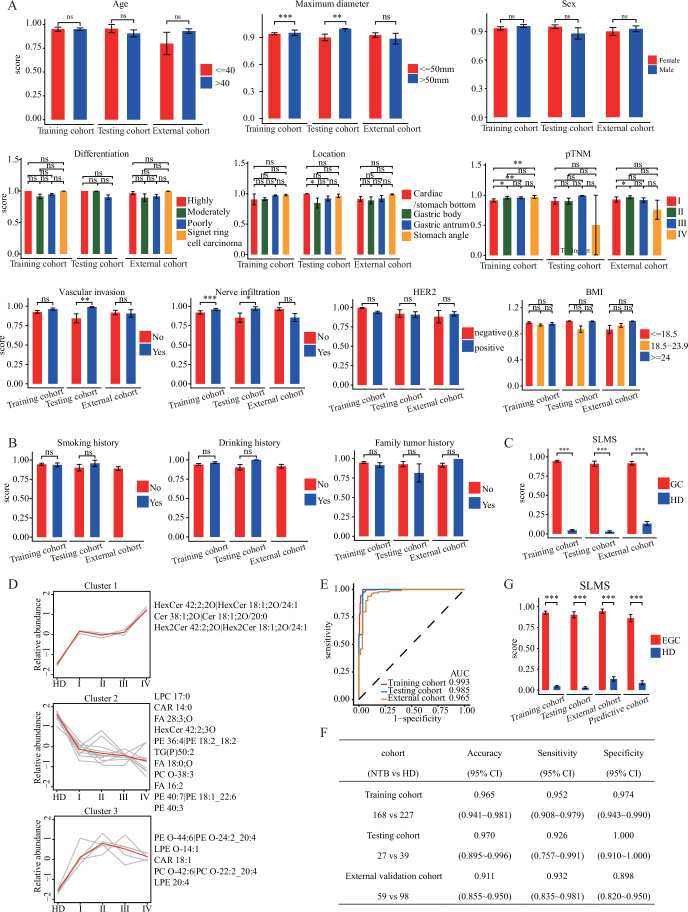
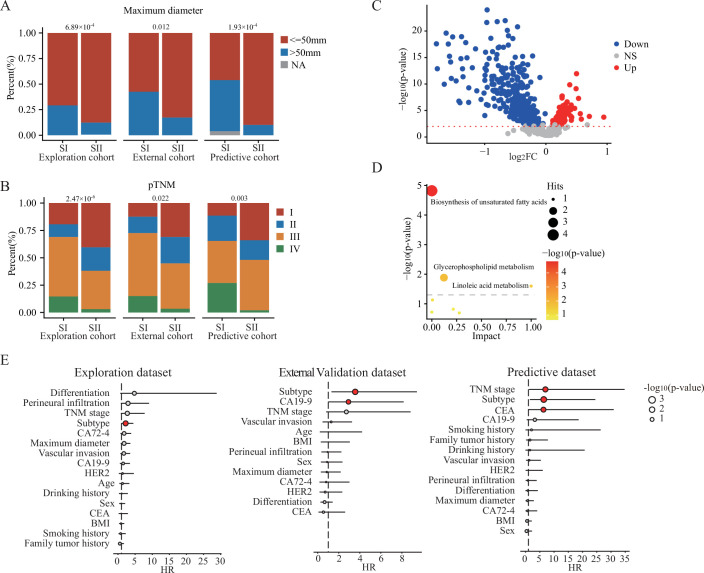
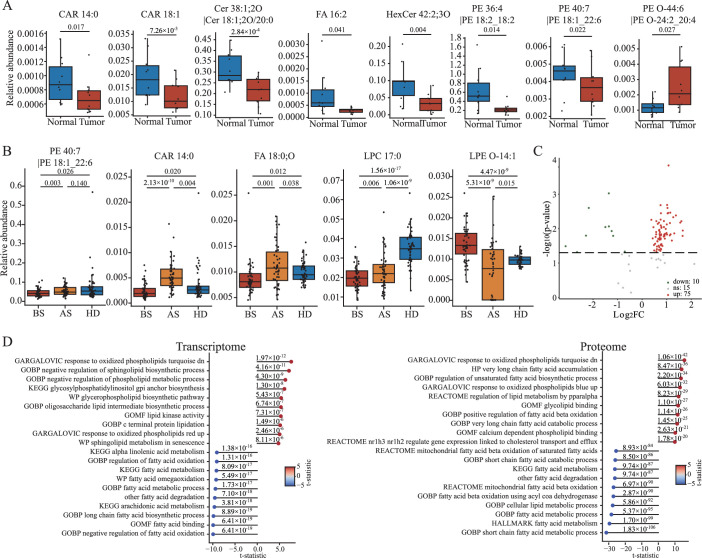
Early detection is warranted to improve prognosis of gastric cancer (GC) but remains challenging. Liquid biopsy combined with machine learning will provide new insights into diagnostic strategies of GC. Lipid metabolism reprogramming plays a crucial role in the initiation and development of tumors. Here, we integrated the lipidomics data of three cohorts (n = 944) to develop the lipid metabolic landscape of GC. We further constructed the serum lipid metabolic signature (SLMS) by machine learning, which showed great performance in distinguishing GC patients from healthy donors. Notably, the SLMS also held high efficacy in the diagnosis of early-stage GC. Besides, by performing unsupervised consensus clustering analysis on the lipid metabolic matrix of patients with GC, we generated the gastric cancer prognostic subtypes (GCPSs) with significantly different overall survival. Furthermore, the lipid metabolic disturbance in GC tissues was demonstrated by multi-omics analysis, which showed partially consistent with that in GC serums. Collectively, this study revealed an innovative strategy of liquid biopsy for the diagnosis of GC on the basis of the serum lipid metabolic fingerprints.

Keywords: Biomarker; Diagnosis; Gastric Cancer; Lipid Metabolism; Prognosis.


Conflict of interest statement

Disclosure and competing interests statement. The authors declare no competing interests. The authors have applied for patents for the use of the serum lipid metabolic signature to diagnose and predict biosamples.

Figures

Figure 1
Figure 1. Construction of the serum lipid metabolic signature for GC diagnosis.
(A) Flow diagram for the construction and validation of SLMS. (B) Partial least squares-discriminant analysis of serum lipidomics between GC patients and healthy donors in the training cohort. (C) Heatmap for correlation analysis of the expression of the top 50 lipid metabolites. (D) Histogram of the distribution of spearman’s correlation coefficients between metabolites. (E) Accuracies of 10 classification algorithms when using different numbers of metabolites. (F) Results of 10-fold crossover validation of lipidomics data from the training cohort by using LDA and top 19 lipids. (G) The 19 lipids of SLMS and their contribution to component 1, ranking small to large. Bayesglm bayesian generalized linear models, GC gastric cancer, Glmnet lasso and elastic-net regularized generalized linear model, HD healthy donor, KNN k-nearest neighbor, LDA linear discrimination analysis, PL precancerous lesion, PLS-DA partial least squares-discriminant analysis, QDA quadratic discriminant analysis, RF random forest, SLMS serum lipid metabolic signature, SVMLinear linear support vector machine, SVMLinearWeights linear support vector machine with class weights, SVMRadial support vector machine with radial basis function, SVMRadialWeights support vector machine with radial basis function and class weights, UPLC/MS ultra-high performance liquid chromatography/mass spectrometry. Source data are available online for this figure.
Figure 2
Figure 2. Validation of the diagnostic efficacy of SLMS.
(AC) The ROC curves of SLMS, CEA, CA19-9, and CA72-4 to differentiate gastric cancer patients (all stages) from healthy donors in the training, testing and external validation cohorts. (D, E) The diagnostic performance of SLMS in targeted lipidomics data. AUC area under curve, CA19-9 carbohydrate antigen 199, CA72-4 carbohydrate antigen 724, CEA carcinoembryonic antigen, CI confidence interval, HD healthy donor, ROC receiver operating characteristic, SLMS serum lipid metabolic signature.
Figure 3
Figure 3. Application of the SLMS in the early detection of GC.
(A, B) The significantly downregulated (A) and upregulated (B) metabolites during the process from HD turning to PL and GC finally (Student’s t test). The numbers of the participants in HD, PL, and GC groups were 69, 71, and 76, respectively. (C) The ROC curves of SLMS in comparing any two groups in the predictive cohort. (DG) The ROC curves of SLMS, CEA, CA19-9, and CA72-4 to differentiate GC patients in early-stage from healthy donors in the training (D), testing (E), external validation (F), and predictive cohorts (G). In the box plots of A and B, the upper bound, the line inside and the lower bound shows the 75th, 50th, and 25th percentiles of the sample while whiskers are extended to the most extreme data point that is no more than 1.5× interquartile range (75th percentile minus 25th percentile) from the edge of the box. AUC area under curve, CA19-9 carbohydrate antigen 199, CA72-4 carbohydrate antigen 724, CEA carcinoembryonic antigen, GC gastric cancer, HD healthy donor, PL precancerous lesion, ROC receiver operating characteristic, SLMS serum lipid metabolic signature.
Figure 4
Figure 4. Serum lipid metabolites can predict the prognosis of GC.
(A) Workflow for the building and validation of GCPS. (B) Patient subgrouping based on the lipids associated with prognosis (P < 0.05 for univariable variant cox analysis and spearman’s correlation coefficients less than 0.5 between lipids). Samples and lipid metabolites are displayed as columns and rows, respectively, and the color of each cell shows the z-score of the relative abundance of the lipids (logarithmic scale in base 2). (C) Kaplan‒Meier curves for OS based on the GCPS for the exploration, external validation, and predictive cohorts. (D) Prognostic analysis of the GCPS in GC patients with different stages in the exploration, external validation, and predictive cohorts. P values were determined by log-rank test (C, D). CI confidence interval, GC gastric cancer, GCPS gastric cancer prognostic subtype, HR Hazard ratio, OS overall survival.
Figure 5
Figure 5. Multi-omics analysis reveals a global lipid metabolism disturbance in GC.
(A) The H&E stain image of tissue section and magnified images of different regions (×20), scale bar = 1 mm. The region of gastric cancer, paratumor, and normal were encircled by blue, red, and yellow lines, respectively. (B) The metabolite-driven segmentation of tissue section based on the metabolome data, scale bar = 1 mm. (C) Enrichment analysis of differentially expressed metabolites between the GC regions and the normal regions. (D) Heatmap showing the lipids that were differentially expressed between GC and normal regions. (E) A hierarchical clustering plot and heatmap showing the global abundance of lipids in SLMS between GC and normal tissues. (F) Volcano plots showing the changes of metabolic pathways in GC through transcriptome analysis (380 GC tissues vs 37 normal tissues) and proteome analysis (194 GC tissues vs 194 normal tissues). (G) Bar plot of the KEGG pathway map enriched by differentially expressed genes between two prognostic subtypes. (H) Heatmap of differentially expressed druggable targets between prognostic subtypes. The pathways (G) and genes (H) in red color are associated with the metabolism and transport of lipids. The expression levels of metabolites or genes in (D), (E), and (H) are represented as row-normalized z-scores. P values were determined by Hypergeometric test (C, G), Student’s t-test (D, F), Paired t-test (E), and Deseq2 (H). FA fatty acids, GC gastric cancer, GP glycerophospholipids, GL glycerolipids, H&E hematoxylin and eosin, KEGG Kyoto Encyclopedia of Genes and Genomes, p-adj adjusted P value for multiple testing via the Benjamini-Hochberg procedure, SL sphingolipid, SLMS serum lipid metabolic signature.
Figure EV1
Figure EV1. The analysis of preliminary experiment data and quality control data.
(A) PCA on the lipid data or hydrophilic metabolite data of GC patients (n = 28) and healthy donors (n = 28). (B) PCA on the participant samples and QC samples showed that the QC samples were highly correlated. (C) Spearman’s correlation coefficients between QC runs, ranging from 0.97 to 1, demonstrated the high stability and reproducibility of data. (D) Intensity distribution of lipid species indicated that QC samples (n = 49) had good consistency with participant samples in quantification of serum lipid levels; The sample numbers of GC, HD, and PL groups have been shown in Fig. 1A. (E) The validity of the partial least squares-discriminant analysis in Fig. 1B showed no overfitting (permutation test, n = 1000). Q2 measures the predictive ability of the model, while R2Y measures the goodness of fit. (F) The significantly changed lipids between GC patients and healthy donors. The classes of lipids are displayed in different colors. The black circle indicates 0 of the lipid level and the height of the bar represents the normalized lipid levels. The direction of bars pointing towards and away from the center represents the lipid level of healthy donors and GC patients, respectively. (G) The pathway enriched by the significantly changed lipid in serums (Hypergeometric test). The definitions of box plots in (A) and (D) were consistent with those in Fig. 3A,B. PCA principal component analysis, PC principal component, QC quality control, GC gastric cancer, HD healthy donor, PL precancerous lesion.
Figure EV2
Figure EV2. The influence factor of the score of SLMS.
(A) The SLMS scores of GC patients were compared between different stratification of age, maximum diameter, sex, differentiation, location, pTNM, vascular invasion, nerve infiltration, HER2 and BMI in the training, testing and external validation cohorts. (B) The SLMS scores of GC patients were compared between different stratification of smoking history, drinking history and family tumor history in the training, testing, and external validation cohorts. (C) The difference between the SLMS score of GC patients and that of HDs in the training, testing, and external validation cohorts. (D) Mfuzz clustering of lipid trajectories during GC progression using 19 lipids according to the lipid changes’ similarity. Lipids in each cluster are presented on the side. HD, healthy donor. (E, F) The diagnostic performance of SLMS when used in detecting GC patients with negative CEA, CA19-9, and CA72-4. (G) The difference between the SLMS score of EGC patients and that of HDs in the training, testing, external validation, and predictive cohorts. P values were determined by Wilcox test and Data presented as the mean ± S.D. (A, B, C, G). CA19-9 carbohydrate antigen 199, CA72-4 carbohydrate antigen 724, CEA carcinoembryonic antigen, CI confidence interval, EGC early-stage gastric cancer, GC gastric cancer, HD healthy donor, NTB negative for three biomarkers, SLMS serum lipid metabolic signature, ns non-significant; ***P < 0.001; **P < 0.01; *P < 0.05. Source data are available online for this figure.
Figure EV3
Figure EV3. Characterization of GCPS.
(A) The overlap between GCPS and maximum diameter. (B) The overlap between GCPS and pTNM stage. (C) Volcano plot comparing different lipids between SI and SII. (D) Enrichment analysis of different lipids between SI and SII. Hits are indicated by the size of the circle and significance is indicated by the color of the circle. (E) Multivariate Cox proportional hazards analyses of OS in patients with gastric cancer in three cohorts. The circles in red color indicated the P value was less than 0.05. P values were determined by Chi-square test (A, B), Wilcox test (C), Hypergeometric test (D), and Wald test (E). GCPS gastric cancer prognostic subtype, NS non-significant, OS overall survival, pTNM pathological Tumor-Node-Metastasis.
Figure EV4
Figure EV4. Analysis of the metabolites in SLMS.
(A) The significantly changed metabolites between gastric cancer (n = 10) and normal tissues (n = 10). (B) Metabolites that partially or completely return to normal levels after surgery (n = 50 per group). (C) Volcano plot showing the lipids that were differentially expressed between GC and normal regions. (D) Top 10 lipid-related metabolic pathways highly expressed in cancer tissues and normal tissues according to the transcriptome and proteome analysis. P values were determined by T test (AD) and adjusted via the Benjamini-Hochberg procedure (D). The definitions of box plots in (A) and (B) were consistent with those in Fig. 3A,B. AS after surgery, BS before surgery, HD healthy donor, SLMS serum lipid metabolic signature.
Figure EV5
Figure EV5. The global metabolic landscape of patients with gastric cancer.
H&E stain image and metabolite-driven segmentation of contiguous gastric cancer tissue sections. Scale bar = 1 mm. The blue, red, and yellow areas represent tumor, paratumor, and normal regions, respectively.

References

    1. Bose S, Allen AE, Locasale JW (2020) The molecular link from diet to cancer cell metabolism. Mol Cell 78:1034–1044 - PMC - PubMed
    1. Bradley SH, Barclay ME (2021) “Liquid biopsy” for cancer screening. BMJ 372:m4933 - PubMed
    1. Butler LM, Perone Y, Dehairs J, Lupien LE, de Laat V, Talebi A, Loda M, Kinlaw WB, Swinnen JV (2020) Lipids and cancer: emerging roles in pathogenesis, diagnosis and therapeutic intervention. Adv Drug Deliv Rev 159:245–293 - PMC - PubMed
    1. Capper D, Jones DTW, Sill M, Hovestadt V, Schrimpf D, Sturm D, Koelsche C, Sahm F, Chavez L, Reuss DE et al (2018) DNA methylation-based classification of central nervous system tumours. Nature 555:469–474 - PMC - PubMed
    1. Chen H, Zhou H, Liang Y, Huang Z, Yang S, Wang X, She Z, Wei Z, Zhang Q (2023a) UHPLC-HRMS-based serum untargeted lipidomics: phosphatidylcholines and sphingomyelins are the main disturbed lipid markers to distinguish colorectal advanced adenoma from cancer. J Pharm Biomed Anal 234:115582 - PubMed