. 2024 Dec;43(24):6469-6495.
doi: 10.1038/s44318-024-00303-1. Epub 2024 Nov 14.

Virion morphology and on-virus spike protein structures of diverse SARS-CoV-2 variants

Affiliations

Virion morphology and on-virus spike protein structures of diverse SARS-CoV-2 variants

Zunlong Ke et al. EMBO J. 2024 Dec.

Abstract

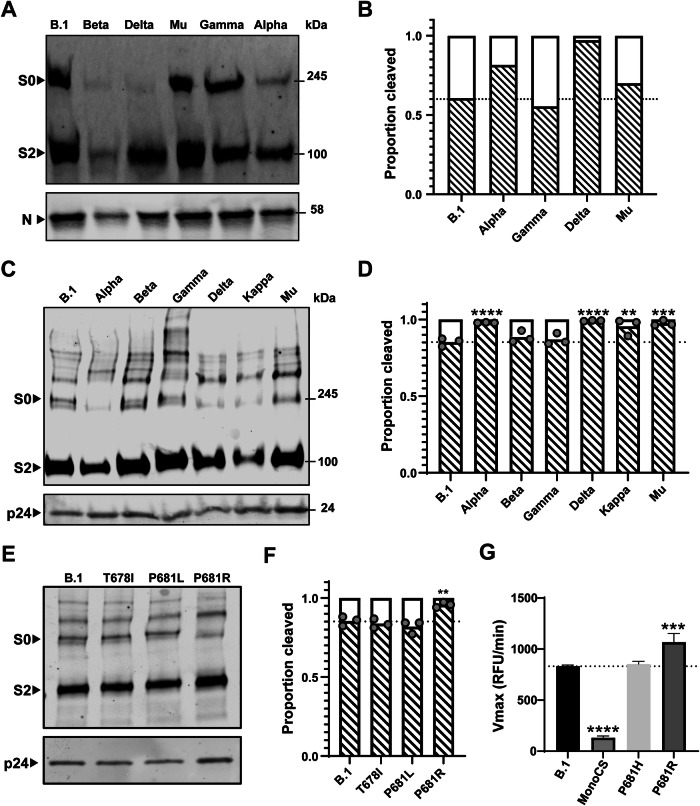
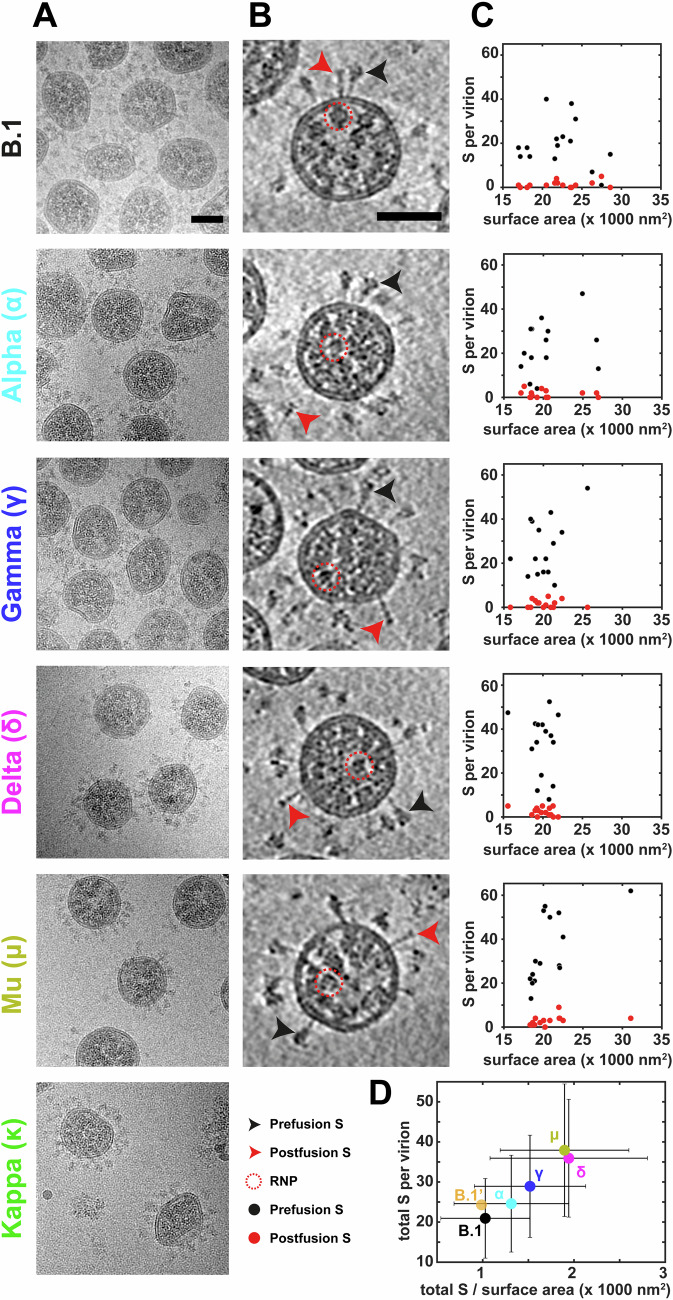
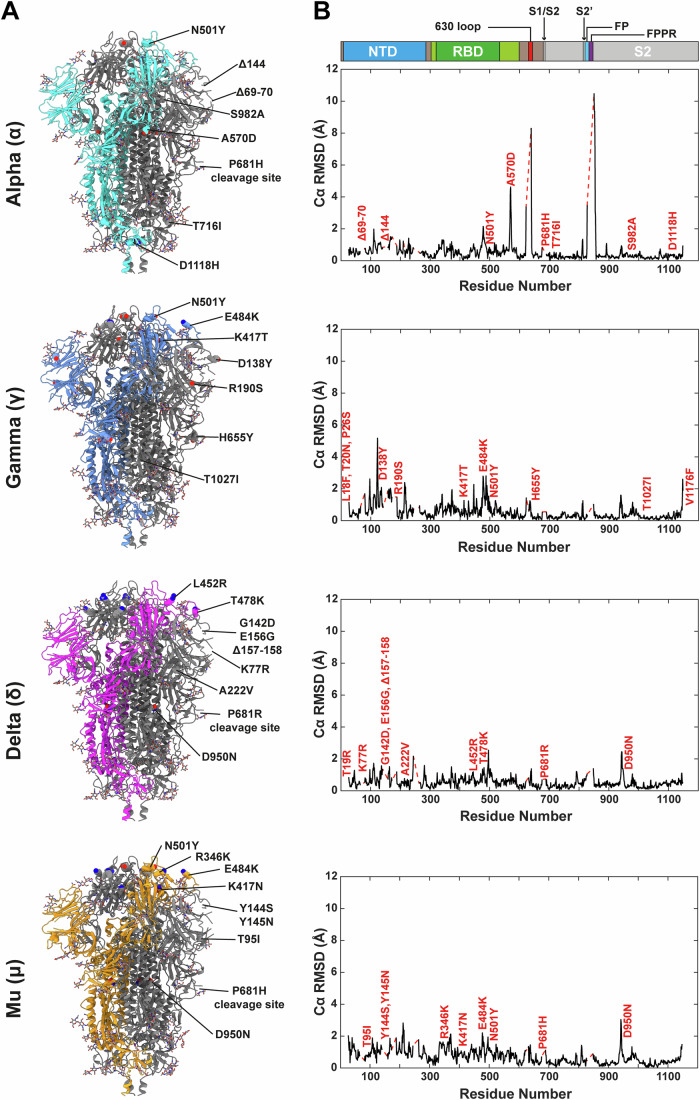
The evolution of SARS-CoV-2 variants with increased fitness has been accompanied by structural changes in the spike (S) proteins, which are the major target for the adaptive immune response. Single-particle cryo-EM analysis of soluble S protein from SARS-CoV-2 variants has revealed this structural adaptation at high resolution. The analysis of S trimers in situ on intact virions has the potential to provide more functionally relevant insights into S structure and virion morphology. Here, we characterized B.1, Alpha, Beta, Gamma, Delta, Kappa, and Mu variants by cryo-electron microscopy and tomography, assessing S cleavage, virion morphology, S incorporation, "in-situ" high-resolution S structures, and the range of S conformational states. We found no evidence for adaptive changes in virion morphology, but describe multiple different positions in the S protein where amino acid changes alter local protein structure. Taken together, our data are consistent with a model where amino acid changes at multiple positions from the top to the base of the spike cause structural changes that can modulate the conformational dynamics of the S protein.

Keywords: Coronavirus; Cryo-electron Tomography; Membrane Fusion Protein; Virus Evolution; Virus Structure.


Conflict of interest statement

Disclosure and competing interests statement. The authors declare no competing interests.

Figures

Figure 1
Figure 1. SARS-CoV-2 S characterization among variants.
(A, B) Virus cleavage patterns of the matched viruses used for cryo-EM analysis. (A) Western blot analysis indicates spike and nucleoprotein (N). S0 indicates uncleaved S and S2 is a cleaved product of S. (B) Densitometry quantification of S2/(S0 + S2) ratios. Beta variant was not quantified due to insufficient virus in the preparation. (CF) Pseudovirus cleavage patterns of the matched pseudoviruses to the variants used in this study with (C, E) western blot analysis (representative blots shown) and (D, F) quantification using densitometry of three individual repeats (N = 3). B.1 vs Alpha, P < 0.0001; B.1 vs Beta, P = 0.601; B.1 vs Gamma, P = 0.976; B.1 vs Delta, P < 0.0001; B.1 vs Kappa, P = 0.0011; B.1 vs Mu, P = 0.0001. B.1 vs T678I, P = 0.824; B.1 vs P681L, P = 0.379; B.1 vs P681R, P = 0.008. (C, D) show whole variant spikes while (E, F) show glycosylation mutants. HIV p24 used as a loading control throughout. (G) Cleavage of SARS-CoV-2 spike S1/S2 fluorogenic peptide mimetics by recombinant furin, plotted as maximum enzymatic activity (Vmax). All assays performed in technical triplicates (N = 3) with a representative repeat from three completely independent repeats (N = 3) shown. Graph plotted as mean + Standard deviation. WT vs MonoCS, P < 0.0001; WT vs P681H, P = 0.886; WT vs P681R, P = 0.0006. Statistics throughout this figure performed by one-way ANOVA with multiple comparisons against B.1 plotted on the graph. **0.01 ≥ P > 0.001; ***0.001 ≥ P > 0.0001; ****P ≤ 0.0001. Source data are available online for this figure.
Figure 2
Figure 2. Virion morphology characterization and S incorporation among variants.
(A, B) Virion morphology as observed in 2D projections obtained by cryo-EM (A) and in slices through 3D reconstructions obtained by cryo-ET (B). (B) Representative prefusion S (black arrowhead), postfusion S (red arrowhead), and ribonucleoprotein (RNP) (dotted circle) are indicated, see key. The scale bars are 50 nm in (A, B). (C) Plots showing the number of prefusion (black) and postfusion (red) S trimers per virion against the virion surface area for each of 5 variants. Each data point represents a single virion from 3D tomograms (n = 15). (D) Summary of the total S per virion versus S per unit surface area (per 1000 nm2). The Greek letters represent the variant names as in (A). B.1’ indicates the results from an independent preparation described in our previous study (Ke et al, 2020). The dot represents the mean and the error bars in both directions represent standard deviation for n = 15 virus particles. Source data are available online for this figure.
Figure 3
Figure 3. Mutation-induced structural variations among variants.
(A) Spike mutations mapped onto the respective variants. A single chain is colored in each model and the mutations are marked with ball representations. (B) The Cα RMSD (Å) between the atomic models of each variant and the B.1 variant (right panels) plotted against residue number. The linear domain architecture of S is included for orientation. See also Fig. EV1. The positions of amino acid variations are marked on the Cα RMSD plots. Unmodelled gaps are indicated by red dashed lines.
Figure 4
Figure 4. Structural comparison of the NTD and RBD between B.1 and variants.
(A, B) NTD and RBD from each variant were locally aligned to B.1 (gray color). Amino acid differences between variants are labeled. Dashed lines represent unresolved regions, indicating structural heterogeneity. Key mutations are labeled and represented as stick model. (C) In the Mu variant, the NTD (right domain), is found in two different positions relative to the RBD (left domain). One position represents the closed state (orange) and another the locked state (pink). In the locked state, the NTD is ~10 Å closer to the RBD than in the closed state, permitting the formation of a salt bridge between K113 and E471. Dashed lines indicate unresolved regions. (D) The locked state of Mu does not contain any density at the previously described binding site of linoleic acid (LA) [PDB 6ZB5].
Figure 5
Figure 5. Structural changes modulated by A570D.
Four structures are illustrated: B.1 closed (A), Alpha closed (B), B.1 open (C), chain A is open chain), and Alpha open (D), chain A is open chain). Refer also to Figure EV4. The 630 loop (617–644) is in red, FPPR (823–862) is in magenta, 570 hairpin (565–575) is in yellow. Note, the α-helix (848–856) in B.1 closed structure (A) is changed to β-strand in Alpha closed structure (B). In addition, the A570D mutation leads to a new salt bridge formation between K854 and D570 in the Alpha variant in both closed (B) and open (D) states.
Figure 6
Figure 6. Structural changes induced by D950N and D1118H.
(A) Overall structure of B.1 S (light gray) with indicated positions of D950N from Delta (δ) and Mu (µ) and D1118H from Alpha (α). Residues 926–955 are colored for each variant: cyan is Alpha, blue is Gamma, magenta is Delta, and gold is Mu. The red box indicates the location of the region shown in (B, C). (B, left) D950N mutation in Delta (magenta) and Mu (gold) variants induces a structural shift in the 940–945 loop relative to B.1 (light gray), while Alpha (cyan) and Gamma (blue) variants (without D950N mutation) remain structurally similar. The positions of residues 940 and 945 are marked in (B, right). (B, right) D950N mutation and structural comparison between B.1 and Mu. Note 936–940 fusion core helix at HR1 remain unchanged upon D950N mutation while the side-chain rotamer for K947 differs between B.1 and Mu. (C) Model-map density fit for regions shown in (B). Left shows density map for B.1 closed and right is Mu closed. (DG) Effect of D1118H mutation in Alpha variant. The structures shown are color-coded with the names indicated on the top of each panel. Chain A is the open-RBD chain. (D) Comparison between B.1 and Alpha closed structures. Bottom-up view from the viral membrane. The “upwards” conformation of H1118 in Alpha coordinates an ion, likely to be Zn2+, which is absent in B.1. The downwards conformation of H1118 is illustrated in Fig. EV5. (E) 90° tilted view of D. (F) The same view as in (D) but with Alpha open structure illustrated in green. (G) Same view as in (F) showing the predominant conformations of H1118 in the open form of Alpha: down, chain A; up, chains B and C. The closed conformation of Alpha from panel (E) is superimposed in blue for comparison.
Figure EV1
Figure EV1. SARS-CoV-2 S mutations and the phylogenetic tree.
(A) S structure side and top views. One of the three chains is color-coded according to the color scheme in (B) to illustrate the positions of the structural features that are discussed in the manuscript. (B) Mutations in S for the variants investigated in this study. Variants are indicated using both WHO labels (Greek letters) and PANGO lineage nomenclatures. Δ indicates amino acid deletions. Secondary structures are color-coded in the index strain (Wuhan-Hu-1) and the residue numbers are marked in the panel. NTD, N-terminal domain; RBD, receptor binding domain; CTD, C-terminal domain; 630 loop, a loop which contains residues 617–644; S1/S2, furin cleavage site; S2’, S2’ cleavage site; FP, fusion peptide; FPPR, furin peptide proximal region; HR1, heptad repeat 1; CH, central helix; CD, connector domain; HR2, heptad repeat 2. (C) Neighbor-joining phylogenetic tree of SARS-CoV-2 variants investigated in this study, together with the Omicron BA.1 variant. Scale bar refers to a phylogenetic distance of nucleotide substitutions per site.
Figure EV2
Figure EV2. Virion diameter quantification.
(A) The table summarizes the mean numbers of prefusion S, postfusion S, virion diameter (in 3D and 2D measurements), and number of S trimers per unit surface area (per 1000 nm2). Values are presented as mean ± SD; The number of virions used for quantification is in the column header. (B, C) Virion diameter measurements from 3D tomographic reconstructions (B) and 2D projections (C). The n indicates number of virions used for quantification. The box plot represents mean ± SD. A comparative statistical analysis between strains was not performed, because we cannot take possible variation between virus preparations into account. On each box, the central mark (red line) indicates the median, and the bottom and top edges of the box indicate the 25th and 75th percentiles, respectively. The whiskers extend to the most extreme data points not considered outliers. Outliers are plotted individually using the ‘+‘ marker symbol.
Figure EV3
Figure EV3. B-factor analysis of S structures.
(A, B) The modeled structures are color-coded according to the residue specific B-factors from 40 Å2 (blue) to 100 Å2 (red). S is shown from the side in cartoon (left column, A) and as a top view with the EM map surface colored by b-factor (right column, B). The lower the B-factor, the more rigid the protein is. In general, the S2 region is mostly rigid across all the variants, indicated by the low B-factor (blue), while the NTD and RBD are more flexible, indicated by the high B-factor (red). Note, that the Mu variant has a relatively rigid RBD while its NTD remains flexible. (C) The secondary structure of S is color-coded according to Fig. EV1.
Figure EV4
Figure EV4. Structural changes modulated by A570D illustrated for all chains.
The three individual chains (ABC) of the 4 structures (B.1 and Alpha, closed and open states) are illustrated here. Color schemes are the same as in Fig. 5. The positions of the three chains are illustrated in (A): chain A is in cyan, chain B is in orange, chain C is in blue. (AD) Panels duplicated from Fig. 5 for comparison. (EH) Contacts made by the other chains for B.1 and Alpha open states. The FPPR and interacting residues from each of the three chains from the B.1-open structure are illustrated in (C, E, G); the three chains from the Alpha open structure are illustrated in (D, F, H).
Figure EV5
Figure EV5. Structural comparison of S structures in the closed and open conformation at mutation D1118H from Alpha variant.
Left: S structure from Alpha closed state illustrates that H1118 has two conformers, one points upwards (black circle) away from the membrane, and an alternate conformation points downwards (unoccupied magenta circle) towards the membrane. Right: In the open conformation H1118 in chain A (open chain) points primarily downwards and chains B and C points upwards, while R1091 (chain A) has rotated.

References

    1. Afonine PV, Poon BK, Read RJ, Sobolev OV, Terwilliger TC, Urzhumtsev A, Adams PD (2018) Real-space refinement in PHENIX for cryo-EM and crystallography. Acta Crystallogr D Struct Biol 74:531–544 - PMC - PubMed
    1. Bai X, Rajendra E, Yang G, Shi Y, Scheres SHW (2015) Sampling the conformational space of the catalytic subunit of human γ-secretase. eLife 4:e11182 - PMC - PubMed
    1. Barnes CO, West AP, Huey-Tubman KE, Hoffmann MAG, Sharaf NG, Hoffman PR, Koranda N, Gristick HB, Gaebler C, Muecksch F et al (2020) Structures of human antibodies bound to SARS-CoV-2 spike reveal common epitopes and recurrent features of antibodies. Cell 182:828–842.e16 - PMC - PubMed
    1. Bepler T, Morin A, Rapp M, Brasch J, Shapiro L, Noble AJ, Berger B (2019) Positive-unlabeled convolutional neural networks for particle picking in cryo-electron micrographs. Nat Methods 16:1153–1160 - PMC - PubMed
    1. Brown JC, Goldhill DH, Zhou J, Peacock TP, Frise R, Goonawardane N, Baillon L, Kugathasan R, Pinto AL, McKay PF et al (2021) Increased transmission of SARS-CoV-2 lineage B.1.1.7 (VOC 2020212/01) is not accounted for by a replicative advantage in primary airway cells or antibody escape. Preprint at bioRxiv https://www.biorxiv.org/content/10.1101/2021.02.24.432576v2 - DOI

MeSH terms

Substances

Supplementary concepts

LinkOut - more resources