. 2024 Nov 14;24(1):415.
doi: 10.1186/s12871-024-02806-0.

Esophageal pressure as estimation of pleural pressure: a study in a model of eviscerated chest

Affiliations

Esophageal pressure as estimation of pleural pressure: a study in a model of eviscerated chest

Gaetano Florio et al. BMC Anesthesiol. .

Abstract

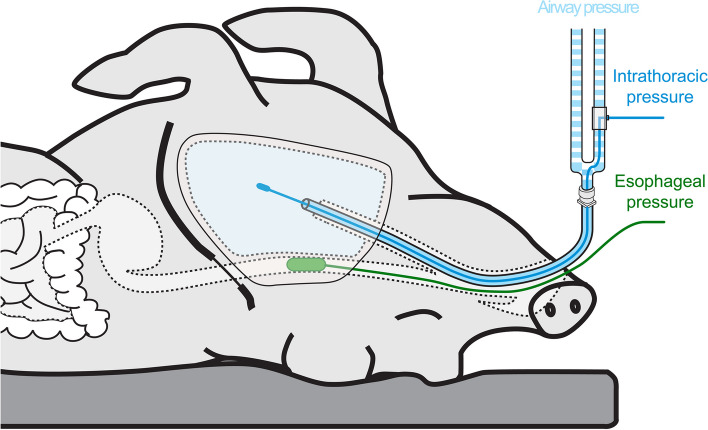
Background: Transpulmonary pressure is the effective pressure across the lung parenchyma and has been proposed as a guide for mechanical ventilation. The pleural pressure is challenging to directly measure in clinical setting and esophageal manometry using esophageal balloon catheters was suggested for estimation. However, the accuracy of using esophageal pressure to estimate pleural pressure is debated due to variability in the mechanical properties of respiratory system, esophagus and esophageal catheter. Furthermore, while a vertical pleural pressure gradient exists across lung regions, esophageal pressure balloon provides a single value, representing, at most, the pressure surrounding the esophagus.

Methods: In a swine model with a preserved esophagus and a single homogenous, easily measurable intrathoracic pressure, we evaluated esophageal pressure's agreement with intrathoracic pressure at different positive end-expiratory pressure (PEEP) levels (0, 5, 10, 15 cmH2O). We assessed the improvement of measurement accuracy by correcting absolute esophageal values using a previously described technique, that accounts for the pressure generated by the esophageal wall in response to esophageal balloon inflation. The study involved five swine, wherein two different esophageal catheters were used alongside the four distinct PEEP levels. Swings, uncorrected and corrected absolute esophageal pressures (end-inspiratory, end-expiratory) were compared with their respective intrathoracic pressures. The effect of correction technique was assessed with manual incremental step inflation procedure.

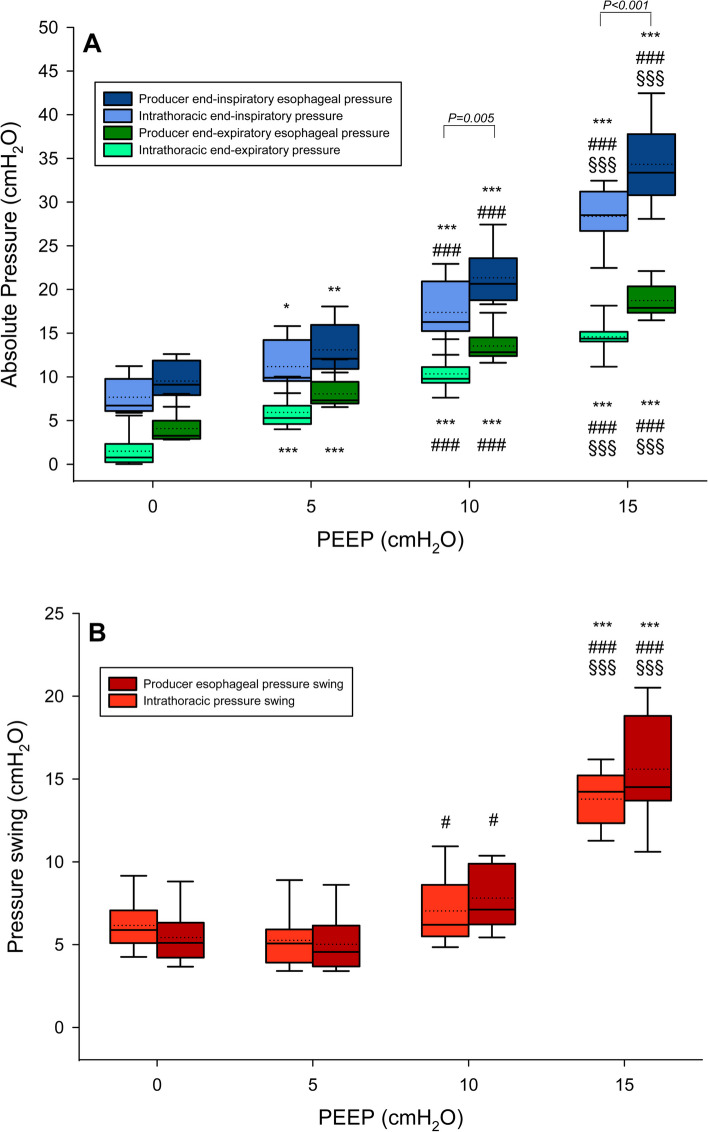
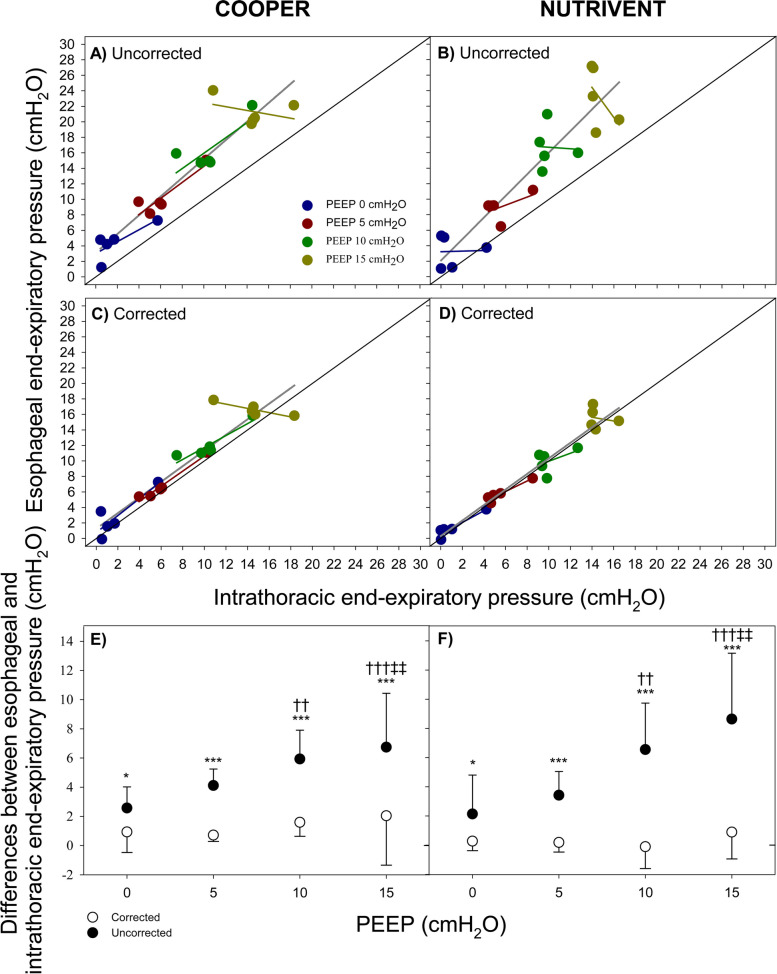
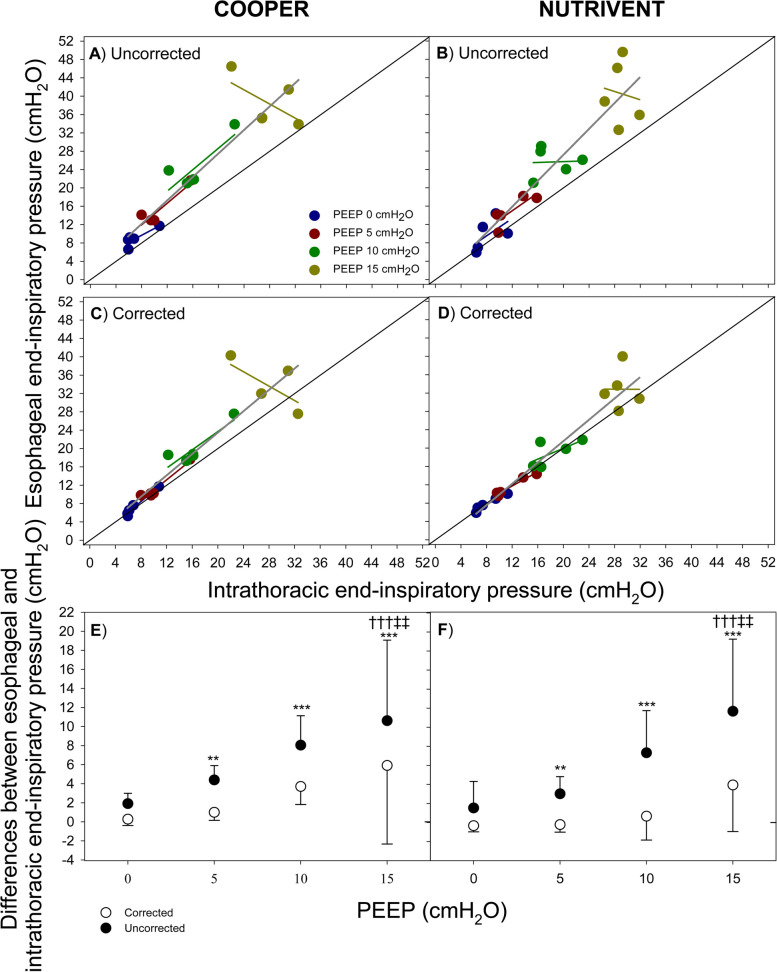
Results: We found that both catheters significantly overestimated absolute esophageal pressure compared to intrathoracic pressure (5.01 ± 3.32 and 6.06 ± 5.62 cmH2O at end-expiration and end-inspiration, respectively), with error increasing at higher positive end-expiratory pressure levels (end-expiration: 2.36 ± 2.03, 3.77 ± 1.37, 6.24 ± 2.51 and 7.69 ± 4.02 for each PEEP level, P < 0.0001; end-inspiration: 1.71 ± 2.10, 3.70 ± 1.73, 7.67 ± 3.62 and 11.14 ± 7.60 for each PEEP level, P = 0.0004). Applying the correction technique significantly improved agreement for absolute values (0.82 ± 1.62 and 1.86 ± 3.94 cmH2O at end-expiration and end-inspiration, respectively). Esophageal pressure swings accurately estimated intrathoracic pressure swings at low-medium intrathoracic pressures (-0.64 ± 0.62, -0.07 ± 0.53, 1.43 ± 1.51, and 3.45 ± 3.94 at PEEP 0, 5, 10 and 15 cmH2O, respectively; P = 0.0197).

Conclusions: The correction technique, based on the mechanical response of esophageal wall to the balloon inflation, is fundamental for obtaining reliable estimations of absolute intrathoracic pressure values, and for ensuring its correct application in clinical setting.

Keywords: Correction; Esophageal balloon; Esophageal pressure; Intrathoracic pressure; Mechanical ventilation; Transpulmonary pressure.


Conflict of interest statement

Declarations Ethics approval and consent to participate The study was approved by the Italian Ministry of Health (permit number: 463/2018-PR, June 22, 2018), thus no specifical approval was required. Consent for publication Not applicable. Competing interests Dr. Pesenti reports personal fees from Baxter, Maquet, Boehringer Ingelheim and Xenios outside the submitted work. Dr. Grasselli reports personal fees from Maquet, Draeger, Pfizer, Thermo Fisher, MSD and Gilead outside the submitted work. Dr. Mojoli reports personal fees for lectures from GE Healthcare, Seda Spa, Hamilton Medical. The remaining authors have disclosed that they do not have any potential conflict of interest.

Figures

Fig. 1
Fig. 1
Swine model of eviscerated chest. Figure shows the swine model of eviscerated chest where all the thoracic organs were removed while preserving the esophagus. The light blue area represents the inelastic plastic bag adhering to the chest wall and sealed to an endotracheal tube. The intrathoracic pressure was measured through a dedicated catheter (in blue). The esophageal pressure was measured through two different esophageal catheters (in green)
Fig. 2
Fig. 2
Distributions of esophageal (esophageal balloon inflated at Vproducer) and intrathoracic pressure at different PEEP levels. Boxplot representation at different PEEP levels of absolute esophageal and intrathoracic pressures (panel A) and pressure swings (panel B) measured when the esophageal balloon was inflated at the volume suggested by the producer (4 mL for Nutrivent, 1 mL for Cooper) during the VP curves in the study population (values from both catheters together were included). Boxplots represent median, 10th, 25th, 75th and 90th percentiles as boxes with error bars; dotted lines represent the mean values. Panel A: blue boxes represent end-inspiratory esophageal pressure at the volume suggested by the producer; light-blue boxes represent intrathoracic end-inspiratory pressure; dark green boxes represent end-expiratory esophageal pressure at the volume suggested by the producer; green boxes represent intrathoracic end-expiratory pressure. Panel B: dark red boxes represent esophageal pressure swings at the volume suggested by the producer; red boxes represent intrathoracic pressure swings. * P < 0.05 vs PEEP 0 cmH2O; ** P < 0.01 vs PEEP 0 cmH2O; *** P < 0.001 vs PEEP 0 cmH2O; # P < 0.05 vs PEEP 5 cmH2O; ### P < 0.001 vs PEEP 5 cmH2O; §§§ P < 0.0001 vs PEEP 10 cmH2O
Fig. 3
Fig. 3
Relationship between end-expiratory esophageal pressure and end-expiratory intrathoracic pressure (esophageal balloon inflated at VBEST). Figure shows the relationship (overall and according to different PEEP levels) between end-expiratory esophageal pressure and end-expiratory intrathoracic pressure (panels A, B, C, D) and their difference (panels E and F, white dots represent corrected values while black dots represent uncorrected values) according to the tested catheters (Cooper, panels A, C, E; Nutrivent panels B, D, F). Panels A and B refer to uncorrected end-expiratory esophageal pressure while panels C and D refer to corrected values. Blue color represents PEEP 0 cmH2O; dark-red color represents PEEP 5 cmH2O; green color represents PEEP 10 cmH2O; dark-yellow color represents PEEP 15 cmH2O. Blue, dark-red, green and dark-yellow lines represent linear regressions at different PEEP values, dark-grey line represents linear regression at all PEEP levels. Black continuous line represents the identity line. * P < 0.05 vs “corrected”; *** P < 0.001 vs “corrected”; †† P < 0.01 vs PEEP 0; ††† P < 0.001 vs PEEP 0; ‡‡ P < 0.01 vs PEEP 5
Fig. 4
Fig. 4
Relationship between end-inspiratory esophageal pressure and end-inspiratory intrathoracic pressure (esophageal balloon inflated at VBEST). Figure shows the relationship (overall and according to different PEEP levels) between end-inspiratory esophageal pressure and end-inspiratory intrathoracic pressure (panels A, B, C, D) and their difference (panels E and F white dots represent corrected values while black dots represent uncorrected values) according to the tested catheters (Cooper, panels A, C, E; Nutrivent panels B, D, F). Panels A and B refer to end- inspiratory esophageal pressure while panels C and D refer to corrected values. Blue color represents PEEP 0 cmH2O; dark-red color represents PEEP 5 cmH2O; green color represents PEEP 10 cmH2O; dark-yellow color represents PEEP 15 cmH2O. Blue, dark-red, green and dark-yellow lines represent linear regressions at different PEEP values, dark-grey line represents linear regression at all PEEP levels. Black continuous line represents the identity line. ** P < 0.01 vs “corrected”; *** P < 0.001 vs “corrected”; ††† P < 0.001 vs PEEP 0; ‡‡ P < 0.01 vs PEEP 5
Fig. 5
Fig. 5
Relationship between esophageal pressure swings and intrathoracic pressure swings (esophageal balloon inflated at VBEST). Figure shows the relationship (overall and according to different PEEP levels) between esophageal pressure swings and intrathoracic pressure swings (panels A, B) and their difference (panels C and D) according to the tested catheters (Cooper, panels A, C; Nutrivent panels B, D). Blue color represents PEEP 0 cmH2O; dark-red color represents PEEP 5 cmH2O; green color represents PEEP 10 cmH2O; dark-yellow color represents PEEP 15 cmH2O. Blue, dark-red, green and dark-yellow lines represent linear regressions at different PEEP values, dark-grey line represents linear regression at all PEEP levels. Black continuous line represents the identity line. † P < 0.05 vs PEEP 0

References

    1. Slutsky AS, Ranieri VM. Ventilator-induced lung injury. N Engl J Med. 2013;369(22):2126–36. - PubMed
    1. Brower RG, Matthay MA, Morris A, Schoenfeld D, Thompson BT, Wheeler A. Ventilation with lower tidal volumes as compared with traditional tidal volumes for acute lung injury and the acute respiratory distress syndrome. N Engl J Med. 2000;342(18):1301–8. - PubMed
    1. Amato MB, Meade MO, Slutsky AS, Brochard L, Costa EL, Schoenfeld DA, Stewart TE, Briel M, Talmor D, Mercat A, et al. Driving pressure and survival in the acute respiratory distress syndrome. N Engl J Med. 2015;372(8):747–55. - PubMed
    1. Cressoni M, Gotti M, Chiurazzi C, Massari D, Algieri I, Amini M, Cammaroto A, Brioni M, Montaruli C, Nikolla K, et al. Mechanical power and development of ventilator-induced lung injury. Anesthesiology. 2016;124(5):1100–8. - PubMed
    1. Serpa Neto A, Deliberato RO, Johnson AEW, Bos LD, Amorim P, Pereira SM, Cazati DC, Cordioli RL, Correa TD, Pollard TJ, et al. Mechanical power of ventilation is associated with mortality in critically ill patients: an analysis of patients in two observational cohorts. Intensive Care Med. 2018;44(11):1914–22. - PubMed

Publication types