. 2024 Nov 14;22(1):545.
doi: 10.1186/s12964-024-01918-x.

Evidence that CRISPR-Cas9 Y537S-mutant expressing breast cancer cells activate Yes-associated protein 1 to driving the conversion of normal fibroblasts into cancer-associated fibroblasts

Affiliations

Evidence that CRISPR-Cas9 Y537S-mutant expressing breast cancer cells activate Yes-associated protein 1 to driving the conversion of normal fibroblasts into cancer-associated fibroblasts

Luca Gelsomino et al. Cell Commun Signal. .

Abstract

Background: Endocrine therapy (ET) has improved the clinical outcomes of Estrogen receptor alpha-positive (ERɑ +) breast cancer (BC) patients, even though resistance to ET remains a clinical issue. Mutations in the hormone-binding domain of ERɑ represent an acquired intrinsic mechanism of ET resistance. However, the latter also depends on the multiple functional interactions between BC cells and the tumor microenvironment (TME). Here, we investigated how the most common Y537S-ERɑ mutation may influence the behavior of fibroblasts, the most prominent component of the TME.

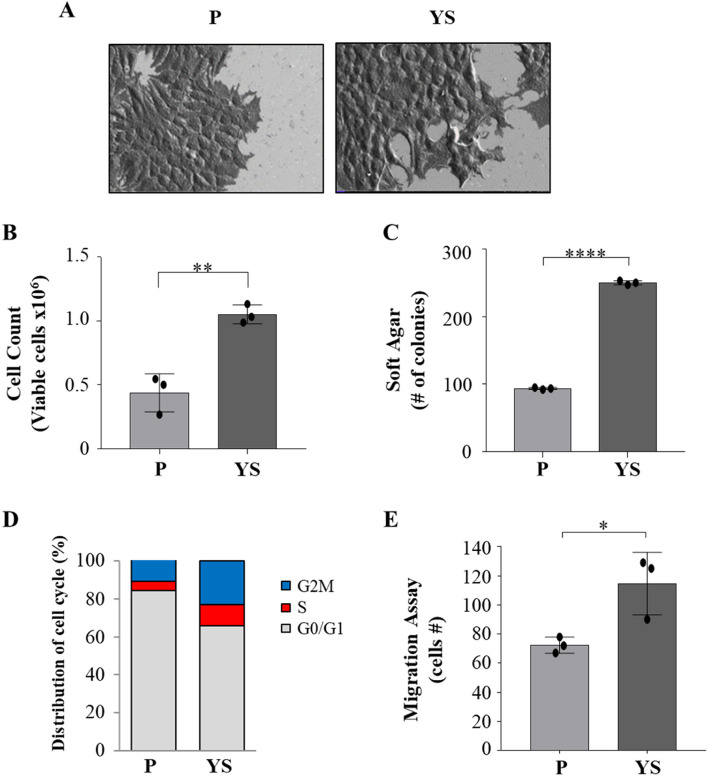
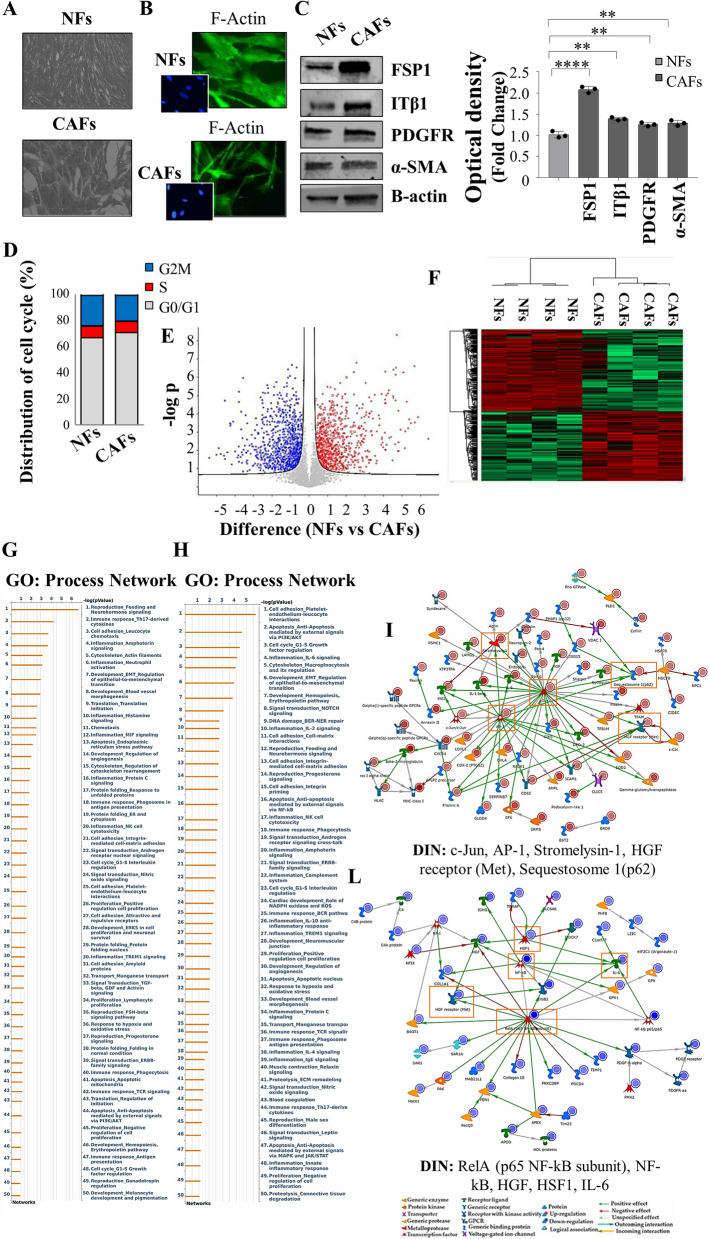
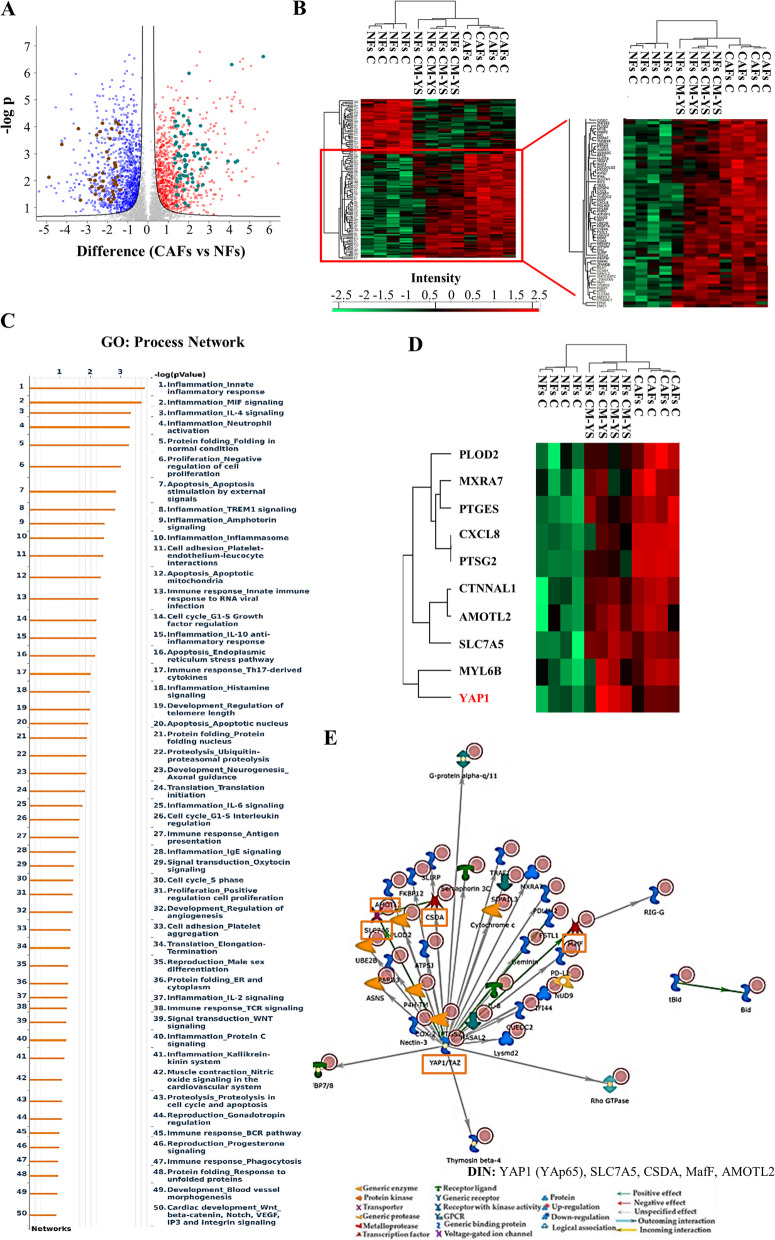
Methods: We conducted coculture experiments with normal human foreskin fibroblasts BJ1-hTERT (NFs), cancer-associated fibroblasts (CAFs), isolated from human BC specimens, and Y537S CRISPR-expressing MCF-7 BC cells (MCF-7YS). Mass spectrometry (MS) and Metacore analyses were performed to investigate how the functional interactions between BC cells/fibroblasts may affect their proteomic profile. The impact of fibroblasts on BC tumor growth and metastatic potential was evaluated in nude mice.

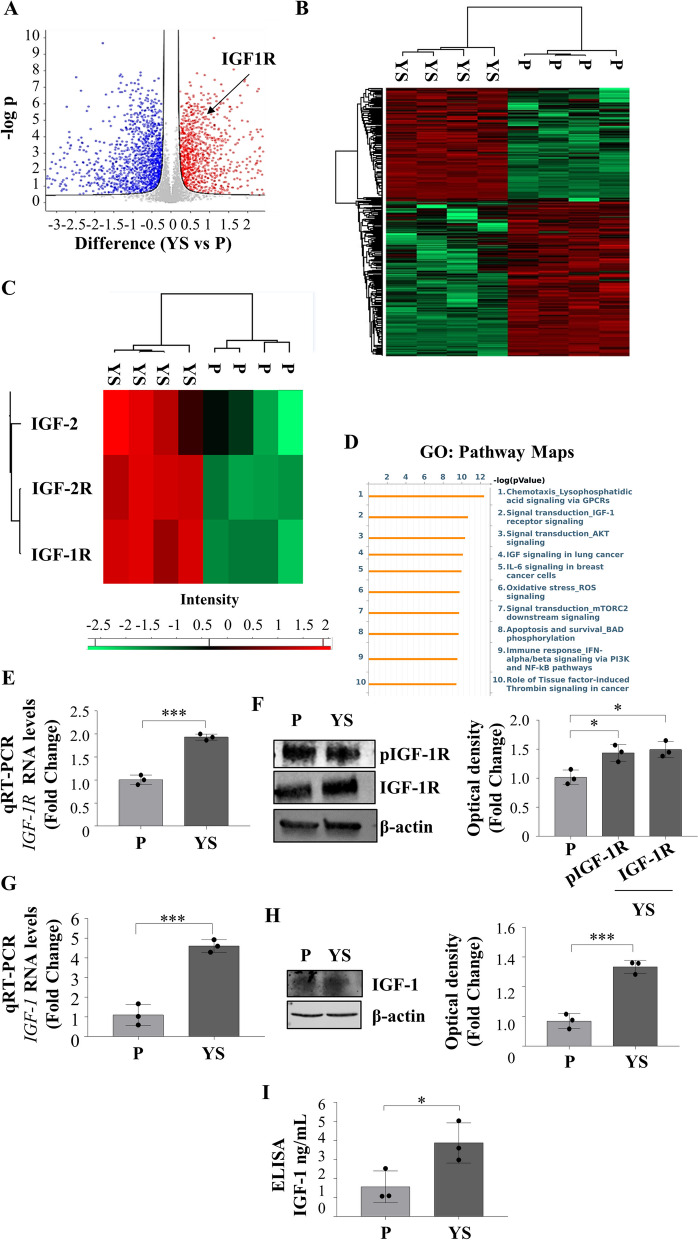
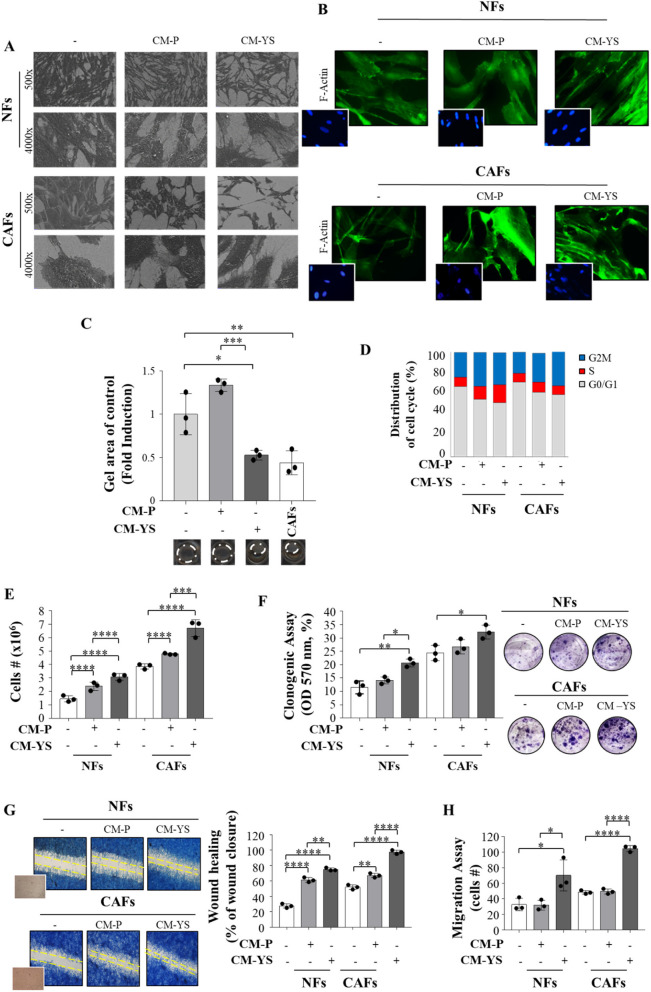
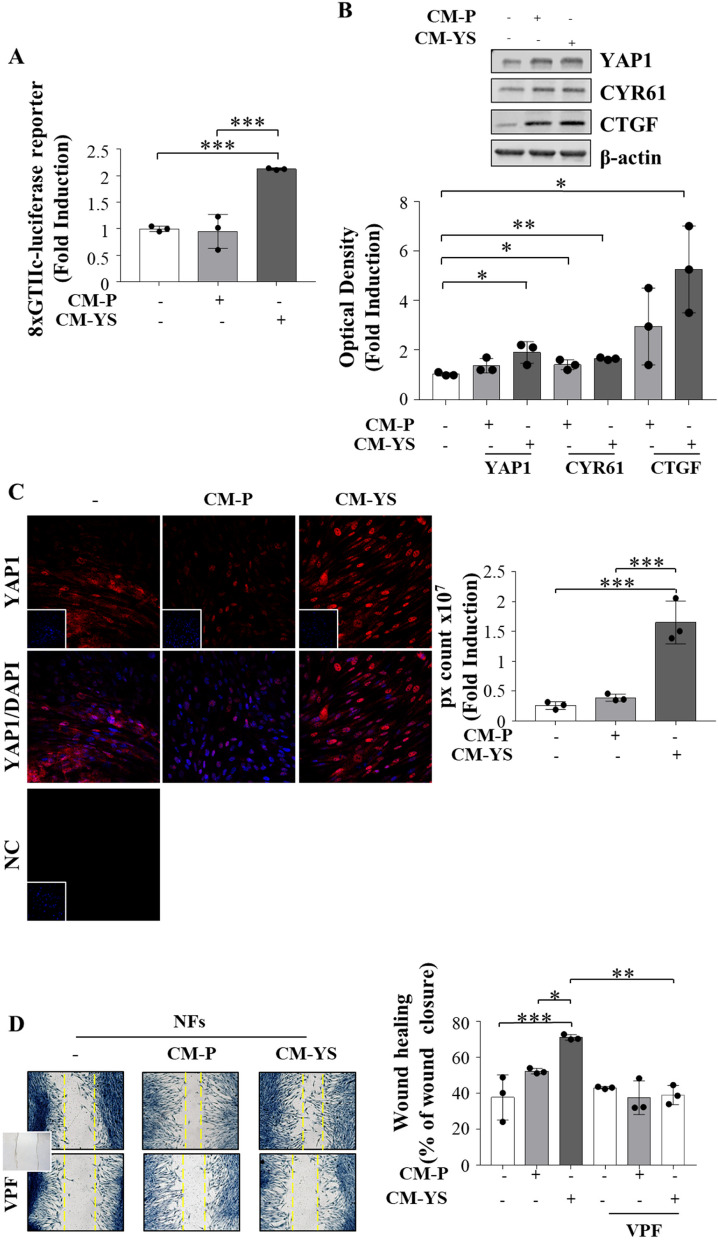
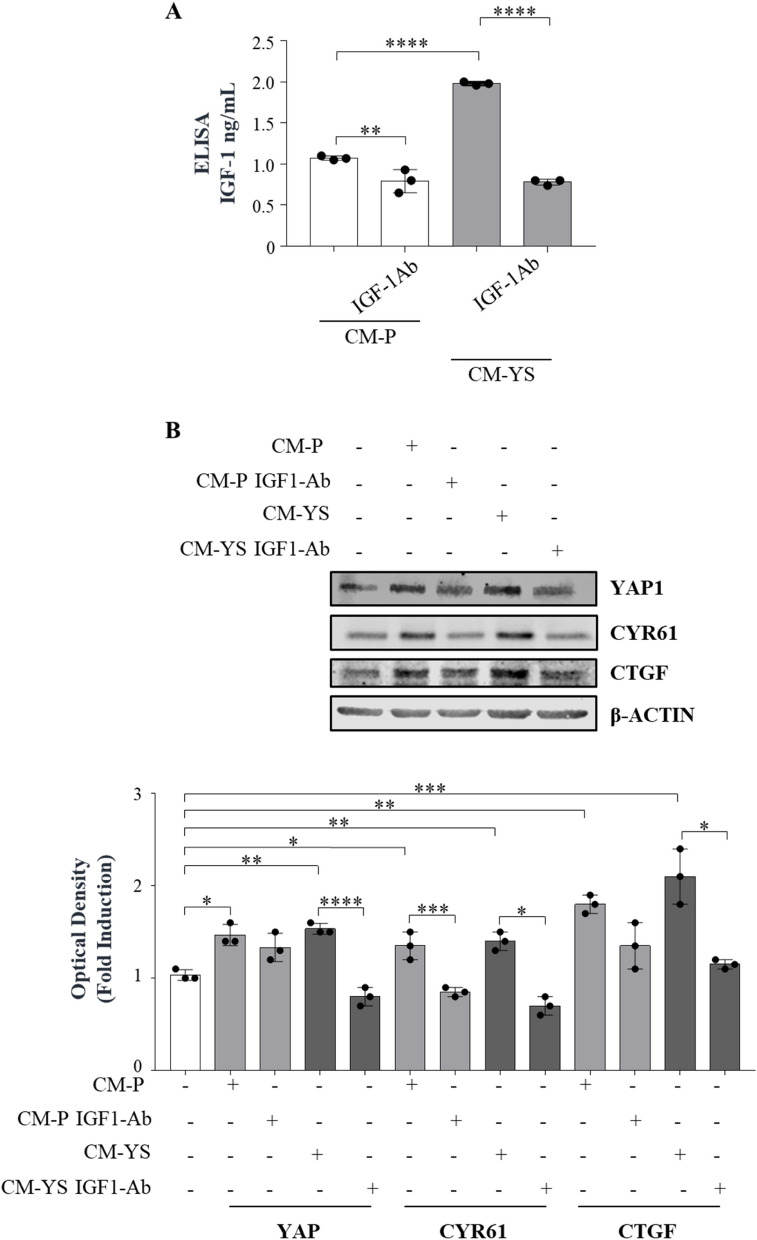
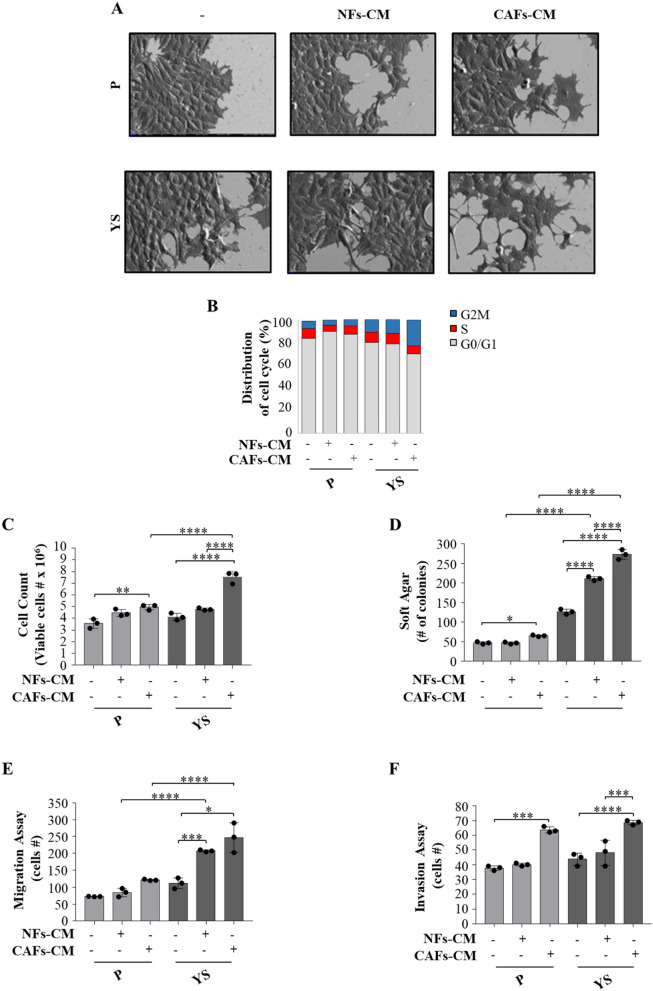
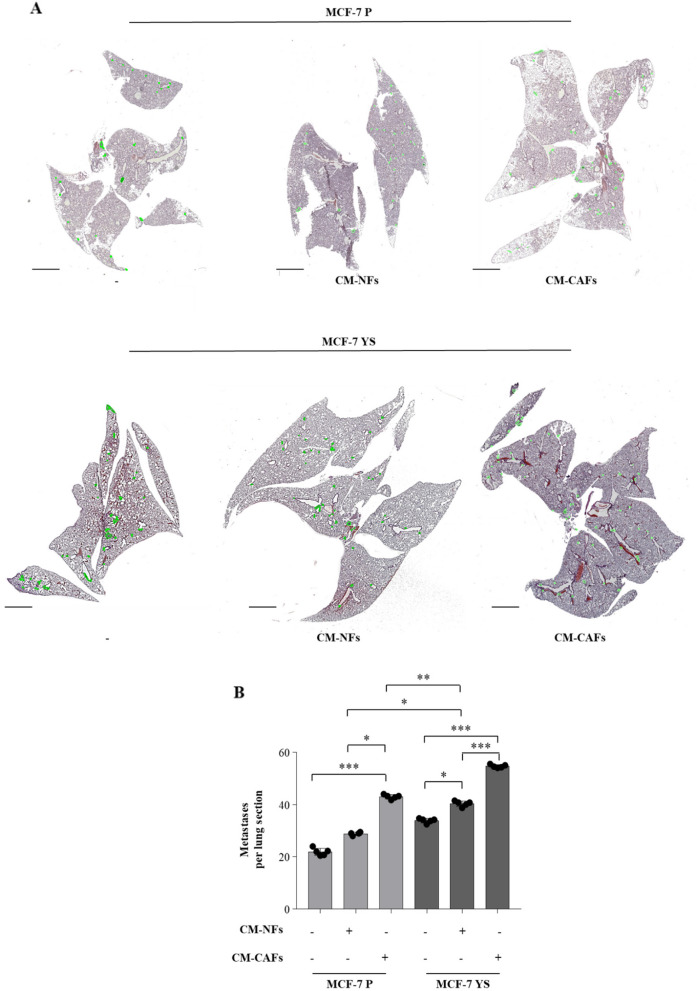
Results: Mutant BC conditioned medium (CM) affected the morphology/proliferation/migration of both NFs and CAFs. 198 deregulated proteins signed the proteomic similarity profile of NFs exposed to the YS-CM and CAFs. Among the upregulated proteins, Yes-associated protein 1 (YAP1) was the main central hub in the direct interaction network. Increased YAP1 protein expression and activity were confirmed in NFs treated with MCF-7YS-CM. However, YAP1 activation appears to crosstalk with the insulin growth factor-1 receptor (IGF-1R). Higher amount of IGF-1 were noticed in the MCF-7YS-CM cells compared to the MCF-7P, and IGF-1 immunodepletion reversed the enhanced YAP1 expression and activity. Mutant cells upon exposure to the NF- and CAF-CM exhibited an enhanced proliferation/growth/migration/invasion compared to the MCF-7P. MCF-7YS cells when implanted with CAFs showed an early relative increased tumor volume compared to YS alone. No changes were observed when MCF-7P cells were co-implanted with CAFs. Compared with that in MCF-7P cells, the metastatic burden of MCF-7YS cells was intrinsically greater, and this effect was augmented upon treatment with NF-CM and further increased with CAF-CM.

Conclusions: YS mutant BC cells induced the conversion of fibroblasts into CAFs, via YAP, which represent a potential therapeutic target which interrupt the functional interactions between mutant cells/TME and to be implemented in the novel therapeutic strategy of a subset of metastatic BC patients carrying the frequent Y537S mutations.

Keywords: Breast cancer; ESR1 mutation; Fibroblasts; IGF-1/IGF-1R; YAP1.


Conflict of interest statement

Declarations Ethics approval and consent to participate In the present study we used fibroblast specimens, isolated in accordance with approved guidelines, from patients who had signed informed consent and approved by the Ethic Institutional Committees at Annunziata Hospital, Cosenza, Italy (#149 issued by Comitato Etico Regione Calabria, Sezione Area Nord c/o Azienda Ospedaliera di Cosenza, 28/10/2015). All animals were maintained and handled in accordance with the recommendation of the Guidelines for the Care and Use of Laboratory Animals and experiments were approved by the Animal Care Committee of University of Calabria (OPBA), Italy (454/2023-PR, May 17, 2023). Consent for publication We have obtained consents to publish this paper from all the participants of this study. Competing interests The authors declare no competing interests.

Figures

Fig. 1
Fig. 1
Characterization of MCF-7 parental (P) and Y537S (YS) breast cancer cells. Representative scanning electron microscopy (SEM) images (A) of MCF-7 P and YS cells grown in regular media. Scale bar: 20 µm. B Viability assay in MCF-7 P and YS cells. Live cells were counted after 72 h. C Soft agar growth assays in MCF-7 P and YS cells. After 14 days of growth, colonies ≥ 50 μm in diameter were counted. D MCF-7 P and YS cells were stained with propidium iodide and analyzed by using a FACScan flow cytometer. The percentages of cells in the G0/G1, S, and G2/M phases are reported. E Transmigration assays in MCF-7 P and MCF-7 YS. The migrated cells were DAPI-stained, counted and images were captured at 10 × magnification. Each circle represents one independent experiments. Data were analyzed using Student’s t test, and are presented as mean ± SD of three independent experiments each performed in triplicates. *p < 0.05; **p < 0.01; ****p < 0.0001
Fig. 2
Fig. 2
Proteomic comparison between MCF-7 P and YS breast cancer cells. A Heatmap representing supervised hierarchical clustering of the significant and differentially expressed proteins between MCF-7 P and YS cells identified by LC–MS/MS analysis. The heatmap is shown in red color for the upregulated proteins and in green for downregulated proteins. C Heatmap representing supervised hierarchical clustering of the targets of interest for this study in the comparison between MCF-7 P and YS cells identified by LC–MS/MS analysis. The heatmap is shown in red color for the upregulated proteins and in green for downregulated proteins. D Volcano plot representing all detected proteins in MCF-7 P vs YS cells. The significant proteins are shown on the right (red dots, upregulated proteins) and on the left (blue dots, downregulated proteins). The gray dots correspond to proteins whose expression did not significantly change according to the selected parameters. B Gene Ontology (GO) analysis of proteins related to Pathway Maps according to Metacore. E Real time RT-PCR analysis of IGF-1R (Insulin Growth Factor-1 Receptor) mRNA expression in MCF-7 P and YS cells. F Immunoblotting showing pIGF-1R and IGF-1R protein expression in MCF-7 P and YS cells. β-actin was used as a control for equal loading and transfer. The histograms represent the mean ± SD of three separate experiments in which band intensities were evaluated in terms of optical density arbitrary units (OD) and expressed as percentage of MCF-7 P cells which were assumed to be 100%. G Real time RT-PCR analysis of IGF-1 (Insulin Growth Factor-1 Receptor) mRNA expression in MCF-7 P and YS cells. H Immunoblotting showing IGF-1 protein expression in MCF-7 P and YS cells. β-actin was used as a control for equal loading and transfer. The histograms represent the mean ± SD of three separate experiments in which band intensities were evaluated in terms of optical density arbitrary units (OD) and expressed as percentage of MCF-7 P cells which were assumed to be 100%. I E-linked immunosorbent assay (ELISA) for IGF-1 content in MCF-7 P and YS cells. Each circle represents one independent experiments. Data were analyzed using Student’s t test, and are presented as mean ± SD of three independent experiments each performed in triplicates. *p < 0.05; ***p < 0.001
Fig. 3
Fig. 3
Characterization of normal fibroblasts (NFs) and cancer-associated fibroblasts (CAFs). A Representative SEM images of NFs and CAFs grown in regular medium. Scale bar: 40 µm. B Immunofluorescence staining of phalloidin stained F-actin (stress fibers, green) in NFs and CAFs grown in regular medium. 4′,6-Diamidino-2-phenylindole (DAPI) was used for nuclei detection (inset). C Immunoblotting showing fibroblast-specific protein-1 (FSP1), integrin subunit beta 1 (ITB1), platelet derived growth factor receptor beta (PDGFR), alpha smooth muscle actin (α-sma) protein expression in NFs and CAFs. β-actin was used as a control for equal loading and transfer. The histograms represent the mean ± SD of three separate experiments in which band intensities were evaluated in terms of optical density arbitrary units (OD) and expressed as percentage of NF cells which were assumed to be 100%. Each circle represents one independent experiments. Data were analyzed using Student’s t test, and are presented as mean ± SD of three independent experiments each performed in triplicates. **p < 0.01; ****p < 0.0001. D NFs and CAFs were stained with propidium iodide and analyzed by using a FACScan flow cytometer. The percentages of cells in the G0/G1, S, and G2/M phases are reported. E Volcano plot representing all detected proteins in the comparison CAFs vs NFs. The significant proteins are localized on the right (red dots, up-regulated proteins) and on the left (blue dots, down-regulated proteins). Gray dots correspond to not significantly proteins, accordingly with selected parameters. F Heatmap representing supervised hierarchical clustering of the differentially expressed proteins between NFs and CAFs identified by LC–MS/MS analysis. Heatmap shows red color for degree of upregulated proteins, while green for the degree of downregulated proteins. Gene Ontology (GO) enrichment analysis of upregulated proteins (Fold cutoff ≥ 2.5, G and downregulated (H) (Fold cutoff ≤ 2.5) related to Process Networks according to Metacore. Direct interaction network (DIN, orange boxes) constructed by processing the upregulated (Fold cutoff ≥ 2.5, I and downregulated (Fold cutoff ≤ 2.5, L proteins identified in the comparison between NFs and CAFs. The colors of the arrows indicate positive (green), negative (red) or unknown (gray) effects of the different network items represented with different symbols (reported in the legend). DIN upregulated proteins: c-Jun, AP-1, Stromelysin-1, HGF receptor (Met), Sequestosome 1(p62); DIN downregulated proteins: RelA (p65 NF-kB subunit), NF-kB, HGF, HSF1, IL-6
Fig. 4
Fig. 4
Biological effects of MCF-7 P and MCF-7 YS CM on NFs and CAFs. A Representative SEM images of NFs and CAFs treated without (-) or with ( +) CM derived from MCF-7 P and YS for 5 days. Scale bar = 40 µm (500x) and 6 µm (4000x). B Immunofluorescence staining of phalloidin staining of F-actin (stress fibers, green) in NFs and CAFs treated without (-) or with CM derived from MCF-7 P and MCF-7 YS for 5 days. 4′,6-Diamidino-2-phenylindole (DAPI) was used for nuclei detection (inset). C Representative images of a gel contraction assay. The histogram represents the gel area of NFs treated without (-) or with ( +) CM derived from MCF-7 P and YS at 24 h. CAFs have been included as positive control. D NFs and CAFs treated without (-) or with ( +) CM derived from MCF-7 P and YS 5 days were stained with propidium iodide and analyzed by using a FACScan flow cytometer. The percentage of cells in the G0/G1, S, and G2/M phases is reported. E Viability assay in NFs and CAFs treated without (-) or with ( +) CM derived from MCF-7 P and YS for 5 days. Live cells were counted after 5 days of treatment. F Clonogenic assay in NFs and CAFs treated without (-) or with ( +) CM derived from MCF-7 P and YS for 5 days. Colonies were stained with 0.01% (w/v) crystal violet, solubilized and measured the absorbance at 570 nm through the microplate reader. G Wound healing assay in NFs and CAFs treated without (-) or with ( +) CM derived from MCF-7 P and YS with images captured at time 0 (inset) and after 12 h. H Transmigration assays in NFs and CAFs treated without (-) or with CM derived from MCF-7 P and MCF-7 YS for 24 h. The migrated cells were DAPI-stained, counted and images were captured at 10 × magnification. Each circle represents one independent experiments. Data were analyzed using one-way ANOVA with Tukey’s multiple comparisons post hoc test. Data are presented as mean values ± SD. *p < 0.05; **p < 0.01; ***p < 0.001; ****p < 0.0001
Fig. 5
Fig. 5
Proteomic analysis revealed proteomic similarity between NFs exposed to YS-CM and CAFs. A Volcano plot of representing all detected proteins in the comparison CAFs vs NFs. The significant proteins are localized on the right (red dots, upregulated proteins) and on the left (blue dots, downregulated proteins). Gray dots correspond to not significantly proteins, accordingly with selected parameters. This Volcano plot includes among the up (light green dots) and downregulated proteins (brown dots) those shared with NFs following their exposure to MCF-7 YS-CM reflecting in such condition their transition into CAF phenotype. B Heatmap representing supervised hierarchical clustering of the differentially expressed proteins (Fold cutoff ± 2.5) between NFs treated with CM derived from MCF-7 YS for 5 days and CAFs vs NFs identified by LC–MS/MS analysis. The heatmap is shown in red for the degree of upregulated proteins and in green for the degree of downregulated proteins (C). C GO enrichment in Process Networks of upregulated proteins (Fold cutoff ≥ 2.5) was shown. D Heatmap of the most representative upregulated proteins (Fold cutoff ≥ 2.5) of the different functional categories reported in the GO “process network”. E Direct interaction network constructed by processing the upregulated proteins identified in the comparison between NFs treated with CM derived from MCF-7 YS vs NFs (Fold cutoff ≥ 2.5). The colors of the arrows indicate positive (green), negative (red) or unknown (gray) effects of the different network items represented with different symbols (reported in the legend). DIN (orange boxes): YAP1 (YAp65), SLC7A5, CSDA, MafF, AMOTL2
Fig. 6
Fig. 6
YAP1 is a potential mediator of fibroblast/MCF-7 YS interplay. A NFs were transiently transfected with an MCAT-driven luciferase promoter and treated ( +) or not (-) with MCF-7 P and YS-CM for 24 h. B Immunoblotting showing YAP1 and its canonical target genes CYR61 and CTGF in NFs treated ( +) or not (-) with MCF-7 P and Y537S-CM for 5 days. The histograms represent the mean ± SD of three separate experiments in which band intensities were evaluated in terms of optical density arbitrary units (OD) and expressed as percentage of NF untreated cells (-) which were assumed to be 100%. C Immunofluorescence analysis of YAP1 in NFs treated ( +) or not (-) with MCF-7 P and YS-CM for 5 days. DAPI was used for nuclear staining. Nuclear Yap was quantified in six different fields per condition using ImageJ as described in material and methods. D Wound healing assay in NFs treated without (-) or with ( +) CM derived from MCF-7 P and YS, in the presence of verteporfin (VPF) 100 nm with pictures captured at time 0 (inset) and after 12 h. Each circle represents one independent experiments. Data were analyzed using one-way ANOVA with Tukey’s multiple comparisons post hoc test. Data are presented as mean values ± SD. *p < 0.05; **p < 0.01; ***p < 0.001; ****p < 0.0001
Fig. 7
Fig. 7
Paracrine effects of IGF-1 on YAP1 expression in fibroblasts. A Enzyme-linked immunosorbent assay (ELISA) for IGF-1 protein secretion in MCF-7 P and YS cancer cells. B Immunoblotting showing YAP and its canonical target genes CYR61 and CTGF in NFs treated ( +) or not (-) with MCF-7 P and YS-CM immunodepleted or not of IGF-1. The histograms represent the mean ± SD of three separate experiments in which band intensities were evaluated in terms of optical density arbitrary units (OD) and expressed as percentage of NF untreated cells (-) which were assumed to be 100%.. Each circle represents one independent experiments. Data were analyzed using one-way ANOVA with Tukey’s multiple comparisons post hoc test. Data are presented as mean values ± SD. *p < 0.05; **p < 0.01; ***p < 0.001; ****p < 0.0001
Fig. 8
Fig. 8
Biological effects of NFs-CM and CAFs-CM on MCF-7 P and MCF-7 YS cells. A SEM images of MCF-7 P and YS cells treated with NFs- and CAFs-CM for 5 days. Scale bar: 20 µm. B MCF-7 P and YS cells treated without (-) or with ( +) CM derived from NFs and CAFs for 5 days stained with propidium iodide and analyzed by using a FACScan flow cytometer. The percentages of cells in the G0/G1, S, and G2/M phases are reported. C Viability of MCF-7 P and YS cells treated without (-) or with NFs- and CAFs-CM for 5 days. Live cells were counted after 5 days of treatment. D Soft agar growth assays in MCF-7 P and YS cells treated with NFs- and CAFs-CM. After 14 days of growth, colonies ≥ 50 μm in diameter were counted. Transmigration (E) and invasion (F) assays of MCF-7 P and YS cells treated without (-) or with NFs- and CAFs-CM for 24 h. Each circle represents one independent experiments. Data were analyzed using one-way ANOVA with Tukey’s multiple comparisons post hoc test. Data are presented as mean values ± SD. *p < 0.05; **p < 0.01; ***p < 0.001; ****p < 0.0001
Fig. 9
Fig. 9
Effects of CAFs on the growth of MCF-7 P and YS xenograft tumors. MCF-7 P (A) and YS (B) cells were injected alone or coinjected with CAFs (MCF-7/CAFs) orthotopically into nude mice (5 mice/group). The relative tumor volume (RTV) was calculated from the following formula: RTV = (Vx/V1), where Vx is the tumor volume on day X and V1 is the tumor volume at initiation of the treatment for each group. Y axis: the mean and ± SD of the RTV. Data were analyzed using student t test. Data are presented as mean values ± SEM. *p < 0.05; **p < 0.001
Fig. 10
Fig. 10
Impact of NFs- and CAFs-CM on breast cancer metastasis in vivo. A Representative images of hematoxylin and eosin stained lung tissues of mice after 28 days from injection with MCF-7 P and MCF-7 YS untreated (-) or treated with NFs-CM and CAFs-CM for 5 days. Scale bars: 3 mm. B The histogram represents the number of metastatic lesions per lung section. Each circle represents the number of lung sections analyzed for each animal. Data were analyzed using one-way ANOVA with Bonferroni’s multiple comparisons test. Data are presented as mean values ± SD. *p < 0.05; **p < 0.001; ***p < 0.0001

References

    1. Clarke R, Tyson JJ, Dixon JM. Endocrine resistance in breast cancer–An overview and update. Mol Cell Endocrinol. 2015;418 Pt 3(03):220–34. - PMC - PubMed
    1. Hayes EL, Lewis-Wambi JS. Mechanisms of endocrine resistance in breast cancer: an overview of the proposed roles of noncoding RNA. Breast Cancer Res. 2015;17:40. - PMC - PubMed
    1. Schiavon G, Hrebien S, Garcia-Murillas I, Cutts RJ, Pearson A, Tarazona N, et al. Analysis of ESR1 mutation in circulating tumor DNA demonstrates evolution during therapy for metastatic breast cancer. Sci Transl Med. 2015;7(313):313ra182. - PMC - PubMed
    1. Toy W, Shen Y, Won H, Green B, Sakr RA, Will M, et al. ESR1 ligand-binding domain mutations in hormone-resistant breast cancer. Nat Genet. 2013;45(12):1439–45. - PMC - PubMed
    1. Toy W, Weir H, Razavi P, Lawson M, Goeppert AU, Mazzola AM, et al. Activating ESR1 Mutations Differentially Affect the Efficacy of ER Antagonists. Cancer Discov. 2017;7(3):277–87. - PMC - PubMed

MeSH terms