. 2024 Nov 15;57(4):616-632.
doi: 10.3724/abbs.2024165.

Mechanism of RSL3-induced ferroptotic cell death in HT22 cells: crucial role of protein disulfide isomerase

Affiliations

Mechanism of RSL3-induced ferroptotic cell death in HT22 cells: crucial role of protein disulfide isomerase

Ming-Jie Hou et al. Acta Biochim Biophys Sin (Shanghai). .

Abstract

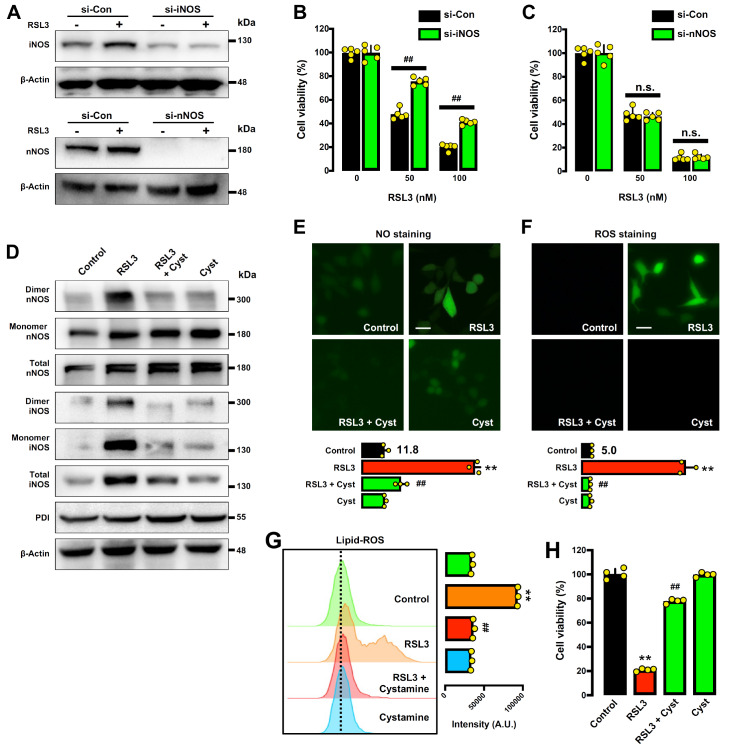
Protein disulfide isomerase (PDI) was recently shown to be an upstream mediator of erastin-induced, glutathione depletion-associated ferroptosis through its catalysis of nitric oxide synthase (NOS) dimerization and nitric oxide (NO) accumulation. A recent study reported that RSL3, a known ferroptosis inducer and glutathione peroxidase 4 (GPX4) inhibitor, can inhibit thioredoxin reductase 1 (TrxR1). The present study seeks to test the hypothesis that RSL3 may, through its inhibition of TrxR1, facilitate PDI activation ( i. e., in a catalytically active, oxidized state), thereby enhancing RSL3-induced ferroptosis through NOS dimerization and NO accumulation. Using HT22 mouse neuronal cells as an in vitro model, we show that treatment of these cells with RSL3 strongly increases NOS protein levels and that PDI-mediated NOS dimerization is activated by RSL3, resulting in NO accumulation. Mechanistically, we find that PDI is activated in cells treated with RSL3 because of its inhibition of TrxR1, and the activated PDI then catalyzes NOS dimerization, which is followed by the accumulation of cellular NO, ROS and lipid-ROS and ultimately ferroptotic cell death. Genetic or pharmacological inhibition of PDI or TrxR1 partially abrogates RSL3-induced NOS activation and the subsequent accumulation of cellular NO, ROS/lipid-ROS, and ultimately ferroptosis in HT22 cells. The results of this study clearly show that PDI activation resulted from RSL3 inhibition of TrxR1 activity contributes crucially to RSL3-induced ferroptosis in a cell culture model through the PDI→NOS→NO→ROS/lipid-ROS pathway, in addition to its known inhibition of GPX4 activity.

Keywords: lipid reactive oxygen species; neuronal nitric oxide synthase; nitric oxide; protein disulfide isomerase; reactive oxygen species; thioredoxin reductase 1.


Conflict of interest statement

The authors declare that they have no conflict of interest.

Figures

None
Figure 1
Time-and dose-dependent accumulation of NO, ROS and lipid-ROS during RSL3-induced ferroptosis in HT22 cells (A,B) Time- and dose-dependent effects of RSL3 on cell viability (MTT assay, n = 5). The RSL3 concentration used was 100 nM (A), and the treatment duration was 24 h (B). (C) Time-dependent change in the gross morphology of RSL3 (100 nM)-treated cells (scale bar: 45 μm). (D) Protective effect of Fer-1 against RSL3-induced cytotoxicity following treatment of cells with RSL3 (100 nM) ± Fer-1 (1 μM) for 24 h (MTT assay, n = 5). (E) Time-dependent accumulation of cellular NO and ROS (fluorescence microscopy images, scale bar: 60 μm) following RSL3 treatment; the quantitative intensity values are shown in the right panel (n = 3). (F) Time-dependent accumulation of cellular lipid-ROS (confocal microscopy images) in RSL3-treated cells (scale bar: 10 μm). (G–I) Time-dependent accumulation of NO (G), ROS (H) and lipid-ROS (I) in RSL3-treated cells (analytical flow cytometry). The quantitative intensity values are shown in the right panel (n = 3). (J) Time-dependent change in the cellular MDA level in RSL3-treated cells (n = 3). Data are presented as the mean ± SD. *P < 0.05, **P < 0.01; ##P < 0.01. n.s., not significant.
None
Figure 2
Effects of free radical scavengers on RSL3-induced cytotoxicity and the accumulation of NO, ROS and lipid-ROS in HT22 cells (A–C) Abrogation by cPTIO of RSL3-induced accumulation of cellular NO (A), ROS (B) and lipid-ROS (C). The cells were treated with RSL3 (100 nM) ± cPTIO (200 μM) for 6 h and then stained for NO, ROS and lipid-ROS (A,B for fluorescence microscopy; scale bar: 60 μm; C for analytical flow cytometry). The quantitative intensity values are shown in the lower panel (n = 3; the mean value for the control group is labeled next to the bar). (D) Protective effect of cPTIO against RSL3-induced cytotoxicity following treatment of cells with RSL3 (100 nM) ± cPTIO (200 μM) for 24 h (MTT assay, n = 5). (E–G) Trolox-mediated abrogation of RSL3-induced accumulation of cellular NO (E), ROS (F) and lipid-ROS (G). The cells were treated with RSL3 (100 nM) ± Trolox (100 μM) for 6 h and then stained for NO, ROS and lipid-ROS (E,F for fluorescence microscopy; scale bar: 60 μm; G for analytical flow cytometry). The quantitative intensity values are shown in the lower panel (n = 3; the mean value for the control group is labeled next to the bar). (H) Protective effect of Trolox against RSL3-induced cytotoxicity following treatment of cells with RSL3 (100 nM) ± Trolox (100 μM) for 24 h (MTT assay, n = 5). (I–L) Abrogation of RSL3-induced accumulation of cellular NO (I,J), ROS (K) and lipid-ROS (L) by NAC. The cells were treated with RSL3 (100 nM) ± NAC (800 μM) for 6 h and then stained for NO, ROS and lipid-ROS (J,K for fluorescence microscopy; scale bar: 60 μm; I,L for analytical flow cytometry). The quantitative intensity values are shown in the lower panel (n = 3; the mean value for the control group is labeled next to the bar). (M) Protective effect of NAC against RSL3-induced cytotoxicity following treatment of cells with RSL3 (100 nM) ± NAC (200, 400 and 800 μM) for 24 h (MTT assay, n = 5). Data are presented as the mean ± SD. ** P < 0.01; ##P < 0.01.
None
Figure 3
Effect of SNP on RSL3-induced NO, ROS and lipid-ROS accumulation in HT22 cells (A,B) NO and ROS levels after treatment with SNP (200 μM) for different durations (0.5, 1, 2, 4 and 6 h; scale bar: 50 μm) (A). The quantitative intensity values are shown in the right panel (n = 3) (B). (C–E) Time-dependent accumulation of cellular NO (C), ROS (D) and lipid-ROS (E) following SNP treatment (analytical flow cytometry), and the quantitative intensity values are shown in the right panel (n = 3). (F) Dose-dependent effect of SNP on cell viability (MTT assay, n = 5). (G) Changes in cell viability following treatment with SNP (200 μM) and different concentrations of RSL3 for 24 h (MTT assay, n = 5). (H–L) Accumulation of ROS (H,I) and lipid-ROS (J–L) after treatment with RSL3 (100 nM) ± SNP (200 μM) (H for fluorescence microscopy; scale bar: 60 μm; J–L for analytical flow cytometry). The quantitative intensity values for H are shown in the lower panel (I) (n = 3). Data are presented as the mean ± SD. *P < 0.05, ** P < 0.01; #P < 0.05. n.s., not significant.
None
Figure 4
RSL3-induced NOS activation in HT22 cells (A) Total iNOS and nNOS protein levels following the treatment of cells with RSL3 (100 nM) for the indicated time intervals or with increasing concentrations of RSL3 for 6 h. (B) Levels of the dimeric and monomeric iNOS and nNOS proteins following the treatment of cells with RSL3 (100 nM) for the indicated time intervals or with increasing concentrations of RSL3 for 6 h. (C–G) Abrogation of RSL3-induced accumulation of cellular NO (C,E), ROS (D,F) and lipid-ROS (G) by SMT and CPZ. The cells were treated with RSL3 (100 nM) ± SMT (50 μM) or RSL3 (100 nM) ± CPZ (40 μM) for 6 h and then stained for NO, ROS and lipid-ROS (C,D for fluorescence microscopy; scale bar: 60 μm; E–G for analytical flow cytometry). The quantitative intensity values are shown in the right panel (n = 3; the mean value for the control group is labeled next to the bar). (H) Protective effect of SMT against RSL3-induced cytotoxicity following treatment of cells with RSL3 (100 nM) ± SMT (25, 50, 100 μM) for 24 h (MTT assay, n = 4). (I) Protective effect of SMT against RSL3-induced cytotoxicity following the treatment of cells with RSL3 (100 nM)±CPZ (40 μM) for 24 h (MTT assay, n = 5). (J) Protective effect of SMT + CPZ against RSL3-induced cytotoxicity following the treatment of cells with RSL3 (100 nM) ± SMT (25 μM) or CPZ (12.5 μM) for 24 h (MTT assay, n = 4). Data are presented as the mean ± SD. **P < 0.01; ##P < 0.01.
None
Figure 5
Protective effect of cystamine (a PDI inhibitor) against RSL3-induced ferroptosis in HT22 cells (A) Effectiveness of iNOS-siRNAs and nNOS-siRNAs in reducing cellular iNOS and nNOS protein levels, respectively. The cells were transfected with iNOS-siRNAs or nNOS-siRNAs for 48 h prior to being treated with RSL3 (50 and 100 nM) for an additional 6 h. (B,C) Effects of iNOS (B) and nNOS (C) knockdown on RSL3-induced cytotoxicity. The cells were transfected with iNOS-siRNAs or nNOS-siRNAs for 24 h prior to being treated with RSL3 (100 nM) for an additional 24 h. (D) Levels of the dimeric and monomeric iNOS and nNOS proteins and total iNOS and nNOS proteins after the treatment of cells with RSL3 (100 nM) ± cystamine (100 nM) for 6 h. (E–G) Abrogation of RSL3-induced accumulation of cellular NO (E), ROS (F) and lipid-ROS (G) by cystamine. The cells were treated with RSL3 (100 nM) ± cystamine (100 μM) for 6 h and then stained for NO, ROS and lipid-ROS (E,F for fluorescence microscopy; scale bar: 60 μm; G for analytical flow cytometry). The quantitative intensity values are shown in the lower panel (n = 3; the mean value for the control group is labeled next to the bar). (H) Protective effect of cystamine against RSL3-induced cytotoxicity following treatment of cells with RSL3 (100 nM) ± cystamine (100 μM) for 24 h (MTT assay, n = 4). Data are presented as the mean ± SD. **P < 0.01; ## P < 0.01. n.s., not significant.
None
Figure 6
4-OH-E 1 and SNAP ( S-nitrosylating agents) protect against RSL3-induced ferroptosis in HT22 cells (A) Levels of dimeric and monomeric nNOS proteins and total iNOS and nNOS proteins after treatment of cells with RSL3 (100 nM) ± 4-OH-E1 (5 μM) for 6 h. (B–D) Abrogationof RSL3-induced accumulation of cellular NO (B), ROS (C) and lipid-ROS (D) by 4-OH-E1. The cells were treated with RSL3 (100 nM) ± 4-OH-E1 (5 μM) for 6 h and then stained for NO, ROS and lipid-ROS (B,C for fluorescence microscopy; scale bar: 65 μm; D for analytical flow cytometry). The quantitative intensity values are shown in the lower panel (n = 3; the mean value for the control group is labeled next to the bar). (E) Protective effect of 4-OH-E1 against RSL3-induced cytotoxicity following treatment of cells with RSL3 (100 nM) ± 4-OH-E1 (1.25, 2.5 and 5 μM) for 24 h (MTT assay, n = 4). (F) Levels of dimeric and monomeric nNOS proteins and total nNOS protein after the treatment of cells with RSL3 (100 nM) ± SNAP (200 μM) for 6 h. (G–I) Abrogation of the RSL3-induced accumulation of cellular NO (G), ROS (H) and lipid-ROS (I) by SNAP. The cells were treated with RSL3 (100 nM) ± SNAP (200 μM) for 6 h and then stained for NO, ROS and lipid-ROS (G,H for fluorescence microscopy; scale bar: 65 μm; I for analytical flow cytometry). The quantitative intensity values are shown in the right panel (n = 3; the mean value for the control group is labeled next to the bar). (J) Protective effect of SNAP against RSL3-induced cytotoxicity following the treatment of cells with RSL3 (100 nM) ± SNAP (200 μM) for 24 h (MTT assay, n = 5). (K) Effectiveness of PDI-siRNAs in reducing the protein level of PDI. The cells were transfected with PDI-siRNAs for 24 or 48 h, and the PDI protein level was determined by western blot analysis. (L) Protective effect of PDI knockdown on RSL3-induced cytotoxicity. The cells were transfected with PDI-siRNAs for 24 h prior to treatment with RSL3 (100 nM) for an additional 24 h. Data are presented as the mean ± SD. **P < 0.01; #P < 0.05, ## P < 0.01.
None
Figure 7
Role of TrxR1 in RSL3-induced ferroptosis in HT22 cells (A) Effectiveness of TrxR1-siRNAs in reducing the cellular TrxR1 protein level. The cells were transfected with TrxR1-siRNAs for 24, 48 and 72 h, and the TrxR1 protein levels were determined by western blot analysis. (B) Effects of TrxR1 knockdown on RSL3- and auranofin-induced cytotoxicity. The cells were transfected with TrxR1-siRNAs for 24 h prior to treatment with RSL3 (100 nM) or auranofin (1 μM) for an additional 24 h, after which the cell viability was determined (MTT assay, n = 4). (C) TrxR1 enzyme activity in cells following treatment with RSL3 (100 nM) or auranofin (1 μM) for 6 h. Cellular supernatants were prepared from different treatment groups (with the same number of cells), after which TrxR1 enzyme activity was assayed. The relative TrxR1 activity in the RSL3 and auranofin groups is presented as a percentage of the relative TrxR1 activity in the vehicle-treated control group. (D,E) TrxR1, GPX4 and total nNOS protein levels following treatment with 100 nM RSL3 (D) or 1 μM auranofin (E) for different durations, as indicated. (F) Levels of iNOS monomers, iNOS dimers, TrxR1 and PDI proteins in RSL3-treated cells with TrxR1 knockdown. The cells were transfected with control-siRNAs or TrxR1 siRNAs for 24 h and then treated with 100 nM RSL3 for an additional 6 h. (G,H) Relative protein band intensities of TrxR1, GPX4 and total nNOS proteins following treatment with 100 nM RSL3 (G) or 1 μM auranofin (H) for different durations as indicated. The protein bands were quantified via densitometry (ImageJ software). The relative intensity of a given protein was normalized to the corresponding β-actin intensity, and the relative protein level in a given treatment group is presented relative to the vehicle-treated control group. (I–L) Concentration- and incubation time-dependent inhibition of TrxR1 enzyme activity in vitro by auranofin (I,J) and RSL3 (K,L). TrxR1 enzyme activity in the presence of an inhibitor (auranofin or RSL3) is presented as a percentage of the control activity in the absence of an inhibitor. Data are presented as the mean ± SD. *P < 0.05, **P < 0.01; ##P < 0.01. n.s., not significant.
None
Figure 8
Effects of auranofin on cell viability and the levels of NO, ROS and lipid-ROS in HT22 cells (A) Dose-dependent effect of auranofin on cell viability (MTT assay, n = 5). (B,C) Effects of Fer-1 (B) and DFO (C) on auranofin-induced cytotoxicity. The cells were treated with auranofin (1 μM) ± Fer-1 or DFO at the indicated concentrations for 24 h, and the change in cell viability was determined via the MTT assay (n = 5). (D–F) Time-dependent accumulation of cellular NO (D), ROS (E) and lipid-ROS (F) in auranofin-treated cells (analytical flow cytometry). The quantitative intensity values are shown in the respective right panels (n = 3). (G,H) Effects of z-VAD-FMK (G) and Nec-1 (H) on auranofin-induced cytotoxicity. The cells were treated with auranofin (1 μM) ± z-VAD-FMK or Nec-1 at the indicated concentrations for 24 h, and the change in cell viability was determined via the MTT assay (n = 5). Data are presented as the mean ± SD. *P < 0.05, **P < 0.01. n.s., not significant.
None
Figure 9
PDI mediates the cytotoxicity jointly induced by auranofin and BSO in HT22 cells (A) Dose-dependent effect of BSO on cell viability (MTT assay, n = 4). (B) Dose-dependent effect of auranofin±BSO on cell viability. The cells were treated with auranofin (25, 50 or 100 nM) ± BSO (2, 4 or 6 μM) for 24 h, after which cell viability was determined by the MTT assay (n = 4). (C) Protein levels of the monomer and dimer nNOS, total nNOS, TrxR1 and GPX4 in cells treated with auranofin (50 nM)+BSO (6 μM) for different time intervals, as indicated. The relative protein levels are shown in the right panels. The relative intensity of the protein bands was normalized to that of β-actin and calculated relative to that of the vehicle (control) group. (D) Protective effect of Fer-1 against cytotoxicity jointly induced by auranofin and BSO. The cells were treated with auranofin (50 nM)+BSO (6 μM) alone or in combination with Fer-1 (1 μM) for 24 h, and cell viability was determined via the MTT assay (n = 4). (E) Protective effects of cystamine and 4-OH-E1 against cell death jointly induced by auranofin+BSO. The cells were treated with auranofin (50 nM) and BSO (6 μM) alone or in combination with cystamine (12.5 μM) or 4-OH-E1 (2 μM) for 24 h, and cell viability was determined by the MTT assay (n = 4). (F–H) Time-dependent accumulation of cellular NO (F), ROS (G) and lipid-ROS (H) in cells treated with both auranofin and BSO (analytical flow cytometry). The quantitative intensity values are shown in the respective right panels ( n = 3). (I–K) Abrogation of auranofin+BSO-induced accumulation of cellular NO (I), ROS (J) and lipid-ROS (K) by cystamine and 4-OH-E1. The cells were treated with auranofin (50 nM) or BSO (6 μM) alone or in combination with cystamine (12.5 μM) or 4-OH-E1 (2 μM) for 6 h and then stained for NO, ROS and lipid-ROS (analytical flow cytometry). The quantitative intensity values are shown in the respective right panels (n = 3). Data are presented as the mean ± SD. *P < 0.05, **P < 0.01; ##P < 0.01. n.s., not significant.

References

    1. Dixon SJ, Lemberg KM, Lamprecht MR, Skouta R, Zaitsev EM, Gleason CE, Patel DN, et al. Ferroptosis: an iron-dependent form of nonapoptotic cell death. Cell. . 2012;149:1060–1072. doi: 10.1016/j.cell.2012.03.042. - DOI - PMC - PubMed
    1. Stockwell BR. Ferroptosis turns 10: emerging mechanisms, physiological functions, and therapeutic applications. Cell. . 2022;185:2401–2421. doi: 10.1016/j.cell.2022.06.003. - DOI - PMC - PubMed
    1. Yang WS, Stockwell BR. Synthetic lethal screening identifies compounds activating iron-dependent, nonapoptotic cell death in oncogenic-RAS-Harboring cancer cells. Chem Biol. . 2008;15:234–245. doi: 10.1016/j.chembiol.2008.02.010. - DOI - PMC - PubMed
    1. Yang WS, SriRamaratnam R, Welsch ME, Shimada K, Skouta R, Viswanathan VS, Cheah JH, et al. Regulation of ferroptotic cancer cell death by GPX4. Cell. . 2014;156:317–331. doi: 10.1016/j.cell.2013.12.010. - DOI - PMC - PubMed
    1. Cheff DM, Huang C, Scholzen KC, Gencheva R, Ronzetti MH, Cheng Q, Hall MD, et al. The ferroptosis inducing compounds RSL3 and ML162 are not direct inhibitors of GPX4 but of TXNRD1. Redox Biol. . 2023;62:102703. doi: 10.1016/j.redox.2023.102703. - DOI - PMC - PubMed

MeSH terms

LinkOut - more resources