. 2024 Dec;11(48):e2409753.
doi: 10.1002/advs.202409753. Epub 2024 Nov 15.

BRD4 Degradation Enhanced Glioma Sensitivity to Temozolomide by Regulating Notch1 via Glu-Modified GSH-Responsive Nanoparticles

Affiliations

BRD4 Degradation Enhanced Glioma Sensitivity to Temozolomide by Regulating Notch1 via Glu-Modified GSH-Responsive Nanoparticles

Linbin Yi et al. Adv Sci (Weinh). 2024 Dec.

Abstract

Temozolomide (TMZ) serves as the principal chemotherapeutic agent for glioma; nonetheless, its therapeutic efficacy is compromised by the rapid emergence of drug resistance, the inadequate targeting of glioma cells, and significant systemic toxicity. ARV-825 may play a role in modulating drug resistance by degrading the BRD4 protein, thereby exerting anti-glioma effects. Therefore, to surmount TMZ resistance and achieve efficient and specific drug delivery, a dual-targeted glutathione (GSH)-responsive nanoparticle system (T+A@Glu-NP) is designed and synthesized for the co-delivery of ARV-825 and TMZ. As anticipated, T+A@Glu-NPs significantly enhanced penetration of the blood-brain barrier (BBB), facilitated drug uptake by glioma cells, and exhibited efficient accumulation in brain tissue. Additionally, T+A@Glu-NPs exhibited augmented efficacy against glioma both in vitro and in vivo through the induction of apoptosis, inhibition of proliferation, and cell cycle arrest. Furthermore, mechanistic exploration revealed that T+A@Glu-NPs degraded the BRD4 protein, leading to the downregulation of Notch1 gene transcription and the inhibition of the Notch1 signaling pathway, thereby augmenting the therapeutic efficacy of glioma chemotherapy. Taken together, the findings suggest that T+A@Glu-NPs represents a novel and promising therapeutic strategy for glioma chemotherapy.

Keywords: ARV‐825; glioma chemotherapy, notch1; target delivery; temozolomide.


Conflict of interest statement

The authors declare no conflict of interest.

Figures

Scheme 1
Scheme 1
Schematic illustration of the brain‐targeting and therapeutic mechanism of T+A@Glu‐NPs against glioma. Glu‐PEG‐PCL, PEG‐SS‐PCL, TMZ, and ARV‐825 were used to prepare T+A@Glu‐NPs nanoparticles via a self‐assembly method. Administered intravenously, T+A@Glu‐NPs leverage the glucose transporters expressed by the cerebral microvascular endothelium to penetrate the blood‐brain barrier and reach the tumor site. They then bind to the transporters highly expressed on the surface of glioma and are efficiently internalized into the cells. After lysosomal escape and response to glutathione (GSH) reduction, T+A@Glu‐NPs disintegrate and rapidly release TMZ and ARV‐825. TMZ acts on DNA to exert its cytotoxic effect, while ARV‐825 induces the sustained degradation of BRD4 protein through the ubiquitin‐proteasome pathway, thereby downregulating Notch1 and its associated signaling pathways. This further enhances the apoptotic and cell cycle arrest effects induced by TMZ in glioma cells, achieving a more potent glioma‐killing effect.
Figure 1
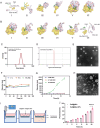
Figure 1
Characterizations of T+A@Glu‐NPs. Molecular dynamics simulation analysis A) the self‐assembly of TMZ, ARV‐825 and Glu‐PEG‐PCL / PEG‐SS‐PCL in the normal physiology environment (PH 7.4, GSH 0.1 mM). B) the GSH responsive and drug release process of T+A@Glu‐NPs in high GSH environment (GSH 10 mM). Conformations (I), (II), (III), (IV), (V), and (VI) represented the snapshots of the interaction between TMZ, ARV‐825 and Glu‐PEG‐PCL/PEG‐SS‐PCL at 0, 4, 8, 12, 16 and 20 ns, respectively. C) Particle size distribution of T+A@Glu‐NPs. D) Zeta potential of T+A@Glu‐NPs. E) TEM image of T+A@Glu‐NPs (scale bar = 50 nm). F) The stability experiment of T+A@Glu‐NPs. G) The glutathione reductive responsive release of TMZ and ARV‐825 from T+A@Glu‐NPs. H) TEM image of the reductive response morphological changes of T+A@Glu‐NPs. (I) Single‐layer BBB (Blood‐Brain Barrier) model penetration experiment of T+A@Glu‐NPs. (J) Statistical analysis of the BBB penetration rate. Data are presented as mean ± SD. No significant difference is marked with ns. *P < 0.05, **P < 0.01, ***P < 0.001 and ****P < 0.0001.
Figure 2
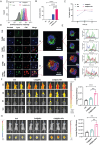
Figure 2
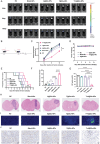
Enhanced targeting ability of T+A@Glu‐NPs in vitro and in vivo. A) FCM of Ce6 fluorescence intensity after LN229 incubated with Ce6, Ce6@NPs, Ce6@Glu‐NPs for 2 h. B) Statistical analysis of cell uptake rate after LN229 incubated with Ce6, Ce6@NPs, Ce6@Glu‐NPs for 2 h. C) Cellular uptake rate curves of different treatment groups. The untreated group was used as the control. D) The confocal images of the cells after LN229 incubated with Ce6, Ce6@NPs, Ce6@Glu‐NPs for 1 h and 4 h. E) The distribution of Ce6, Hochest33442 and LysoTracker Green DND‐26 in LN229 cells was examined using confocal imaging after incubated with Ce6@Glu‐NPs for 1h and 4 h. F) The distribution and changes in the Ce6 average radiant efficiency in the in vivo images of mice after tail vein injection of Ce6, Ce6@NPs, Ce6@Glu‐NPs at 3 h, 6 h, 9 h, and 12 h. G) Statistical analysis of the Ce6 average radiant efficiency in mice at 12 h in different treatment groups. H) The initial tumor size in vivo images of mice in each group and the distribution images of Ce6 average radiant efficiency in mouse brain tissues isolated at 24 h. I) Statistical analysis of Ce6 average radiant efficiency in mouse brain tissues isolated at 24 h. Data are presented as mean ± SD. No significant difference is marked with ns. *P < 0.05, **P < 0.01, ***P < 0.001 and ****P < 0.0001.
Figure 3
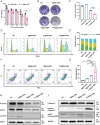
Figure 3
T+A@Glu‐NPs induced cells proliferation inhibition and cells apoptosis in vitro. A) Cell viabilities of GL261 cells treated with A@Glu‐NPs, T@Glu‐NPs and T+A@Glu‐NPs at different concentrations for 48 h (n = 3). The untreated group was used as a control. B) Representative images of colony formation of GL261 cells incubated with 100 ng mL−1 A@Glu‐NPs, 25 µM T@Glu‐NPs and T+A@Glu‐NPs. C) Quantification of colony formation (n = 3). D) GL261 cells cycle distribution determined by flow cytometry after treated with 100 ng mL−1 A@Glu‐NPs, 100 µM T@Glu‐NPs and T+A@Glu‐NPs for 48 h. E) Quantification of cell cycle distribution (n = 3). F) Flow cytometry detection of GL261 cells apoptosis after GL261 cells treated with 200 ng mL−1 A@Glu‐NPs, 75 µM T@Glu‐NPs and T+A@Glu‐NPs for 48 h. G) Statistical analysis of apoptosis cells (n = 3). H) Representative Western blot analysis of P‐STAT3, STAT3, Cyclin D1, CDK4 and GAPDH in GL261 cells treated with 100 ng mL−1 A@Glu‐NPs, 100 µM T@Glu‐NPs and T+A@Glu‐NPs for 48 h. GAPDH served as a loading control. I) Expressions of apoptosis related proteins (pro‐caspase 3, cleaved caspase 3, PARP) and the loading control GAPDH were determined by western blot analysis after GL261 cells treated with 100 ng mL−1 A@Glu‐NPs, 100 µM T@Glu‐NPs and T+A@Glu‐NPs for 48 h. J) Quantitative analysis of all the western blot results. Data are presented as mean ± SD. No significant difference is marked with ns. *P < 0.05, **P < 0.01, ***P < 0.001 and ****P < 0.0001.
Figure 4
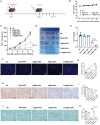
Figure 4
Antitumor effect of T+A@Glu‐NPs in GL261 glioma subcutaneous model. A) Schedule of experimental design in GL261 mouse subcutaneous model. B) Changes of body weight of mice in different group during treatment. C) The tumor group curve of the mouse subcutaneous model. D) The image of tumors from different groups. E) Quantification of tumors weight from different groups. F,G) TUNEL immunofluorescence staining images and statistical analysis of the GL261 mouse subcutaneous tumor. H,I) Ki67 staining images and statistical analysis of the GL261 mouse subcutaneous tumor. J,K) BRD4 immunohistochemical staining images and statistical analysis of the GL261 mouse subcutaneous tumor. Data are presented as mean ± SD. No significant difference is marked with ns. *P < 0.05, **P < 0.01, ***P < 0.001 and ****P < 0.0001.
Figure 5
Figure 5
Antitumor effect of T+A@Glu‐NPs in GL261 glioma orthotopic model. A) In vivo imaging of GL261‐Luc tumor‐bearing mice from different groups at 4, 8 and 12 days after injection of tumor cells. B) Schedule of experimental design in GL261 mouse orthotopic model. C) The curve of relative luminescence in different treatment groups. D) Changes of body weight of mice in different group during treatment (n = 5). E) The overall survival curve of the GL261 mouse orthotopic model and the humane endpoint is the persistent discomfort of mouse, such as severe hunched posture, reduced activity, apathy, leg dragging, or weight loss of more than 20%. F) Statistical analysis of TUNEL immunofluorescence staining. G) statistical analysis of Ki67 staining. H) H&E staining images of the GL261 orthotopic tumor on day 13 after the inoculation of GL261 cells. I) TUNEL immunofluorescence staining images of the GL261 mouse orthotopic tumor. J) Ki67 staining images of the GL261 mouse subcutaneous tumor. Data are presented as mean ± SD. No significant difference is marked with ns. *P < 0.05, **P < 0.01, ***P < 0.001 and ****P < 0.0001.
Figure 6
Figure 6
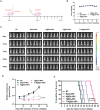
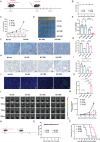
Antitumor effect of T+A@Glu‐NPs in LN229 glioma orthotopic model. A) Schedule of experimental design in mouse orthotopic model. B) Changes of body weight of mice in different group during treatment. C) In vivo imaging of LN229‐Luc tumor‐bearing mice from different groups at 5, 11, 17, 23, and 30 days after injection of tumor cells. D) The curve of relative luminescence in different treatment groups. E) The overall survival curve of the LN229 mouse orthotopic model. Data are presented as mean ± SD. No significant difference is marked with ns. *P < 0.05, **P < 0.01, ***P < 0.001 and ****P < 0.0001.
Figure 7
Figure 7
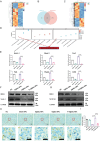
The mechanism of T+A@Glu‐NPs to reverse the TMZ resistance in glioma. A), B), and C) The RNA‐seq analysis and differential genes expression analysis of GL261 cells treated with 100 ng mL−1 A@Glu‐NPs, 100 µM T@Glu‐NPs, and T+A@Glu‐NPs for 48 h. The untreated group was as2333 a control. D) The enrichment analysis based on the RNA‐seq. E) Real‐time quantitative PCR analysis of genes related to the Notch1 signaling pathway. F,G) Western blot analysis of BRD4 and NOTCH1 after the GL261 cells treated with 100 ng mL−1 A@Glu‐NPs, 100 µM T@Glu‐NPs, and T+A@Glu‐NPs for 48 h. The untreated group was as a control. H,I) Notch1 immunohistochemical staining images and statistical analysis of the GL261 mouse subcutaneous tumor. Data are presented as mean ± SD. No significant difference is marked with ns. *P < 0.05, **P < 0.01, ***P < 0.001, and ****P < 0.0001.
Figure 8
Figure 8
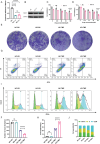
Knocking out Notch1 gene enhanced the anti‐tumor efficacy of TMZ in vitro. A) The qPCR of two Notch1 gene knocked out clones. (B) Western blot analysis of Notch1. GAPDH served as a loading control. C) Cell viabilities of clone 1‐1 in GL261‐KO cells treated with T@Glu‐NPs at different concentrations for 48 h. D) Cell viabilities of clone 1–2 in GL261‐KO cells treated with T@Glu‐NPs at different concentrations for 48 h. E,F) Representative images of colony formation of GL261(NC/KO) cells incubated with 25 µM TMZ/NPs and quantification of colony formation. G,H) Flow cytometry detection of GL261(NC/KO) cells apoptosis after different treatments for 48 h and statistical analysis of apoptosis cells. I,J) GL261 (NC/KO) cells cycle distribution determined by flow cytometry after treatment with 100 µM T@Glu‐NPs for 48 h and quantification of cell cycle distribution. Data are presented as mean ± SD. No significant difference is marked with ns. *P < 0.05, **P < 0.01, ***P < 0.001 and ****P < 0.0001.
Figure 9
Figure 9
Knocking out Notch1 gene enhanced the anti‐tumor efficacy of TMZ in GL261 subcutaneous and orthotopic mouse model. A) Schedule of experimental design in GL26 (NC/KO) mouse subcutaneous model. B) Changes of body weight of mice in different group during treatment. C) The tumor group curve of the mouse subcutaneous model. D) The image of tumors from different groups. E) Quantification of tumors weight from different groups. F,G) BRD4 immunohistochemical staining images and statistical analysis of the GL261 (NC/KO) mouse subcutaneous tumor. H,I) Ki67 staining images and statistical analysis of the GL261 (NC/KO) mouse subcutaneous tumor. J,K) TUNEL immunofluorescence staining images and statistical analysis of the GL261 (NC/KO) mouse subcutaneous tumor. L) In vivo imaging of GL261‐Luc tumor‐bearing mice from different groups at 4, 8, and 12 days after injection of tumor cells. M) The curve of relative luminescence in different treatment groups. N) Schedule of experimental design in GL261‐Luc (NC/KO) mouse orthotopic model. O) Changes of body weight of mice in different group during treatment. P) The overall survival curve of the GL261‐Luc (NC/KO) mouse orthotopic model. Data are presented as mean ± SD. No significant difference is marked with ns. *P < 0.05, **P < 0.01, ***P < 0.001, and ****P < 0.0001.
Figure 10
Figure 10
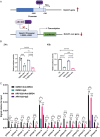
Mechanisms of T+A@Glu‐NPs modulate Notch1 expression to enhanced anti‐glioma efficacy of TMZ. A) The diagram of BRD4 acting on the Notch1 gene promoter and ARV‐825 reducing luciferase gene transcription initiated by the Notch1 promoter through inhibiting BRD4. B) Relative Notch1 luciferase reporter activity in GL261 cells treated with 100 ng mL−1 A@Glu‐NPs, 100 µM T@Glu‐NPs and T+A@Glu‐NPs for 48 h. The untreated group was as a control. C) ChIP‐qPCR analysis of Notch1 promoter in DMSO or 100 ng mL−1 A@Glu‐NPs treated GL261 cells for 48 h using IgG or anti‐BRD4. Data are presented as mean ± SD. No significant difference is marked with ns. *P < 0.05, **P < 0.01, ***P < 0.001, and ****P < 0.0001.

Similar articles

Cited by

References

    1. Schaff L. R., Mellinghoff I. K., JAMA, J. Am. Med. Assoc. 2023, 329, 574. - PMC - PubMed
    1. van den Bent M. J., Geurts M., French P. J., Smits M., Capper D., Bromberg J. E. C., Chang S. M., Lancet 2023, 402, 1564. - PubMed
    1. Alejo S., Palacios B. E., Venkata P. P., He Y., Li W., Johnson J. D., Chen Y., Jayamohan S., Pratap U. P., Clarke K., Zou Y., Lv Y., Weldon K., Viswanadhapalli S., Lai Z., Ye Z., Chen Y., Gilbert A. R., Suzuki T., Tekmal R. R., Zhao W., Zheng S., Vadlamudi R. K., Brenner A. J., Sareddy G. R., Neuro Oncol 2023, 25, 1249. - PMC - PubMed
    1. van den Bent M. J., Tesileanu C. M. S., Wick W., Sanson M., Brandes A. A., Clement P. M., Erridge S., Vogelbaum M. A., Nowak A. K., Baurain J. F., Mason W. P., Wheeler H., Chinot O. L., Gill S., Griffin M., Rogers L., Taal W., Rudà R., Weller M., McBain C., Reijneveld J., Enting R. H., Caparrotti F., Lesimple T., Clenton S., Gijtenbeek A., Lim E., Herrlinger U., Hau P., Dhermain F., et al., Lancet Oncol. 2021, 22, 813. - PMC - PubMed
    1. Han B., Meng X., Wu P., Li Z., Li S., Zhang Y., Zha C., Ye Q., Jiang C., Cai J., Jiang T., Theranostics 2020, 10, 3351. - PMC - PubMed

MeSH terms

LinkOut - more resources