. 2024 Nov 14;8(11):e70039.
doi: 10.1002/hem3.70039. eCollection 2024 Nov.

Preclinical evaluation of the CD38-targeting engineered toxin body MT-0169 against multiple myeloma

Affiliations

Preclinical evaluation of the CD38-targeting engineered toxin body MT-0169 against multiple myeloma

Wassilis S C Bruins et al. Hemasphere. .

Abstract

Despite significant progress in the treatment of multiple myeloma (MM), relapsed/refractory patients urgently require more effective therapies. We here describe the discovery, mechanism of action, and preclinical anti-MM activity of engineered toxin body MT-0169, a next-generation immunotoxin comprising a CD38-specific antibody fragment linked to a de-immunized Shiga-like toxin A subunit (SLTA) payload. We show that specific binding of MT-0169 to CD38 on MM cell lines triggers rapid internalization of SLTA, causing cell death via irreversible ribosome inhibition, protein synthesis blockade, and caspase 3/7 activation. In co-culture experiments, bone marrow mesenchymal stromal cells did not induce drug resistance against MT-0169. In the preclinical setting, MT-0169 effectively lysed primary MM cells from newly diagnosed and heavily pretreated MM patients, including those refractory to daratumumab, with minimal toxicity against nonmalignant hematopoietic cells. MM cell lysis showed a significant correlation with their CD38 expression levels but not with cytogenetic risk, tumor load, or number of prior lines of therapy. Finally, MT-0169 showed efficient in vivo anti-MM activity in various mouse xenograft models, including one in which MM cells are grown in a humanized bone marrow-like niche. These findings support clinical investigation of MT-0169 in relapsed/refractory MM patients, including those refractory to CD38-targeting immunotherapies.


Conflict of interest statement

John Newcomb is a former employee of Takeda Development Center Americas, Inc., and a current employee of Dynamic Cell Therapies, Inc. Cambridge, MA, USA; Eric Poma is a current employee of Molecular Templates, Inc., and currently runs clinical oncology trials with MT‐0169. Chris Moore is a current employee of Molecular Templates, Inc., and currently runs clinical oncology trials with MT‐0169. Garrett L. Robinson is a current employee of Molecular Templates, Inc. Anya Lublinsky is a current employee and stockholder of Takeda Development Center Americas, Inc. Yuhong Zhang is a current employee and stockholder of Takeda Development Center Americas, Inc. Sakeena Syed is a former employee and stockholder of Takeda Development Center Americas, Inc. Michael Milhollen is a current employee and stockholder of Takeda Development Center Americas, Inc. Ajeeta B. Dash is a current employee and stockholder of Takeda Development Center Americas, Inc. Niels W. C. J. van de Donk has received research support from Janssen Pharmaceuticals, AMGEN, Celgene, Novartis, Cellectis, and BMS. He serves on advisory boards for Janssen Pharmaceuticals, AMGEN, Celgene, BMS, Takeda, Roche, Novartis, Bayer, Pfizer, Abbvie, Adaptive, and Servier, all paid to employer. Richard W. J. Groen has received research support from Takeda. Sonja Zweegman has received research support from Celgene, Takeda, and Janssen Pharmaceuticals. She serves on advisory boards for Celgene, Takeda, Janssen Pharmaceuticals, Sanofi, Amgen, and Oncopeptides (no personal funding). Tuna Mutis has received research support from Janssen Pharmaceuticals, Takeda, Genmab, Novartis, and ONK Therapeutics. For the remaining authors, no relevant conflicts of interest were declared.

Figures
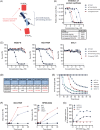
Figure 1
Figure 1
Mechanism of action and cytotoxic activity of MT‐0169 against CD38‐expressing MM cell lines. (A) Schematic of the MT‐0169 noncovalent dimer, an engineered toxin body consisting of a DI‐SLTA payload and the variable regions from a CD38‐targeting antibody connected by a short linker. (B) The catalytic domain of MT‐0169 retains the ability of the DI‐SLTA subunit to inhibit protein synthesis in a cell‐free translation system after 1.5‐h incubation while introducing point mutations in the DI‐SLTA payload of MT‐0169 (E167D and Y77S/E167D variants) abrogates this effect. (C) Cell viability of CD38‐positive MM cell lines NCI‐H929 and MOLP‐8, and CD38‐negative cell line EOL‐1 after 72‐h incubation with MT‐0169 or controls. (D) CD38‐positive MM cell lines (ANBL‐6, NCI‐H929, RPMI‐8226, and MOLP‐8) and a CD38‐negative colon cancer cell line (HCT‐116) were incubated with serial dilutions of MT‐0169 or anti‐CD38 scFv control. Viability was measured using CellTiter‐Glo® after 72 h. LD50 values were determined by nonlinear regression analysis. (E) Alternatively, the viability of these cell lines was assessed every 4 h over a period of 72 h using RealTime‐Glo™. (F) Percentage 28S ribosome depurination was measured by digital‐drop qPCR after exposure to MT‐0169 at three different doses for indicated time periods. (G) Activation of caspase 3/7 was measured in CD38‐positive cell lines MOLP‐8 and NCI‐H929, or CD38‐negative EOL‐1 after 24‐h incubation with a dilution series of MT‐0169. ABC, antigen‐binding capacity; DI‐SLTA, de‐immunized Shiga‐like toxin A subunit; DNT, did not test; MM, multiple myeloma; NA, not applicable; scFv, single chain variable fragment.
Figure 2
Figure 2
MT‐0169 efficacy against MM cell lines in a BMMSC co‐culture assay. The anti‐MM activity of MT‐0169 (0.003–30 nM) was measured against CD38‐positive LUC‐transduced MM cell lines RPMI‐8226 (n = 4; circle), MM.1S (n = 3; square) and UM9 (n = 2; triangle) after 48‐h incubation in the presence versus absence of primary BMMSC. Bortezomib (3–4 nM) was used as a positive control. Bars represent the mean ± SEM of all pooled experiments (n = 9). Groups were statistically compared using a two‐tailed paired t‐test. ns, not significant, *p < 0.05. BMMSC, bone marrow mesenchymal stromal cells; LUC, luciferase; MM, multiple myeloma; SEM, standard error of the mean.
Figure 3
Figure 3
Lytic capacity of MT‐0169 against primary MM cells in BM samples from patients. (A) Lytic activity of MT‐0169 (0.003–30 nM) against primary MM cells present in BM‐MNC samples from 37 MM patients in 48‐h flow cytometry‐based cytotoxicity assays. The lytic activity of the nontargeted DI‐SLTA molecule (15 nM; n = 25) was assessed to control for non‐specific cytotoxicity. Data points represent mean ± SEM. A dose‐response curve was generated using nonlinear regression analysis. (B) Lytic activity of MT‐0169 against primary MM cells in BM‐MNC samples from NDMM (n = 13), daratumumab‐naive RRMM (n = 11), and DRMM (n = 13) patients using nonlinear regression analysis. (C) Lysis of primary MM cells by MT‐0169 (30 nM) in BM‐MNC samples from NDMM, daratumumab‐naive RRMM, or DRMM patients. Data points represent individual samples, with bars and error bars depicting the mean ± SEM. (D) EC50 values of primary MM cell lysis were calculated using nonlinear regression analysis in each individual BM‐MNC sample from NDMM (n = 13), daratumumab‐naive RRMM (n = 11) and DRMM (n = 13) patients. Data points represent individual samples, with the line and error bars depicting mean ± SEM. (E) Left: surface CD38 expression levels on primary MM cells in BM‐MNC samples from NDMM, daratumumab‐naive RRMM, and DRMM patients. Expression levels (MFI) were assessed by flow cytometry. Data points represent individual samples, with box and whiskers showing the median, 25th−75th percentile, and range. Right: correlation analysis of primary MM cell lysis by MT‐0169 (30 nM) and CD38 expression levels (MFI) on primary MM cells. (F) Correlation analysis of primary MM cell lysis by MT‐0169 (30 nM) and time since the last daratumumab administration in samples from DRMM patients. (G) Correlation analysis of primary MM cell lysis by MT‐0169 (30 nM) and the number of prior lines of therapy. (H) Primary MM cell lysis in samples from patients with standard versus high cytogenetic risk using nonlinear regression analysis. Data points represent mean ± SEM. (I, J) Correlation analysis of primary MM cell lysis by MT‐0169 (30 nM) and tumor burden (i.e., percentage MM cells in the sample) (I) and calendar age (J). Groups in (C–E) were compared using one‐way analysis of variance with post hoc Tukey. All correlation analyses were done using the Pearson correlation coefficient. ns, not significant, *p < 0.05, **p < 0.01. BM‐MNC, bone marrow mononuclear cells; DI‐SLTA, de‐immunized Shiga‐like toxin A subunit; DRMM, daratumumab‐refractory multiple myeloma; MFI, median fluorescence intensity; MM, multiple myeloma; NDMM, newly diagnosed multiple myeloma; RRMM, daratumumab‐naive relapsed/refractory multiple myeloma; SEM, standard error of the mean.
Figure 4
Figure 4
Toxicity of MT‐0169 on nonmalignant hematopoietic cell subsets. (A) Surface CD38 expression levels on MM cells and various nonmalignant hematopoietic cell subsets within the tested BM‐MNC samples. Data points represent individual samples, with box and whiskers showing the median, 25th−75th percentile, and range. (B) Lytic activity of MT‐0169 against primary MM cells, CD4+ T‐cells, CD8+ T‐cells, B‐cells, NK‐cells, and monocytes in the tested BM‐MNC samples after 48‐h incubation using nonlinear regression analysis. Data points represent mean ± SEM. BM‐MNC, bone marrow mononuclear cells; MFI, median fluorescence intensity; MM, multiple myeloma; SEM, standard error of the mean.
Figure 5
Figure 5
Anti‐MM activity of MT‐0169 in various murine xenograft models. (A) MM xenografts were established subcutaneously using cell lines NCI‐H929 (8 mice per treatment group), LP‐1 (6 mice per treatment group), and MM.1S (7 mice per treatment group). After tumor volume‐based randomization, mice were dosed IV with MT‐0169 or vehicle control (phosphate‐buffered saline [PBS]) as indicated. Tumor measurements were made twice weekly. Data points represent the mean of all mice per treatment group ± SEM. (B) The efficacy of MT‐0169 was tested in a disseminated LUC‐transduced MM.1S model and tumor growth was followed via BLI weekly. Starting on Day 14, MT‐0169 was dosed IP in PBS once weekly for 4 weeks at the indicated dose levels. Data points represent the mean of all mice per treatment group ± SEM. Survival was measured by Kaplan–Meier analysis (right figure). (C) MT‐0169 and either ixazomib (left figure) or bortezomib (right figure) were tested alone and in combination in the MM.1S subcutaneous tumor xenograft model. MT‐0169 was dosed IV in PBS weekly at 6 mg/kg of body weight. Bortezomib was dosed at 0.25 mg/kg in PBS twice a week. Ixazomib was dosed at 1 mg/kg in 5% hydroxypropyl beta‐cyclodextrin twice weekly. Data points represent the mean of all mice per treatment group ± SEM. BLI, bioluminescence imaging; IP, intraperitoneal; IV, intravenous; LUC, luciferase; MM, multiple myeloma; QW, once per week; Q2W, once per 2 weeks; SEM, standard error of the mean.
Figure 6
Figure 6
Anti‐MM activity of MT‐0169 in a mouse model harboring a humanized BM‐like niche. (A) Schematic representation of the in vivo experiment with a scaffold‐based mouse model. For a detailed description refer to the materials and methods section. Briefly, 6 days after intrascaffold inoculation of LUC‐transduced UM9 tumor cells (Day 6), tumor growth was measured via BLI, and mice were randomized between the vehicle (PBS) or MT‐0169 (6 mg/kg body weight) treatment groups (n = 4 mice per group). Mice were then treated with IP injections on Days 7, 14, 21, and 28. Tumor growth was monitored via BLI on Days 16, 23, 29, 34, and 41, and was calculated relative to BLI values on Day 6. (B) Relative tumor growth was quantified via BLI in mice over time for the two treatment groups until the final time point when all mice were still part of the experiment. Data points represent the mean of all mice per treatment group ± SEM. Relative tumor growth was statistically compared between treatment groups on Day 34 using a two‐tailed Student t‐test. *p < 0.05. (C) BLI images from the left and right flanks of mice in the vehicle (PBS) and MT‐0169 groups at indicated time points. (D) All mice were sacrificed around Day 41 (±3 days) when either the humane endpoint (tumor volume) or experimental endpoint (Day 44) was reached. Expression levels of surface CD38 on postmortem, scaffold‐derived UM9 tumor cells were determined in both treatment groups using flow cytometry. UM9 tumor cells were identified by gating viable, nondoublet, mouse CD45‐negative, GFP‐positive cells. Each dot represents one mouse, and lines represent median values. Groups were statistically compared using a two‐tailed Student t‐test. BLI, bioluminescence imaging; IP, intraperitoneal; LUC, luciferase; MM, multiple myeloma; ns, not significant; SEM, standard error of the mean.

References

    1. Shah UA, Mailankody S. Emerging immunotherapies in multiple myeloma. BMJ. 2020;370:m3176. - PubMed
    1. Lokhorst HM, Plesner T, Laubach JP, et al. Targeting CD38 with daratumumab monotherapy in multiple myeloma. N Engl J Med. 2015;373(13):1207‐1219. - PubMed
    1. Moreau P, Attal M, Hulin C, et al. Bortezomib, thalidomide, and dexamethasone with or without daratumumab before and after autologous stem‐cell transplantation for newly diagnosed multiple myeloma (CASSIOPEIA): a randomised, open‐label, phase 3 study. Lancet. 2019;394(10192):29‐38. - PubMed
    1. Bahlis NJ, Dimopoulos MA, White DJ, et al. Daratumumab plus lenalidomide and dexamethasone in relapsed/refractory multiple myeloma: extended follow‐up of POLLUX, a randomized, open‐label, phase 3 study. Leukemia. 2020;34(7):1875‐1884. - PMC - PubMed
    1. Munshi NC, Anderson LD Jr., Shah N, et al. Idecabtagene vicleucel in relapsed and refractory multiple myeloma. N Engl J Med. 2021;384(8):705‐716. - PubMed

LinkOut - more resources