. 2024 Aug 19;65(5):341-353.
doi: 10.1002/jmd2.12442. eCollection 2024 Sep.

Reduced guanidinoacetate in plasma of patients with autosomal dominant Fanconi syndrome due to heterozygous P341L GATM variant and study of organoids towards treatment

Affiliations

Reduced guanidinoacetate in plasma of patients with autosomal dominant Fanconi syndrome due to heterozygous P341L GATM variant and study of organoids towards treatment

Ignacio Portales-Castillo et al. JIMD Rep. .

Abstract

Autosomal dominant Fanconi syndrome due to a GATM variant (GATM-FS), causes accumulation of misfolded arginine-glycine amidinotransferase (AGAT) in proximal renal tubules leading to cellular injury. GATM-FS presents during childhood and progresses to end-stage kidney disease (ESKD) in adults. We study creatine metabolism in two individuals of unrelated families with a known GATM variant and the effect of creatine supplementation in kidney organoids. Plasma and urine metabolites were measured by mass spectrometry. Brain creatine was assessed by magnetic resonance spectroscopy (MRS). Guanidinoacetate (GAA) synthesis by the AGAT mutant was measured in patient-derived immortalized lymphocytes using stable isotopes of arginine and glycine. The effect of creatine on GATM expression was assessed in human kidney cells and organoids. Several family members from two unrelated families were diagnosed with Fanconi syndrome and had the c.1022C>T (p. P341L) variant in GATM. Two affected individuals in both families had moderately reduced plasma GAA levels. In comparison to wild-type cells, GAA synthesis by patient-derived GATM P341L+/- lymphoblastoid cell lines (LCL) was reduced, but not absent as in GATM cells from a patient with creatine deficiency syndrome. In vitro studies on human kidney organoids revealed reduced AGAT expression after treatment with creatine. Finally, we showed in one patient that creatine supplementation (5 g daily) substantially increased plasma creatine levels. We report low plasma and urine GAA in patients with autosomal dominant GATM-FS and show that creatine downregulates AGAT in human kidney cells.

Keywords: Fanconi syndrome; GATM; arginine‐glycine amidinotransferase (AGAT); chronic kidney disease; creatine; guanidinoacetate; kidney organoids.


Conflict of interest statement

Ignacio Portales‐Castillo, Rhea Singal, Anastasia Ambrose, Jong Hee Song, Minsoo Son, Young Ah Goo, Wen Zhou, Avram Z. Traum, Ariella Coller‐Reilly, Benjamin D. Humphreys, Roberto Civitelli, Harald Jüppner, Andrew L. Lundquist, Peter Seres, Andrew S. Allegretti and Saadet Mercimek‐Andrews declare that they have no conflict of interest.

Figures
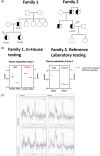
FIGURE 1
FIGURE 1
Creatine metabolites in families with CKD and GATM variants. (A) Pedigree of families 1 and 2. A GATM (c.1022C>T) variant was identified in the proband of Family 1 by commercial gene testing. Subsequently, we obtained DNA from blood and performed Sanger sequencing of GATM in all available family members. Only 3/10 were positive for GATM P341L heterozygous variant. The three of them had clinical CKD, while none of the affected relatives has CKD. In family 2, four first‐degree relatives were affected by CKD but only the proband was tested and found positive for the variant (/ = deceased). (B) The plasma and urine metabolites were measured in the proband and 2 healthy female relatives that donated blood from family 1. The measurements for family 1 (“In‐House testing”) were done by MTAC core at Washington University and repeated at the Massachusetts General Hospital, for a total of three repeats with comparable results, using plasma of healthy relatives as controls The graphic results are from a representative measurement. The metabolites in the patient in family 2 were measured at a reference laboratory with reference range illustrated in the graphic. The levels of plasma guanidinoacetate (GAA) in the patients in family 1 and 2 were 0.25 and 0.7 μmol/L, respectively. The levels of creatine in the two patients were 22.1 and 11.8 μmol/L, respectively. The laboratory reference range used to test the proband in family 2 were 1.1–3.3 μmol/L for GAA and 7.1–96 μmol/L for creatine. The lower limit of the laboratory reference range is marked with a discontinuous line in family 2. family. Published reference ranges for adult females, which can used to compare our results for patient in Family 1 are 0.87–3.15, 1.2–3.6 and 1–3.5 μmol/L for plasma GAA and 12.8–96.8, 12–99, 6–50 μmol/L for plasma creatine. (C) Brain magnetic resonance spectroscopy (chemical shift imaging, sLASER with TE = 135 ms). Fitted spectra are shown for control (70 year old female, left column) and individual with GATM‐FS (66 year old female, right column) for two regions—deep gray matter (basal ganglia, top row) and white matter (internal capsule, bottom row).
FIGURE 2
FIGURE 2
AGAT P341L enzyme activity. (A) Lollipop chart of variants in GATM and their phenotypes, including the amidinotransferase functional domain and visualized exons, red icons indicate variants causing AGAT deficiency, and black icons indicate variants causing autosomal dominant GATM related Fanconi syndrome. (B) Synthesis of GAA was measured in vitro using immortalized lymphocytes of two patients in family 1 (FI/III‐1 and FI/III‐2) and controls without GATM variant (WT) or cells from a patient with homozygous GATM variants causing creatine deficiency syndrome (GATM −/− ). The results showed lower GAA synthesis in two affected family members of family 1 compared to a control without GATM variant. The graphic results are normalized to the formation of GAA by cells obtained from a control without variants in GATM (100%). The experiment was repeated three times using separate cell vials each time, with 1–2 technical replicates in each measurement, with comparable results each time. In one repeat, the formation of GAA was quantified in nmol/hour/mg protein as 51.7 for the WT, 29.5 for FI/III‐1, 39.35 for FI/III‐2 and 0 for GATM −/− .
FIGURE 3
FIGURE 3
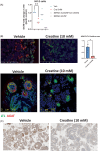
Creatine downregulates GATM expression in human cells. (A) Creatine downregulates GATM expression in PT cell lines (HK‐2 cells). The effect of creatine at 5 mM is eliminated by silencing of the creatine transporter SLC6A8. Figure is mean ± SD of 3 biological replicates, each done in triplicate. A two‐tail T test was used to establish significance and p values <0.05* were considered statistically significant. (B) Top panel: Representative images of kidney organoids are presented, using immunofluorescence (IF) methodologies to detect AGAT. For this experiment 3–4 separate vials of inducible pluripotent cells (iPSC) of the same cell line (BJFF6), were used to differentiate kidney organoids. After differentiation, 4 kidney organoids were supplemented with creatine in the media for 48 h and 3 were supplemented with equal volumetric amounts of water until collection. Entire organoids sections were imaged using Hamamatsu NanoZoomer. For quantification, areas of the same size as in the displayed IF figure were utilized to quantify positive areas for l‐Arginine:glycine amidinotransferase (AGAT) and Lotus tetragonolobus lectin (LTL) using Image J. The area of AGAT relative to LTL was compared among vehicle or creatine treated organoids. A two‐tail T test was used to compare and p values <0.05 were considered significant. Bottom panel: Confocal microscopy image of kidney organoid. We observed downregulation of AGAT in red by creatine in the PT, identified with the specific marker LTL in green. The figure is representative of 3–4 kidney organoids treated with either creatine or vehicle and differentiated in 3 separate biologic experiments. (C) Representative kidney organoid images using immunohistochemistry methodologies to detect AGAT. Entire organoids sections were imaged using Hamamatsu NanoZoomer.

References

    1. Reichold M, Klootwijk ED, Reinders J, et al. Glycine amidinotransferase (GATM), renal Fanconi syndrome, and kidney failure. J Am Soc Nephrol. 2018;29(7):1849‐1858. - PMC - PubMed
    1. Ragate DC, Memon SS, Karlekar M, et al. Inherited Fanconi renotubular syndromes: unveiling the intricacies of hypophosphatemic rickets/osteomalacia. J Bone Miner Metab. 2024;42(2):155‐165. - PubMed
    1. Li C‐Y, Sun Y, Guo W‐C, et al. Complex phenotype in Fanconi renotubular syndrome type 1: Hypophosphatemic rickets as the predominant presentation. Clin Chim Acta. 2024;561:119812. - PubMed
    1. Seaby EG, Turner S, Bunyan DJ, et al. A novel variant in GATM causes idiopathic renal Fanconi syndrome and predicts progression to end‐stage kidney disease. Clin Genet. 2023;103(2):214‐218. - PMC - PubMed
    1. Kudo H, Suzuki R, Kondo A, et al. Association of familial Fanconi syndrome with a novel GATM variant. Tohoku J Exp Med. 2023;260(4):337‐340. - PubMed

LinkOut - more resources