. 2024 Oct 31:15:1480675.
doi: 10.3389/fimmu.2024.1480675. eCollection 2024.

Possible involvement of Toll-like receptor 8-positive monocytes/macrophages in the pathogenesis of Sjögren's disease

Affiliations

Possible involvement of Toll-like receptor 8-positive monocytes/macrophages in the pathogenesis of Sjögren's disease

Lijing Yan et al. Front Immunol. .

Abstract

Background: Sjögren's disease (SjD) is an autoimmune disease marked by lymphocytic infiltration of salivary and lacrimal glands, leading to glandular dysfunction, where CD4-positive helper T (Th) cells and their cytokines are crucial in the pathogenesis. Recent studies have demonstrated that Toll-like receptors (TLRs), particularly those recognizing immune complexes containing DNA and RNA, contribute to Th cell activation in various autoimmune diseases. This study explores the expression and function of these TLRs in SjD.

Methods: DNA microarray analysis of salivary gland tissue from six SjD patients and real-time PCR (n = 32) was used to identify overexpressed TLRs. Single-cell RNA sequencing (scRNA-seq) was performed using tissue lesions and integrated with published scRNA-seq data from tissues and peripheral blood mononuclear cells to examine gene expression in macrophages and monocytes. Finally, multi-color immunofluorescence staining was conducted to confirm TLR8 expression and function in SjD lesions (n = 19).

Results: DNA microarray analysis revealed the up-regulation of TLR8, along with other TLRs and innate immune response genes in SjD. Real-time PCR showed significant up-regulation of TLR7 and TLR8. TLR8 up-regulated in both analyses. In scRNA-seq analysis, the TLR8-expressing cluster comprised macrophages and monocytes, which also produced T cell activation genes like CD86. TLR8-positive macrophages infiltrated inflammatory sites and frequently expressed CD86 in quantitative imaging approaches.

Conclusions: These results suggest that infiltrating monocytes and macrophages may produce cytokines and chemokines through TLR8 stimulation, potentially enhancing B7 molecule expression, promoting the adaptive immune response, and contributing to SjD pathogenesis.

Keywords: CD86; Sjögren’s disease; Toll-like receptor 8; macrophage; monocyte.


Conflict of interest statement

The authors declare that the research was conducted in the absence of any commercial or financial relationships that could be construed as a potential conflict of interest.

Figures

Figure 1
Figure 1
Workflow and microarray analysis. (A) Summary and schema of the workflow. Salivary gland tissue and PBMCs were used for the DNA microarray and scRNA-seq analyses, and multi-color immunofluorescence staining. Figure created with BioRender.com. (B) UMAP visualization and PERMANOVA analysis. PERMANOVA was computed based on coordinates derived from the UMAP after removing batch effects. R2 indicated 34.17% variation between the SjD and HC groups, with a P-value of < 0.05 indicating a significant difference. (C) DEGs of SjD compared with HCs. Genes were computed using the edge package in R for the microarray data. Cutoff values were set at log 2-fold change > 1.5 with an adjusted P-value of < 0.05. The DEGs counts were 996 up-regulated and 743 down-regulated among a total of 22,173 genes. (D) Heatmap for DEGs between the SjD and HC groups. The selected genes for presentation revealed a different gene expression pattern between SjD and HC regarding the TLR signaling pathway, pro-inflammation, chemokines, IFN response, and MHC I/II pathways. The order of the samples in each group was sorted in ascending order of a monocyte marker CD14 expression, from top to bottom. (E) GO enrichment analysis based on DEGs. Enriched gene ontology terms for DEGs in the SjD group compared with the HC groups are presented as a dot plot, in which the dot size represents the gene ratio and color represents the P-values (all, < 0.05). (F) Linkages of genes and GO categories visualized via a Cnetplot. TLR8 plays a central role in the connecting TLR signaling pathway, positive regulation of cytokine production, and positive regulation of the innate immune response. (G, H) KEGG pathway gene set enrichment analysis. TLR and NF-κB signaling pathways were significantly up-regulated in the SjD group, with adjusted P-values of 0.0016 for both. (I) Real-time PCR for specific TLRs. TLR7 and TLR8 were significantly up-regulated in the SjD group (n = 32) versus the HC group (n = 18), determined by Mann–Whitney U test (**P < 0.01; ns, not significant). PBMC, peripheral blood mononuclear cell; scRNA, single-cell RNA; UMAP, uniform manifold approximation and projection; PERMANOVA, permutational multivariate analysis of variance; SjD, Sjögren’s disease; HC, healthy control; DEGs, differentially expressed genes; TLR, Toll-like receptor; IFN, interferon; MHC I/II, major histocompatibility complex I/II; GO, gene ontology; KEGG, Kyoto Encyclopedia of Genes and Genomes; NF-κB, nuclear factor-κB; PCR, polymerase chain reaction.
Figure 2
Figure 2
Single-cell RNA-seq analysis for both tissue infiltrating and circulating macrophages/monocytes. (A) Visualizations of immune cell subsets. A total of 84,017 cells from 27 samples are shown entirely (left) and divided by groups and source (right). ASC: antibody-secreting cells, B: B cells, CD4+ T: cluster of differentiation 4+ T cells, CD8+ T: CD8+ T cells, DC: dendritic cells, Mast: mast cells, Mφ/mono: macrophages/monocytes, NK/NKT: natural killer cells/natural killer T cells, pDC: plasmacytoid dendritic cells. (B) Expression of marker genes for identifying cell phenotypes. The color reflects the average expression after normalization, and the size reflects the percentage of markers expressed in these clusters. (C, D) Feature plot of CD68 and TLR8 expression. TLR8-expressing cells are clearly concentrated in the CD68 high Mφ/mono cluster both in tissues and PBMCs. (E) Composition of TLR8-expressing cells. The proportion of TLR8-expressing cells in the Mφ/mono cluster was markedly higher than those of other cell clusters, whether in tissues (inner) or PBMCs (outer). (F) Gene expression patterns of the different groups. Eight groups were classified by SjD/HC group, tissue/PBMC sample, and TLR8 +/− status. The gene expression patterns related to pro-inflammation and T cell activation, chemokines, IFN response, and MHC I and MHC II antigen processing are shown. RNA-seq, RNA sequence; TLR, Toll-like receptor; Mφ/mono, macrophages/monocytes; PBMC, peripheral blood mononuclear cell; SjD, Sjögren’s disease; HC, healthy controls; IFN, interferon; MHC, major histocompatibility complex.
Figure 3
Figure 3
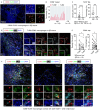
Multi-color immunofluorescence staining and cell quantification. (A) Representative images of CD68+ TLR8+ macrophages in SjD tissue. Scale bars: 100 µm (low magnification) and 20 µm (high magnification). (B) Composition ratio of TLR8+/− macrophages in SjD (n = 19) and CS (n = 6) tissues, gated by CD68+. (C) Density and percentage of TLR8+ macrophages in SjD and CS tissues. (D) Representative images of TLR8+ CD86+ macrophages in SjD tissue. Scale bars: 50 µm (low magnification), 20 µm (medium magnification), and 10 µm (high magnification). (E) Density and proportion of CD86+ expression in TLR8+/− macrophages in SjD tissue. Statistically significant differences between groups were determined by Mann–Whitney U test (****P < 0.0001, ***P < 0.001) and Wilcoxon matched-pairs signed rank test (†P < 0.05). (F) Representative images of TLR8+ CD86+ macrophages contact with CD4+ or CD8+ T cells in SjD tissue. Scale bars: 50 µm (low magnification) and 10 µm (high magnification). CD, cluster of differentiation; TLR, Toll-like receptor; SjD, Sjögren’s disease; CS, chronic sialadenitis.
Figure 4
Figure 4
Schematic model of the pathogenesis of SjD. Stimulation by antigens, such as self-derived RNA and viruses, triggers and activates the TLR8 signaling pathway in TLR8+ monocytes/macrophages. These TLR8+ monocytes/macrophages strongly express CD86 and induce T cell activation by binding CD28 on T cells. CD4+ Th cells are activated by antigen presentation through the MHC II pathway, whereas Naïve CD8+ T cells become effector CD8+ CTLs by antigen cross-presentation through the MHC I pathway. CD8+ CTLs cause apoptosis of salivary gland cells via their cytotoxicity. Some of the effector CD4+ T cells may help in the differentiation of B cells to plasma cells, which produce antibodies to the autoantigens, resulting in irreversible secretory dysfunction. TLR, Toll-like receptor; CD, cluster of differentiation; CTL, cytotoxic T lymphocytes; MHC, major histocompatibility complex; Th, T helper cells. Figure created with BioRender.com.

References

    1. Fox RI. Sjögren’s syndrome. Lancet. (2005) 366:321–31. doi: 10.1016/s0140-6736(05)66990-5 - DOI - PubMed
    1. Vivino FB, Carsons SE, Foulks G, Daniels TE, Parke A, Brennan MT, et al. . New treatment guidelines for sjogren’s disease. Rheum Dis Clin North Am. (2016) 42:531–51. doi: 10.1016/j.rdc.2016.03.010 - DOI - PMC - PubMed
    1. Kaneko N, Chen H, Perugino CA, Maehara T, Munemura R, Yokomizo S, et al. . Cytotoxic CD8(+) T cells may be drivers of tissue destruction in Sjogren’s syndrome. Sci Rep. (2022) 12:15427. doi: 10.1038/s41598-022-19397-w - DOI - PMC - PubMed
    1. Marshak-Rothstein A. Toll-like receptors in systemic autoimmune disease. Nat Rev Immunol. (2006) 6:823–35. doi: 10.1038/nri1957 - DOI - PMC - PubMed
    1. Duan T, Du Y, Xing C, Wang HY, Wang RF. Toll-like receptor signaling and its role in cell-mediated immunity. Front Immunol. (2022) 13:812774. doi: 10.3389/fimmu.2022.812774 - DOI - PMC - PubMed