. 2024 Jun 9;9(6):e10690.
doi: 10.1002/btm2.10690. eCollection 2024 Nov.

AAVS1-targeted, stable expression of ChR2 in human brain organoids for consistent optogenetic control

Affiliations

AAVS1-targeted, stable expression of ChR2 in human brain organoids for consistent optogenetic control

Soojung Hong et al. Bioeng Transl Med. .

Abstract

Self-organizing brain organoids provide a promising tool for studying human development and disease. Here we created human forebrain organoids with stable and homogeneous expression of channelrhodopsin-2 (ChR2) by generating AAVS1 safe harbor locus-targeted, ChR2 knocked-in human pluripotent stem cells (hPSCs), followed by the differentiation of these genetically engineered hPSCs into forebrain organoids. The resulting ChR2-expressing human forebrain organoids showed homogeneous cellular expression of ChR2 throughout entire regions without any structural and functional perturbations and displayed consistent and robust neural activation upon light stimulation, allowing for the non-virus mediated, spatiotemporal optogenetic control of neural activities. Furthermore, in the hybrid platform in which brain organoids are connected with spinal cord organoids and skeletal muscle spheroids, ChR2 knocked-in forebrain organoids induced strong and consistent muscle contraction upon brain-specific optogenetic stimulation. Our study thus provides a novel, non-virus mediated, preclinical human organoid system for light-inducible, consistent control of neural activities to study neural circuits and dynamics in normal and disease-specific human brains as well as neural connections between brain and other peripheral tissues.

Keywords: AAVS1 locus; channelrhodopsin‐2; forebrain organoids; optogenetics.


Conflict of interest statement

The authors have no potential conflicts of interest to disclose.

Figures

FIGURE 1
FIGURE 1
Establishment of ChR2‐engineered hPSC lines by targeted introduction of EF1α‐ChR2 into the AAVS1 locus. (a) Experimental scheme to generate ChR2‐engineered hPSCs using the donor plasmid and RNP system. Heterozygously targeted and homozygously targeted hPSC clones are obtained after puromycin selection. (b) Schematic illustration of the AAVS1 locus targeted with EF1α‐ChR2. (c) Genotyping strategies to identify targeted hPSC clones. PCR primers were designed to detect normal and targeted AAVS1 alleles, whose amplification results in 1.4 and 1.2 kbp fragments, respectively. (d) PCR genotyping results of ChR2‐engineered hPSC clones by the amplification of 3 primers: P1, P2, and P3. The 1.4 kbp band indicates the presence of normal alleles, whereas the 1.2 kbp band represents the targeted allele. (e) The sequencing results of the recombination sites of ChR2‐engineered hPSC clones. (f) The sequencing results of the recombination sites at the non‐targeted allele of ChR2‐engineered, heterozygous clones.
FIGURE 2
FIGURE 2
Homogeneous and stable expression of ChR2 in ChR2‐engineered hPSCs. (a) Relative expressions of ChR2 in ChR2‐engineered and control hPSCs. ChR2‐1, 2, 6, 9, 12, and 13, heterozygous clones; ChR2‐3, 4, 7, and 8, homozygous clones. Four technical replicates were evaluated for each line (n = 4). Significance was calculated using two‐tailed nested t‐test. (b) Western blot analyses of ChR2‐engineered hPSCs. ChR2‐2 and 9, heterozygous clones; ChR2‐3 and 4, homozygous clones; neg ctrl, negative control (non‐targeted hPSC); pos ctrl, positive control (HEK293 cells transfected with ChR2). (c) Immunofluorescence analysis for ChR2 in control hPSCs and ChR2‐engineered hPSC lines (ChR2‐2, ChR2‐3). Scale bar, 20 μm. (d) Quantification of relative ChR2 expression level in control hPSCs and ChR2‐engineered hPSC lines (ChR2‐2, ChR2‐3). Each dot represents the mean intensity of the ROI. Three ROIs from five colonies were analyzed (n = 15). Significance was calculated using an unpaired t‐test. (e) Relative expressions of ChR2 in ChR2‐engineered hPSC lines (ChR2‐2, ChR2‐3) following passages. Five technical replicates were evaluated in each group (n = 5). Significance was calculated using two‐tailed nested t‐test. (f) Immunofluorescence analysis of the pluripotency marker OCT4 in control hPSCs and ChR2‐engineered hPSC lines (ChR2‐2, ChR2‐3). Scale bar, 100 μm. (g) Immunofluorescence analysis of the pluripotency marker SOX2 in control hPSCs and ChR2‐engineered hPSC lines (ChR2‐2, ChR2‐3). Scale bar, 100 μm.
FIGURE 3
FIGURE 3
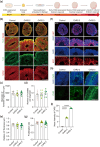
Characterization of ChR2‐engineered forebrain organoids at the early stage. (a) Experimental scheme to generate ChR2‐engineered forebrain organoids. (b) Representative images of forebrain organoids at day 35 immunostained for the NPC marker SOX2 and the neuronal marker TUJ1. Scale bar, 100 μm. (c) Quantification of the diameter of control and ChR2‐engineered forebrain organoids. Forebrain organoids were imaged with brightfield and evaluated (n = 15). Significance was calculated using an unpaired t‐test. (d) Quantification of the number of rosettes in control and ChR2‐engineered forebrain organoids. Two sections per sample, four biological replicates in each group were evaluated (n = 8). Significance was calculated using an unpaired t‐test. (e) Quantification of the relative VZ thickness of control and ChR2‐engineered forebrain organoids. Five rosettes per sample, three biological replicates were analyzed (n = 15). Significance was calculated using an unpaired t‐test. (f) Representative images of forebrain organoids at day 35 immunostained for the proliferation marker Ki67. Scale bar, 100 μm. (g) Quantification of the proliferation rate using Ki67+ cells of DAPI+ cells. Five rosettes per sample, three biological replicates in each group were evaluated (n = 15). Significance was calculated using an unpaired t‐test. (h) Representative images of forebrain organoids at day 35 immunostained for ChR2. Scale bar, 50 μm. (i) Quantification of ChR2 intensity in control, ChR2‐2, and ChR2‐3 forebrain organoids. Five sections per sample, three biological replicates in each group were evaluated (n = 15). Significance was calculated using an unpaired t‐test.
FIGURE 4
FIGURE 4
Characterization of ChR2‐engineered forebrain organoids at the late stage. (a) Representative images of forebrain organoids at day 65 immunostained for SOX2 and MAP2. Scale bar, 100 μm. (b) Quantification of the diameter of control and ChR2‐engineered forebrain organoids. Forebrain organoids were imaged with brightfield and evaluated (n = 15). Significance was calculated using an unpaired t‐test. (c) Quantification of the number of rosettes in control and ChR2‐engineered forebrain organoids. Two sections per sample, four biological replicates in each group were evaluated (n = 8). Significance was calculated using an unpaired t‐test. (d) Quantification of the relative VZ thickness of control and ChR2‐engineered forebrain organoids. Five rosettes per sample, three biological replicates were analyzed (n = 15). Significance was calculated using an unpaired t‐test. (e) Representative images of forebrain organoids at day 65 immunostained for Ki67. Scale bar, 100 μm. (f) Quantification of the proliferation rate using Ki67+ cells of DAPI+ cells. Five rosettes per sample, three biological replicates in each group were evaluated (n = 15). Significance was calculated using an unpaired t‐test. (g) Representative images of forebrain organoids at day 65 immunostained for ChR2. Scale bar, 50 μm. (h) Quantification of ChR2 intensity in control, ChR2‐2, and ChR2‐3 forebrain organoids. Five sections per sample, three biological replicates in each group were evaluated (n = 15). Significance was calculated using an unpaired t‐test.
FIGURE 5
FIGURE 5
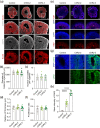
Comparative analysis of ChR2‐engineered forebrain organoids over an extended culture period. (a) Representative images of forebrain organoids at day 150 immunostained for SOX2 and MAP2. Scale bar, 100 μm. (b) Quantification of the diameter of control and ChR2‐engineered forebrain organoids. Forebrain organoids were imaged with brightfield and evaluated (n = 15). Significance was calculated using an unpaired t‐test. (c) Quantification of the diameter of control and ChR2‐engineered forebrain organoids on days 35, 65 and 150. Forebrain organoids were imaged with brightfield and evaluated (n = 15). Significance was calculated using an unpaired t‐test. (d) Representative images of forebrain organoids at day 150 immunostained for ChR2. Scale bar, 50 μm. (e) Quantification of ChR2 intensity in control and ChR2‐engineered forebrain organoids. Five sections per sample, three biological replicates in each group were evaluated (n = 15). Significance was calculated using an unpaired t‐test. (f) Quantification of ChR2 intensity in control and ChR2‐engineered forebrain organoids on days 35, 65 and 150. Five sections per sample, three biological replicates in each group were evaluated (n = 15). Significance was calculated using an unpaired t‐test.
FIGURE 6
FIGURE 6
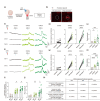
Optogenetic control of neural activities in ChR2‐engineered forebrain organoids. (a) Schematic illustration to examine neural activation upon optogenetic stimulation of ChR2‐engineered forebrain organoids by calcium imaging using Cal‐590 AM. (b) Representative images of Cal‐590 AM in ChR2‐engineered forebrain organoids before and after light stimulation. Scale bar, 5 μm. (c) Representative traces of calcium imaging analysis of selected cells following light stimulation of control and ChR2‐engineered forebrain organoids. (d) Quantification of stimulation‐triggered amplitudes, shown in comparison to randomized‐triggered amplitudes in control and ChR2‐engineered forebrain organoids. The median amplitude of the five pulses delivered per cell is shown. Five cells per sample, three to four biological replicates were evaluated in each group (Control, n = 20; ChR2‐2, n = 15; ChR2‐3, n = 15). Significance was calculated using an unpaired t‐test. (e) Quantification of peak amplitudes by measuring the relative changes in the fluorescence intensity (dF/F) of control and ChR2‐engineered forebrain organoids. Five cells per sample, three biological replicates were evaluated in each group (n = 15). Significance was calculated using an unpaired t‐test. (f) Representative traces of calcium imaging analysis of selected cells following light stimulation of control and ChR2‐engineered forebrain organoids. (g) Quantification of stimulation‐triggered amplitudes, shown in comparison to randomized‐triggered amplitudes in control and ChR2‐engineered forebrain organoids. The median amplitude of the five pulses delivered per cell is shown. Five cells per sample, three biological replicates were evaluated in each group (n = 15). Significance was calculated using an unpaired t‐test. (h) Quantification of peak amplitudes by measuring the relative changes in the fluorescence intensity (dF/F) of day 65 control and ChR2‐engineered forebrain organoids. Five cells per sample, three biological replicates were evaluated in each group (n = 15). Significance was calculated using an unpaired t‐test. (i) Quantification of stimulation‐triggered amplitudes in control and ChR2‐engineered forebrain organoids. The median amplitude of the five pulses delivered per cell is shown. Five cells per sample, three biological replicates were evaluated in each group (n = 15). Significance was calculated using an unpaired t‐test. (j) Quantification of peak amplitudes of day 150 control and ChR2‐engineered forebrain organoids. Five cells per sample, three biological replicates were evaluated in each group (n = 15). Significance was calculated using an unpaired t‐test. (k) Quantification of the proportion of ChR2‐engineered forebrain organoids that exhibit ChR2‐expression, functional activity upon light stimulation, and viability, based on a total of 15 organoids examined on days 35, 65, and 150.
FIGURE 7
FIGURE 7
Optogenetic stimulation of ChR2‐engineered forebrain organoids to control muscle activities in forebrain‐spinal cord‐skeletal muscle hybrid assembloids. (a) Experimental scheme to generate forebrain‐spinal cord‐skeletal muscle hybrid assembloids. (b) Representative brightfield image of intact forebrain‐spinal cord‐skeletal muscle hybrid assembloids. This image was generated by tiling multiple images. Scale bar, 100 μm. (c) Schematic illustrations for optogenetic experiments. Skeletal muscle activity upon selective light stimulation on forebrain organoids within forebrain–spinal cord–skeletal muscle hybrid assembloids was examined by calcium imaging and contraction analysis. (d) Representative images of Cal‐590 AM in skeletal muscle before and after light stimulation of ChR2‐engineered forebrain organoids in forebrain–spinal cord–skeletal muscle hybrid assembloids. Scale bar, 100 μm. (e) Representative traces of calcium imaging analysis of selected cells in skeletal muscle spheroids following light stimulation of control, AAV‐infected, and ChR2‐3 hybrid assembloids with day 65 forebrain organoids. (f) Quantification of stimulation‐triggered amplitudes in skeletal muscles, shown in comparison to randomized‐triggered amplitudes. The median dF/F amplitude of the five pulses delivered per cell is shown. Five cells per sample, three biological replicates were evaluated in each group (n = 15). (g) Muscle contraction analyses of control, AAV‐infected, and ChR2‐3 hybrid assembloids. (h) Quantification of muscle contraction in hybrid assembloids. Spontaneous contraction was recorded for 2 min and optogenetic stimulation was given 5 times every 110 s. The highest value of displacement in the pre‐stimulation stage was measured and the average of the highest value immediately after every stimulation was quantified using MUSCLEMOTION. Five peak contractions followed by five optogenetic stimulus for three biological replicates were evaluated in each group (n = 15). Significance was calculated using an unpaired t‐test. (i) Representative traces of calcium imaging analysis of selected cells in skeletal muscle spheroids following light stimulation of control and ChR2‐3 hybrid assembloids with day 150 forebrain organoids. (j) Quantification of stimulation‐triggered amplitudes in skeletal muscles, shown in comparison to randomized‐triggered amplitudes. The median dF/F amplitude of the five pulses delivered per cell is shown. Five cells per sample, three biological replicates were evaluated in each group (n = 15). (k) Muscle contraction analyses of control and ChR2‐3 hybrid assembloids with day 150 forebrain organoids. (l) Quantification of muscle contraction in hybrid assembloids using MUSCLEMOTION. Five peak contractions followed by five optogenetic stimulus for three biological replicates were evaluated in each group (n = 15). Significance was calculated using an unpaired t‐test. (m) Quantification of stimulation‐triggered amplitudes in skeletal muscles in control and ChR2‐3 hybrid organoids with days 65 and 150 forebrain organoids. The median dF/F amplitude of the five pulses delivered per cell is shown. Five cells per sample, three biological replicates were evaluated in each group (n = 15). (n) Quantification of muscle contraction in hybrid assembloids using MUSCLEMOTION in control and ChR2‐3 hybrid assembloids with days 65 and 150 forebrain organoids. Five peak contractions followed by five optogenetic stimulus for three biological replicates were evaluated in each group (n = 15). Significance was calculated using an unpaired t‐test.

Similar articles

Cited by

References

    1. Eiraku M, Watanabe K, Matsuo‐Takasaki M, et al. Self‐organized formation of polarized cortical tissues from ESCs and its active manipulation by extrinsic signals. Cell Stem Cell. 2008;3(5):519‐532. doi:10.1016/j.stem.2008.09.002 - DOI - PubMed
    1. Lancaster MA, Renner M, Martin C‐A, et al. Cerebral organoids model human brain development and microcephaly. Nature. 2013;501(7467):373‐379. doi:10.1038/nature12517 - DOI - PMC - PubMed
    1. Renner M, Lancaster MA, Bian S, et al. Self‐organized developmental patterning and differentiation in cerebral organoids. EMBO J. 2017;36(10):1316‐1329. doi:10.15252/embj.201694700 - DOI - PMC - PubMed
    1. Kadoshima T, Sakaguchi H, Nakano T, et al. Self‐organization of axial polarity, inside‐out layer pattern, and species‐specific progenitor dynamics in human ES cell‐derived neocortex. Proc Natl Acad Sci U S A. 2013;110(50):20284‐20289. doi:10.1073/pnas.1315710110 - DOI - PMC - PubMed
    1. Lancaster MA, Knoblich JA. Generation of cerebral organoids from human pluripotent stem cells. Nat Protoc. 2014;9(10):2329‐2340. - PMC - PubMed

LinkOut - more resources