. 2024 Nov 15;134(22):e170669.
doi: 10.1172/JCI170669.

Defects in meiosis I contribute to the genesis of androgenetic hydatidiform moles

Affiliations

Defects in meiosis I contribute to the genesis of androgenetic hydatidiform moles

Maryam Rezaei et al. J Clin Invest. .

Abstract

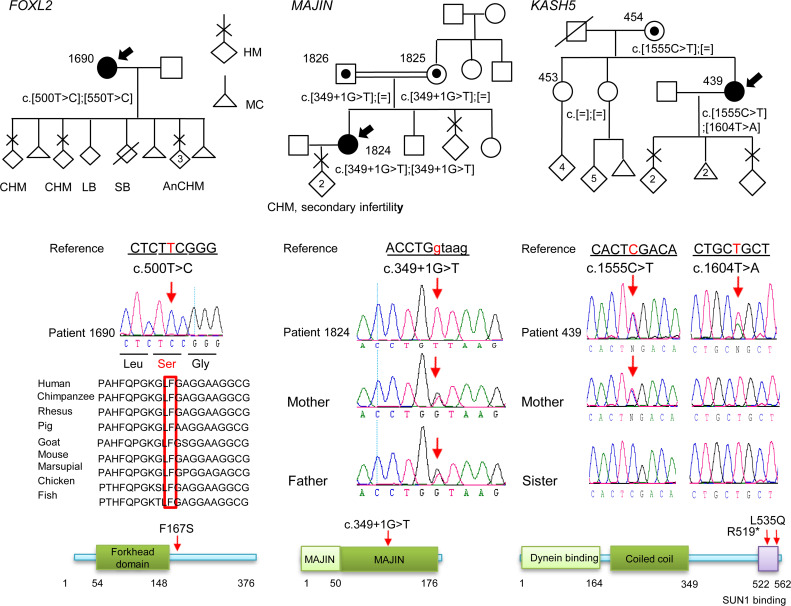
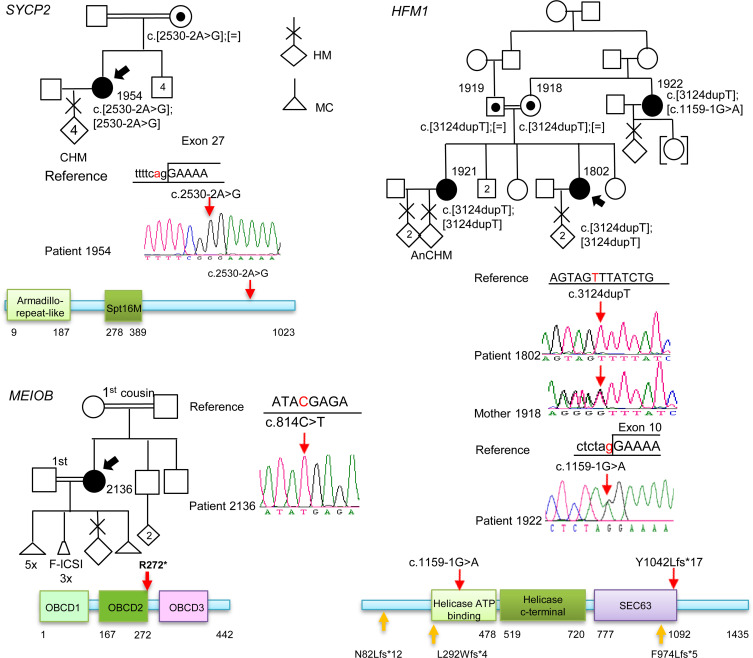
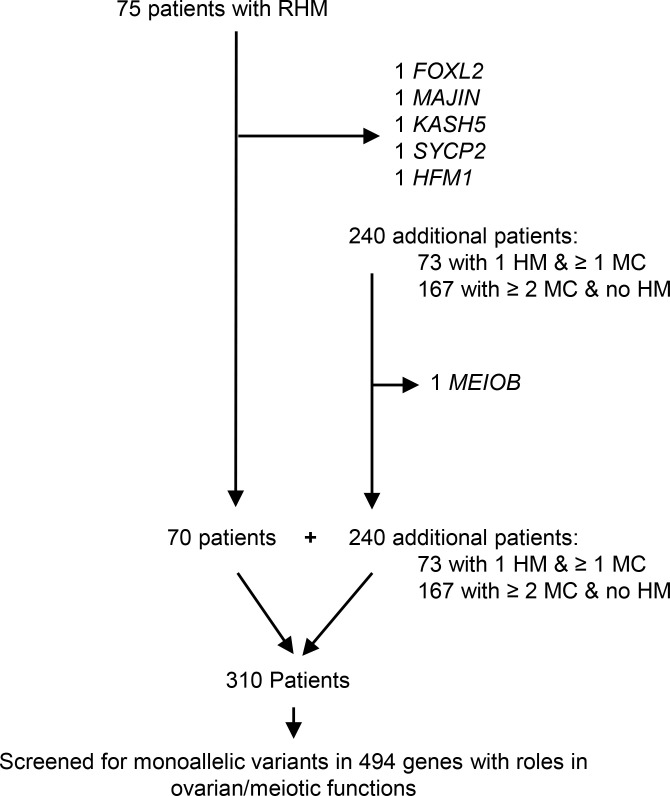
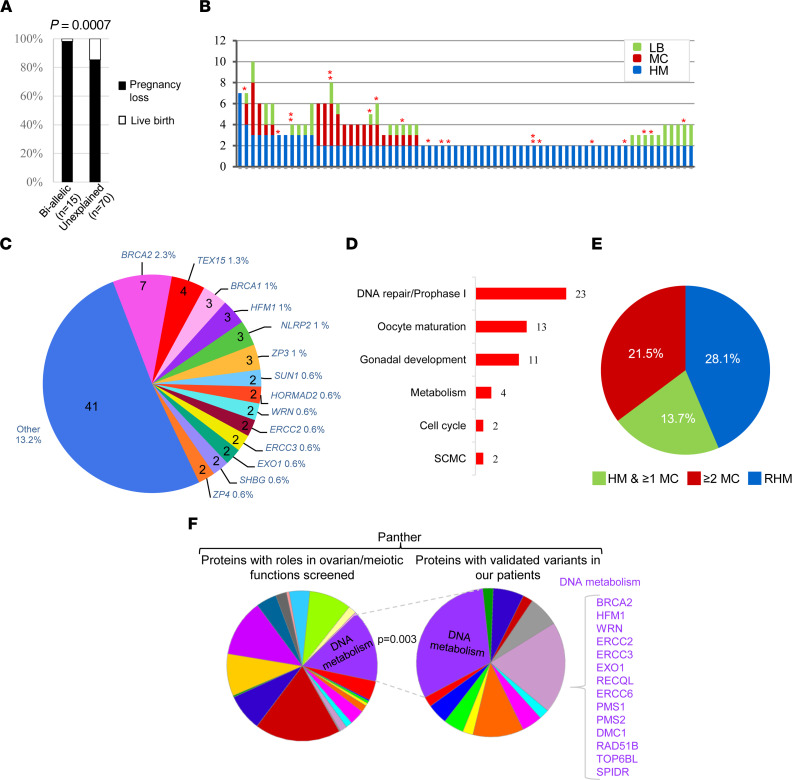
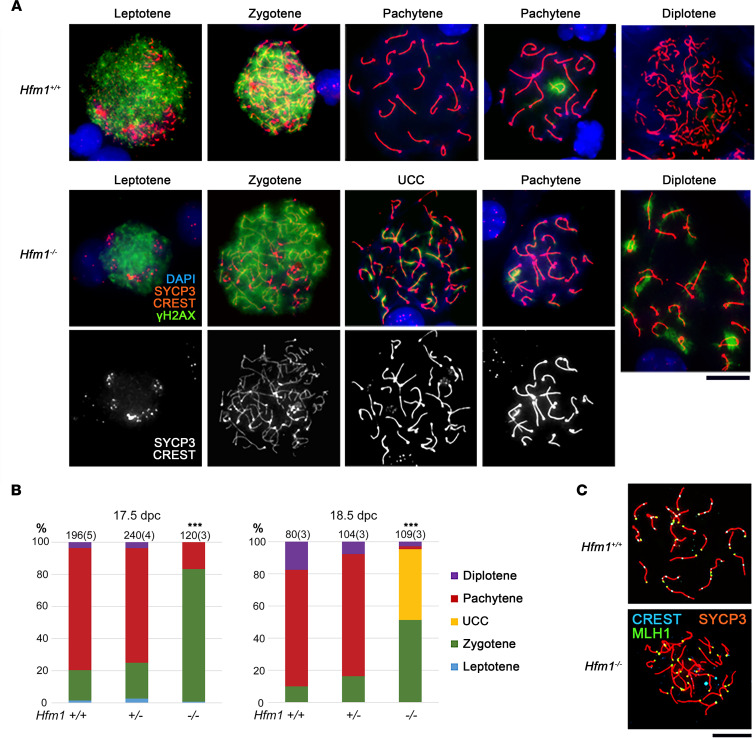
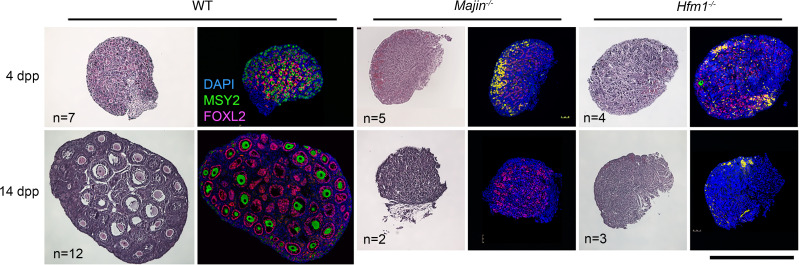
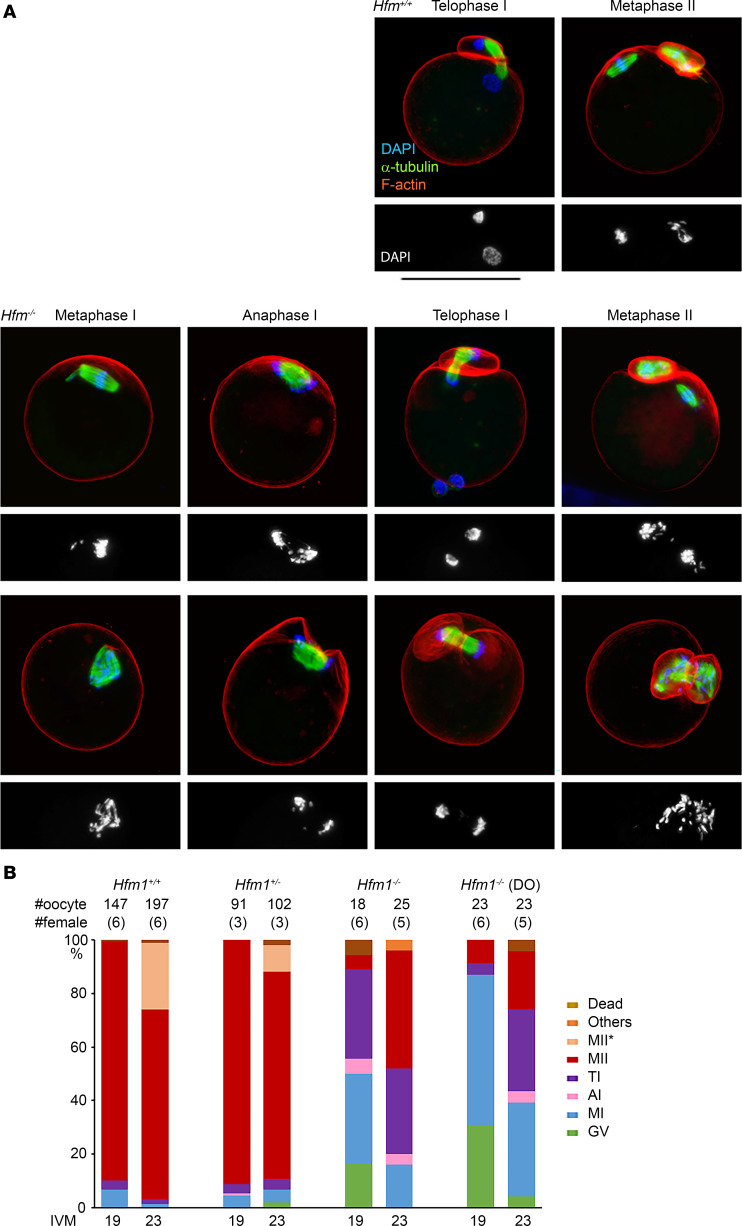
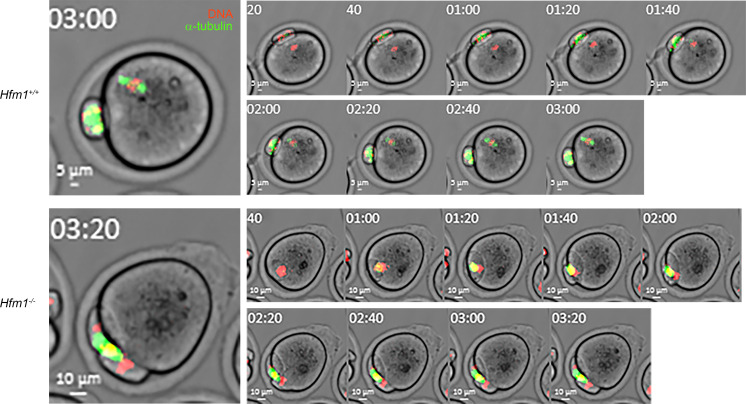
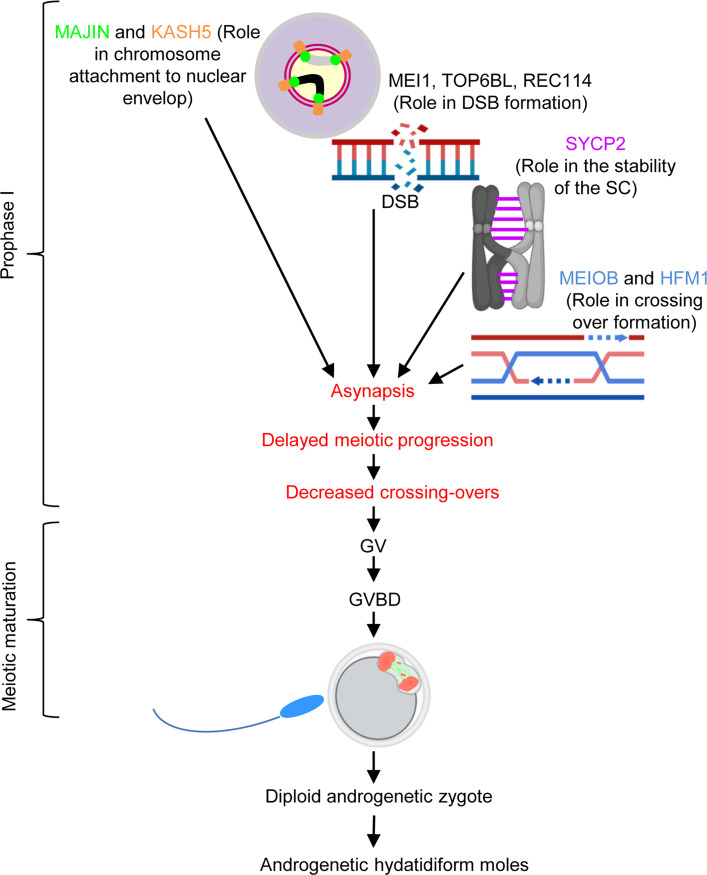
To identify novel genes responsible for recurrent hydatidiform moles (HMs), we performed exome sequencing on 75 unrelated patients who were negative for mutations in the known genes. We identified biallelic deleterious variants in 6 genes, FOXL2, MAJIN, KASH5, SYCP2, MEIOB, and HFM1, in patients with androgenetic HMs, including a familial case of 3 affected members. Five of these genes are essential for meiosis I, and their deficiencies lead to premature ovarian insufficiency. Advanced maternal age is the strongest risk factor for sporadic androgenetic HM, which affects 1 in every 600 pregnancies. We studied Hfm1-/- female mice and found that these mice lost all their oocytes before puberty but retained some at younger ages. Oocytes from Hfm1-/- mice initiated meiotic maturation and extruded the first polar bodies in culture; however, their meiotic spindles were often positioned parallel, instead of perpendicular, to the ooplasmic membrane at telophase I, and some oocytes extruded the entire spindle with all the chromosomes into the polar bodies at metaphase II, a mechanism we previously reported in Mei1-/- oocytes. The occurrence of a common mechanism in two mouse models argues in favor of its plausibility at the origin of androgenetic HM formation in humans.

Keywords: Fertility; Genetics; Monogenic diseases; Reproductive biology.


Figures

Figure 1
Figure 1. Pedigrees, Sanger sequencing, and segregation of the variants in FOXL2, MAJIN, and KASH5.
The probands are indicated by arrows. Amino acid numbering is given below the protein structure. On the protein structure, the red arrows indicate the positions of the variants seen in a recessive state. HM, hydatidiform mole; CHM, complete HM; AnCHM, androgenetic CHM; LB, live birth; SB, stillbirth; MC, miscarriage.
Figure 2
Figure 2. Pedigrees, Sanger sequencing, and segregation of the variants in SYCP2, MEIOB, and HFM1.
The probands are indicated by arrows. Amino acid numbering is given below the protein structure. On the protein structure, the red arrows indicate variants seen in a recessive state, and the orange arrows indicate variants seen as a single heterozygous variant. HM, hydatidiform mole; CHM, complete HM; AnCHM, androgenetic CHM; F-ICSI, failed intracytoplasmic sperm injection.
Figure 3
Figure 3. Recapitulation of the number of analyzed patients by WES from different categories.
Identified genes with deleterious biallelic variants are indicated.
Figure 4
Figure 4. Enrichment of monoallelic P/LP variants in genes with roles in DNA metabolism.
(A) Percentage of live births and pregnancy losses in patients negative for causative biallelic variants. (B) Detailed reproductive history of the 70 patients with RHM shown in A. Each patient is represented by a vertical bar on the x axis, and the number of each type of her pregnancy outcomes on the y axis. Asterisks denote the number of identified P/LP variants in the patient. (C) Proportional contribution of genes to the genetic susceptibility of the 310 analyzed patients. Numbers inside the pie indicate the number of patients with P/LP variants in each gene, and percentages outside the pie indicate the proportion of patients with P/LP variants in a given gene among the 310 patients. (D) Roles and functions of genes with P/LP variants based on GeneCards and PubMed. The numbers of variants in genes with the indicated functions are shown on the right of the bars. (E) The frequencies of P/LP variants in the 3 categories of patients. (F) Panther analysis showing a significant enrichment of monoallelic P/LP variants in the category of DNA metabolism in our patients while proteins from this category accounted for a smaller percentage in our input list. Statistical analysis was performed using 2-tailed Fisher’s exact test in A and χ2 test in F. P < 0.05 was considered significant.
Figure 5
Figure 5. Meiotic prophase I progression in Hfm1+/+, Hfm1+/–, and Hfm1–/– females.
(A) Meiotic prophase I (MPI) substages identified in the microspread ovarian cells stained with immunofluorescence for a component of the synaptonemal complex (SYCP3), centromere (CREST), DSB (γH2AX), and DNA (DAPI). UCC, unsynapsed condensed chromosomes. (B) Percentages of MPI substages at 17.5 and 18.5 dpc. The total number of oocytes examined is given on the top of each column along with the number of females (in parentheses). ***Significant difference between Hfm1–/– and either Hfm1+/+ or Hfm1+/– females at P < 0.001 by χ2 test. (C) MLH1 foci at the late pachytene stage indicating the crossover sites. Scale bar: 20 μm.
Figure 6
Figure 6. Histological sections of postnatal ovaries from wild-type, Majin–/–, and Hfm1–/– females.
H&E (left) or immunofluorescence staining for MSY2 and FOXL2 with DAPI (right). MSY2 is a marker for oocytes at or beyond the diplotene stage. FOXL2 is a marker for granulosa cells. Blood cells are seen in yellow due to autofluorescence. Scale bar: 500 μm.
Figure 7
Figure 7. In vitro meiotic progression of oocytes from Hfm1+/+ and Hfm1–/– females.
(A) Confocal microscopy images after culture for 19–23 hours. DAPI staining alone is shown beneath each merged image. Hfm1+/+, representative images of the majority of oocytes; Hfm1–/– top, images observed that are closest to those from Hfm1+/+ females; Hfm1–/– bottom, examples of anomalies that were rarely seen in the oocytes from Hfm1+/+ females. Scale bar: 100 μm. (B) Percentage of oocytes in each meiotic stage. DO, spontaneously denuded oocytes before culture. MII* indicates that the spindle resembles MII but no polar body or chromosomes are seen outside the oocyte.
Figure 8
Figure 8. Live imaging of meiotic progression in the oocytes from Hfm1+/+ and Hfm1–/– females.
Staining of DNA (red) and α-tubulin (green) with phase contrast. Left: The oocytes at the end of imaging at a higher magnification. Time-lapse imaging started after 19 hours of IVM. (See also Supplemental Videos 1 and 2.)
Figure 9
Figure 9. Schematic representation of the roles of the 5 meiotic prophase I genes and our hypothesis on the formation of AnCHM.
GV, germinal vesicle; GVBD, germinal vesicle breakdown.

References

    1. Savage PM, et al. The relationship of maternal age to molar pregnancy incidence, risks for chemotherapy and subsequent pregnancy outcome. J Obstet Gynaecol. 2013;33(4):406–411. doi: 10.3109/01443615.2013.771159. - DOI - PubMed
    1. Khawajkie Y, et al. Comprehensive analysis of 204 sporadic hydatidiform moles: revisiting risk factors and their correlations with the molar genotypes. Mod Pathol. 2019;33(5):880–892. doi: 10.1038/s41379-019-0432-4. - DOI - PubMed
    1. Xing D, et al. Refined diagnosis of hydatidiform moles with p57 immunohistochemistry and molecular genotyping: updated analysis of a prospective series of 2217 cases. Mod Pathol. 2021;34(5):961–982. doi: 10.1038/s41379-020-00691-9. - DOI - PubMed
    1. Slim R, et al. Biallelic NLRP7 variants in patients with recurrent hydatidiform mole: a review and expert consensus. Hum Mutat. 2022;43(12):1732–1744. doi: 10.1002/humu.24439. - DOI - PubMed
    1. Li L, et al. A subcortical maternal complex essential for preimplantation mouse embryogenesis. Dev Cell. 2008;15(3):416–425. doi: 10.1016/j.devcel.2008.07.010. - DOI - PMC - PubMed