. 2024 Nov 15;134(22):e176851.
doi: 10.1172/JCI176851.

Lactate reprograms glioblastoma immunity through CBX3-regulated histone lactylation

Affiliations

Lactate reprograms glioblastoma immunity through CBX3-regulated histone lactylation

Shuai Wang et al. J Clin Invest. .

Abstract

Glioblastoma (GBM), an aggressive brain malignancy with a cellular hierarchy dominated by GBM stem cells (GSCs), evades antitumor immunity through mechanisms that remain incompletely understood. Like most cancers, GBMs undergo metabolic reprogramming toward glycolysis to generate lactate. Here, we show that lactate production by patient-derived GSCs and microglia/macrophages induces tumor cell epigenetic reprogramming through histone lactylation, an activating modification that leads to immunosuppressive transcriptional programs and suppression of phagocytosis via transcriptional upregulation of CD47, a "don't eat me" signal, in GBM cells. Leveraging these findings, pharmacologic targeting of lactate production augments efficacy of anti-CD47 therapy. Mechanistically, lactylated histone interacts with the heterochromatin component chromobox protein homolog 3 (CBX3). Although CBX3 does not possess direct lactyltransferase activity, CBX3 binds histone acetyltransferase (HAT) EP300 to induce increased EP300 substrate specificity toward lactyl-CoA and a transcriptional shift toward an immunosuppressive cytokine profile. Targeting CBX3 inhibits tumor growth by both tumor cell-intrinsic mechanisms and increased tumor cell phagocytosis. Collectively, these results suggest that lactate mediates metabolism-induced epigenetic reprogramming in GBM that contributes to CD47-dependent immune evasion, which can be leveraged to augment efficacy of immuno-oncology therapies.

Keywords: Adult stem cells; Brain cancer; Epigenetics; Metabolism; Oncology.


Conflict of interest statement

Conflict of interest: The authors have declared that no conflict of interest exists.

Figures

Figure 1
Figure 1. Histone lactylation levels are elevated in GBM cells.
(A) Western blot of histone lactylation (Kla) and OLIG2 in 3 different NSCs (NSC11, ENSA, and hNP1) and 3 GSCs (GSC23, CW468, and 3565). Histone 3 (H3) and Tubulin were used as loading controls. (B) Immunofluorescence staining of protein lactylation (Pan Kla) in GSC23 and CW468 intracranial tumor xenografts. Human nestin (NES) marks tumor cells. DAPI marks nuclei. The brain-tumor border is demarcated by white dashed lines. Scale bars: 20 μm. (C) Graphic quantification of nuclear histone lactylation staining in B (t tests; n = 5/group). (D) Western blot of histone lactylation (Kla) and OLIG2 in 4 different GSCs (GSC23, 3565, 3028, and CW468) and paired DGCs. Histone 3 and Tubulin were used as loading controls. (E) Immunofluorescence staining of lysine lactylation (Kla) and SOX2 in GSC23 and paired DGC. DAPI was used to mark nuclei. Scale bars: 20 μm. (F) Statistical analysis of nuclear Kla levels in GSC23 and paired DGCs (t tests; n = 30/group). **P < 0.01; ****P < 0.0001.
Figure 2
Figure 2. Elevated lactate promotes lactylation in GBM cells.
(A) Heatmap shows MS analysis of glycolysis-related metabolites in GSC23 and DGC23. Red and blue designate higher and lower levels, respectively. (B) Graphic quantification of lactate levels in GSC23 and DGC23 (t test; n = 6/group). (C) ECAR values of matched GSC23 and DGC23 in Seahorse assays, after sequential injection of 20 mM glucose, 1 μM oligomycin, and 100 mM 2-deoxy-d-glucose (2-DG) (n = 10/group). (D) Quantification of glycolysis, glycolytic capacity, and glycolytic reserve in GSC23 and DGC23 in the Seahorse assay (t test; n = 10/group). (E) Oxygen consumption rate (OCR) values of matched GSC23 and DGC23 in Seahorse assays (n = 10/group). (F) Schematic showing the coculture of GSCs and microglia using Transwell inserts. (G) Western blot of histone lactylation in 3 GSCs (GSC23, CW468, and 3565) cocultured with M0 microglia (HMC3), M1-like microglia induced by LPS, or M2-like microglia induced by either IL-4 (10 ng/ml IL-4, designated as M2–IL-4) or IL-13 (10 ng/ml IL-13, designated as M2–IL-13). Histone 3 was used as loading control. (H and I) Quantification of lactate concentration in the culture medium (H) and intracellularly in GSCs (I). GSC23 tumor cells were cocultured with M0 microglia or microglia induced toward an M2-like state through either IL-4 (M2–IL-4) or IL-13 (M2–IL-13). Coculture with M2 microglia increased both extracellular (n = 3/group; 1-way ANOVA; F[2, 6] = 153.9) and intracellular (n = 3/group; 1-way ANOVA; F[2, 6] = 192.2) lactate. **P < 0.01; ***P < 0.001; ****P < 0.0001.
Figure 3
Figure 3. Histone lactylation regulates phagocytosis of GSCs by microglia in vitro and in vivo.
(A and B) Representative flow cytometry plots of in vitro phagocytosis of GSCs (stained with eFluor670) by microglia (stained with carboxyfluorescein succinimidyl ester [CSFE]) after GSC pretreatment with NaLac (A) or DCA (B) for 24 hours. (C and D) Statistical analysis of phagocytosis assays of microglia against GSCs pretreated with NaLac (C) (n = 3/group; 1-way ANOVA; F[2, 6] = 29.39 for GSC23), (F[2, 6] = 84.10 for CW468) or DCA (D) (n = 3 /group; 1-way ANOVA; F[2, 6] = 31.63 for GSC23, F[2, 6] = 38.02 for CW468). (E) Representative flow cytometry plot of in vitro phagocytosis of GSC23 (stained with eFluor670) by macrophage (stained with CSFE). GSC23 were pretreated with 10 mM NaLac for 24 hours before the phagocytosis assay. (F) Graphic quantification of the assay in E (n = 3/group; t test). (G) Representative flow cytometry plot of macrophage (stained with CSFE) phagocytosis of eFluor670-stained GSC23 pretreated with 10 mM DCA for 24 hours. (H) Graphic quantification of the assay in G (n = 3/group; t test). (I) Representative flow cytometry plots of in vitro phagocytosis of GSC23 by microglia. Microglia were pretreated with vehicle (PBS) or 10 mM NaLac for 24 hours before coculture. GSCs and microglia were stained with eFluor670 and CFSE, respectively. (J) Graphic quantification of GSC23 phagocytosis by microglia in I (n = 3/group; t test). (K) Representative flow cytometry plots of microglial phagocytosis of GSCs. Microglia were pretreated with PBS or DCA for 24 hours before phagocytosis measurements. GSCs and microglia were stained with eFluor670 and CFSE, respectively. (L) Graphic quantification of GSC23 phagocytosis by microglia in K (n = 3/group; t test). **P < 0.01; ***P < 0.001; ****P < 0.0001.
Figure 4
Figure 4. Histone lactylation regulates phagocytosis of GSCs by microglia and macrophages in vivo.
(A) Representative bioluminescent images on days 7 and 21 of mice bearing tumors derived from CW468. Mice were treated with vehicle (PBS), NaLac (1 g/kg/d), DCA (150 mg/kg/d), or DCA (150 mg/kg/d) plus NaLac (1 g/kg/d) from day 7 until the experimental endpoint. (B) Quantification of bioluminescent signals in CW468 tumor-bearing mice at days 7 and 21 (n = 5/group; 2-way ANOVA, F[3, 32] = 17.19). (C) Kaplan-Meier survival curves of tumor-bearing mice implanted with CW468 cells treated with PBS vehicle, NaLac, DCA, or DCA plus NaLac from day 7 (n = 5/group; log-rank tests). (D) Representative flow cytometry plot of in vivo GSC phagocytosis by microglia in CW468 tumor-bearing mice treated with either vehicle (PBS), NaLac, DCA, or DCA plus NaLac. Tumor cells were identified with staining for human CD147. Murine microglia/macrophages were identified with CD11b. (E) Quantification of in vivo phagocytosis in CW468 tumor-bearing mice treated with either vehicle (PBS), NaLac, DCA, or DCA plus NaLac (n = 5/group; 1-way ANOVA; F[3, 8] = 114.4). **P < 0.01; ***P < 0.001; ****P < 0.0001.
Figure 5
Figure 5. Histone lactylation regulates immune evasion pathways in GBM cells.
(A) Western blot of CD47, phosphorylated STAT3 (p-STAT3), STAT3, and Kla protein levels in GSC23 and CW468 treated with different concentrations of NaLac. Histone 3 and Tubulin were used as loading controls. (B) Quantification of effect of NaLac on membrane CD47 expression by flow cytometry (representative data shown in Supplemental Figure 3C) (n = 3/group; 1-way ANOVA; F[2, 6] = 12.36 for GSC23), (F[2, 6] = 8.913 for CW468). (C) Western blot of CD47, p-STAT3, STAT3, and Kla protein levels in GSC23 and CW468 treated with different concentrations of DCA. Histone 3 and Tubulin were used as loading controls. (D) Quantification of effect of DCA on membrane CD47 expression by flow cytometry (representative data shown in Supplemental Figure 3D) (n = 3/group; 1-way ANOVA; F[2, 6] = 54.92 for GSC23), F[2, 6] = 53.89 for CW468). (EG) GSEA analysis shows that lactate stimulation was negatively related to IFN-γ response, IFN-α response, and glycolysis. (H) Representative bioluminescent images on days 7 and 21 of immunocompetent mice implanted with CT2A murine glioma cells. Tumor-bearing mice were treated with either PBS plus IgG (100 μg/mouse), PBS plus anti-CD47-Ab (100 μg/mouse), DCA (150 mg/kg/d) plus IgG (100 μg/mouse), or DCA (150 mg/kg/d) plus anti-CD47-Ab (100 μg/mouse) on days 7 and 14. (I) Quantification of bioluminescent signals in CT2A tumor-bearing mice on days 7 and 21 (n = 5/group; 2-way ANOVA; F[3, 32] = 23.15). (J) Kaplan-Meier survival curves of tumor-bearing mice implanted with CT2A cells treated with vehicle control, vehicle control (PBS) plus IgG, PBS plus anti-CD47-Ab, DCA plus IgG, or DCA plus anti-CD47-Ab (n = 5/group; log-rank tests). *P < 0.05; **P < 0.01; ***P < 0.001; ****P < 0.0001.
Figure 6
Figure 6. CBX3 promotes histone lactylation by increasing catalytic ability of EP300.
(A) Enrichment analysis by Metascape shows gene ontology terms enriched among lactylated proteins. (B) Top 10 proteins IP with an antibody against lactylated lysine (Kla). (C) Co-IP analysis of Kla and CBX3 in GSC23 and CW468 cells with either an IgG control or anti-CBX3 antibody. (D) Immunofluorescence staining of CBX3, EP300, and Kla in GSC23 and CW468. DAPI marks nuclei. Scale bars: 10 μm. (E) Western blot shows that His-CBX3 protein increases the lactyl-transferase of EP300. CBX3 has no effect on the acetyl-transferase function of EP300. (F) Western blot shows the levels of histone lactylation in GSC23 and CW468 cells transduced with either shCONT, shCBX3.295, or shCBX3.370. Histone 3 and Tubulin were used as loading controls.
Figure 7
Figure 7. CBX3 knockdown in GBM cells regulates their phagocytosis by microglia.
(A) 2D confocal microscopy images and their 3D reconstructions demonstrate effects of either shCONT or shCBX3 on phagocytosis of eFluor670-stained GBM cells (red) by CSFE-stained HMC3 microglia (green) in vitro. (B) Quantification of GBM cell phagocytosis by microglia in A (n = 3/group; 1-way ANOVA; F[2, 6] = 51.45 for GSC23, F[2, 6] = 12.17 for CW468). (C) Correlation between CD47 and CBX3 expression in TCGA and Chinese Glioma Genome Atlas (CGGA) databases. Data (normalized count value) were downloaded from GlioVis. (D) Correlation between immune score and CBX3 expression in TCGA and CGGA databases. (E) Western blots of the protein levels of CBX3 and CD47 in GSC23 and CW468 cells transduced with either shCONT or shCBX3. Tubulin was used as loading control. (F) Representative Western blot of protein levels of CD47, CBX3, and histone lactylation in CW468 transduced with either a control shRNA sequence (shCONT) or shCBX3.370, then treated with either vehicle control or 10 mM NaLac for 24 hours. Histone 3 and Tubulin were used as loading controls. (G) Representative flow cytometry plots of eFluor670-stained CW468 cell phagocytosis by microglia (HMC3) stained with CSFE. Cell treatment conditions are the same as in F. (H) Quantification of relative phagocytosis rates in G (n = 3/group; 1-way ANOVA; F[3, 8] = 65.12). *P < 0.05; **P < 0.01; ****P < 0.0001.
Figure 8
Figure 8. CBX3 regulates immune-regulated pathways by histone lactylation.
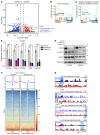
(A) Volcano plot shows the differential gene expression in GSC23 and CW468 cells transduced with either shCONT or shCBX3. The top 10 downregulated and upregulated genes ranked by P value are labeled. (B and C) GSEA analysis shows that CBX3 knockdown was negatively related to stem cell division and negative regulation of myeloid leukocyte–mediated immunity. (D) qRT-PCR analysis of PTPRS, CSPG4, SPRED1, CD59 and PROCR in CW468 transduced with either shCONT or shCBX3. ACTB (encoding β-actin) was used as internal control (n = 3/group; 1-way ANOVAs; F[2, 6] = 31.05 for PTPRS, F[2, 6] = 152.1 for CSPG4, F[2, 6] = 21.88 for SPRED1, F[2, 6] = 165.7 for CD59), F[2, 6] = 27.60 for PROCR). (E) Western blot shows the protein levels of CBX3, p-STAT3, and STAT3 in GSC23 and CW468 cells transduced with either shCONT or shCBX3. Tubulin was used as loading control. (F) ChIP-Seq density heatmaps in GSC23 transduced with either shCONT or shCBX3, ranked by Kla read intensity, within ±4 kb of TSSs. (G) ChIP-Seq tracks showing Kla peaks in the promoter regions of IL6, ARG1, CD47, and IFNG.
Figure 9
Figure 9. CBX3 knockdown increases phagocytosis in vivo and prolongs survival of tumor-bearing mice.
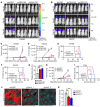
(A and B) Representative bioluminescent images of mice intracranially implanted with CW468 (A) or GSC23 (B) cells transduced with either shCONT, shCBX3.295, or shCBX3.370 lentiviruses, on days 10, 20, and 24 after tumor cell implantation. (C and D) Quantification of bioluminescent signals in CW468 (C) or GSC23 (D) tumor-bearing mice at days 10, 20, and 24 (n = 5/group; 2-way ANOVA; F[4, 24] = 6.854 in C, F[4, 24] = 16.03 in D). (E and F) Kaplan-Meier survival curves of tumor-bearing mice implanted with CW468 (E) or GSC23 (F) cells transduced with either shCONT, shCBX3.295, or shCBX3.370 viruses (n = 5/group; log-rank tests). (G) Quantification of flow cytometric analysis of in vivo phagocytosis of CD147-positive GSCs by CD11b-positive microglia in NSG tumor-bearing mice (representative data shown in Supplemental Figure 7C) (n = 3/group; 1-way ANOVA; F[2, 6] = 83.44). (H) Quantification analysis of bioluminescent signals in CT2A tumor-bearing mice on days 7, 14, and 21 after tumor cell implantation (n = 5/group; 2-way ANOVA; F[4, 24] = 9.116). (I) Kaplan-Meier survival curves of tumor-bearing mice implanted with CT2A cells transduced with control virus or murine Cbx3 knockdown (shCBX3_1 or shCbx3_2) virus (n = 5/group; log-rank tests). (J) Representative immunofluorescence staining images for IL-10 in CT2A allografts transduced with either control shCONT or 1 of 2 nonoverlapping shRNAs targeting mouse Cbx3 (shCBX3_1 or shCbx3_2). DAPI marks nuclei. Scale bars: 10 μm. (K) Graphic quantification of IL-10 immunofluorescence intensity (n = 3/group; 1-way ANOVA; F[2, 6] = 20.71). **P < 0.01; ***P < 0.001; ****P < 0.0001.
Figure 10
Figure 10. Depletion of microglia by PLX5622 compromises the inhibitory effects of Cbx3 knockdown on tumor growth in vivo.
(A) Immunofluorescence imaging of CD11b microglia in murine brains following treatment with vehicle (sterilized water) or PLX5622 (50 μg/g daily) for 2 weeks. DAPI marks nuclei. Scale bar: 20 μm. (B) Statistical analysis of number of CD11b-positive cells (no.) per field of view (FOV) in mice treated with PLX5622 or control vehicle (n = 3/group; t test). (C) Representative in vivo bioluminescence images of CT2A intracranial tumors in C57BL6J mice pretreated with either vehicle or PLX5622. Images were obtained on days 7 and 21 after tumor cell implantation. CT2A cells were transduced with shCONT or shCbx3_1 before implantation. (D) Graphic quantification of bioluminescent signals of CT2A tumors transduced with shCONT or shCbx3_1 lentivirus. Mice were pretreated with vehicle (sterilized water) or PLX5622 (50 μg/g daily) for 2 weeks prior to intracranial tumor implantation (n = 5/group; 2-way ANOVAs; F(3, 16) = 18.36 on day 21). (E) Kaplan-Meier survival curves of C57BL6J mice bearing CT2A intracranial allografts. Mice were pretreated with either vehicle or PLX5622 for 2 weeks prior to tumor implantation. CT2A cells were transduced with either shCONT or shCbx3_1 (n = 5/group; log-rank tests). *P < 0.05; **P < 0.01; ***P < 0.001; ****P < 0.0001.

References

    1. Stupp R, et al. Radiotherapy plus concomitant and adjuvant temozolomide for glioblastoma. N Engl J Med. 2005;352(10):987–996. doi: 10.1056/NEJMoa043330. - DOI - PubMed
    1. Bao S, et al. Glioma stem cells promote radioresistance by preferential activation of the DNA damage response. Nature. 2006;444(7120):756–760. doi: 10.1038/nature05236. - DOI - PubMed
    1. Wakimoto H, et al. Human glioblastoma-derived cancer stem cells: establishment of invasive glioma models and treatment with oncolytic herpes simplex virus vectors. Cancer Res. 2009;69(8):3472–3481. doi: 10.1158/0008-5472.CAN-08-3886. - DOI - PMC - PubMed
    1. Singh SK, et al. Identification of human brain tumour initiating cells. Nature. 2004;432(7015):396–401. doi: 10.1038/nature03128. - DOI - PubMed
    1. Hubert CG, et al. A three-dimensional organoid culture system derived from human glioblastomas recapitulates the hypoxic gradients and cancer stem cell heterogeneity of tumors found in vivo. Cancer Res. 2016;76(8):2465–2477. doi: 10.1158/0008-5472.CAN-15-2402. - DOI - PMC - PubMed

MeSH terms