. 2024 Sep 17;134(22):e180738.
doi: 10.1172/JCI180738.

CXCL8 secreted by immature granulocytes inhibits WT hematopoiesis in chronic myelomonocytic leukemia

Affiliations

CXCL8 secreted by immature granulocytes inhibits WT hematopoiesis in chronic myelomonocytic leukemia

Paul Deschamps et al. J Clin Invest. .

Abstract

Chronic myelomonocytic leukemia (CMML) is a severe myeloid malignancy with limited therapeutic options. Single-cell analysis of clonal architecture demonstrates early clonal dominance with few residual WT hematopoietic stem cells. Circulating myeloid cells of the leukemic clone and the cytokines they produce generate a deleterious inflammatory climate. Our hypothesis is that therapeutic control of the inflammatory component in CMML could contribute to stepping down disease progression. The present study explored the contribution of immature granulocytes (iGRANs) to CMML progression. iGRANs were detected and quantified in the peripheral blood of patients by spectral and conventional flow cytometry. Their accumulation was a potent and independent poor prognostic factor. These cells belong to the leukemic clone and behaved as myeloid-derived suppressor cells. Bulk and single-cell RNA-Seq revealed a proinflammatory status of iGRAN that secreted multiple cytokines of which CXCL8 was at the highest level. This cytokine inhibited the proliferation of WT but not CMML hematopoietic stem and progenitor cells (HSPCs) in which CXCL8 receptors were downregulated. CXCL8 receptor inhibitors and CXCL8 blockade restored WT HSPC proliferation, suggesting that relieving CXCL8 selective pressure on WT HSPCs is a potential strategy to slow CMML progression and restore some healthy hematopoiesis.

Keywords: Cytokines; Hematology; Leukemias; Neutrophils.


Conflict of interest statement

Conflict of interest: The authors have declared that no conflict of interest exists.

Figures

Figure 1
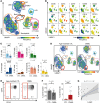
Figure 1. Spectral flow analysis identifies iGRANs in CMML PB.
(A) Nonsupervised UMAP of spectral flow cytometry analysis of PB cells collected from 27 CMML patients and 10 age-matched control donors. cMO, classical monocytes; iMO, intermediate monocytes; ncMO, nonclassical monocytes; LYB, B lymphocytes; LYT, T lymphocytes. (B) Cell-surface expression of indicated markers on the UMAP shown in A. (C) Fraction of B, CD4+ T, CD8+ T, monocytes, DCs, neutrophils and NK cells among total CD45+ cells in age-matched controls (CTL) and CMML patients. Mann-Whitney U test. (D) Nonsupervised UMAP analysis of spectral flow cytometry data in the 10 controls compared with 27 CMML patients (60,000 cells for each condition). (E) Partition of neutrophil subsets based on CD15 and CD16 expression in each group. (F) Percentage of CD15+,CD16 and CD15+,CD16+ neutrophils as separated in E, among CD45+ cells. Mann-Whitney U test. (G) Spearman’s correlation between CD15+CD16 and IMC fractions in CMML PB. Adjusted P values are indicated above the graphs. *P < 0.05; **P < 0.01; ***P < 0.001; ****P < 0.0001.
Figure 2
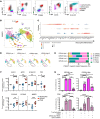
Figure 2. Elevated iGRAN fraction in the PB of CMML patients is a poor prognostic factor.
(A) iGRAN fraction in CD11b+CD33+ population as measured by conventional flow cytometry in the PB of young controls (n = 71), age-matched controls (n = 64), and CMML patients (n = 209). Kruskal-Wallis test. (B) iGRAN absolute number (×109/L) was measured in the PB of CMML patients compared with age-matched controls. Mann-Whitney U test. (C) iGRAN fraction in MD-CMML and MP-CMML subtypes according to the WHO classification. Mann-Whitney U test. (D) Spearman’s correlation between iGRAN fraction and IMC fraction, WBC count, hemoglobin level, and lymphocyte fraction in the PB of CMML patients. (E) iGRAN fraction in CMML patients grouped according to the number of mutations detected in a panel of 25 genes. Kruskal-Wallis nonparametric test. (F) iGRAN fraction in CMML patients grouped according to the mutational status of each indicated gene: WT or mutated (Mut). Splice: SRSF2+ZRSR2+U2AF1+SF3B1. Mann-Whitney U test. (G) iGRAN fraction in CMML patients grouped according to GFM, CPSS, and CPSS-M prognostic scores. Kruskal-Wallis test. (H and I) EFS (defined as time between diagnosis and AML transformation, death, or last follow-up) (H) and OS (time between diagnosis and death) (I) of CMML patients with high (≥14%, n = 66, in red) or low (<14%, n = 88, in blue) iGRAN fraction; log-rank test. *P < 0.05; **P < 0.01; ***P < 0.001; ****P < 0.0001.
Figure 3
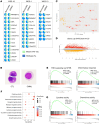
Figure 3. iGRANs demonstrate features of myeloid-derived suppressive cells.
(A) Representative conventional flow plots showing cell-surface expression of indicated markers among low-density peripheral blood cells (PBMC), separating iGRANs from monocytes, residual PMN, and lymphocytes, according to the gating strategy shown in Supplemental Figure 2. (B) Single-cell analysis of PBMCs collected from 2 CMML patients with a fraction of 14% or more and 2 with a lower iGRAN fraction; unsupervised clustering of pooled data separating 15 cluster groups in indicated cell categories. Ery, erythroid cells; My, myeloid cells; MK, megakaryocytes; Gran, granulocytes. (C) Dot plot showing the average expression (color scaled) of selected granulocyte genes and the percentage of cells that expressed those genes in indicated granulocytic clusters. (D) UMAP representation of each patient sample, 2 iGRAN-low (<14%) and 2 iGRAN-high (≥14%) CMML patients. (E) Fraction of each cell type in ITGAM+ clusters corresponding to CD11b+CD33+ cells per CMML patient. Colors are cluster codes defined in B. (F) Expression of indicated genes in enriched fraction of iGRANs, monocytes, and neutrophils measured by RT-qPCR and normalized to RPL32, GUS, and GAPDH housekeeping genes (n = 8 CMML patients). Kruskal-Wallis test. (G) Suppressive activity of iGRANs on T cell proliferation. iGRAN-low (<14%, n = 6, left panels) and iGRAN-high (≥14%, n = 6, right panels) PBMCs were labeled with Cell Trace Violet before activating T cells with anti-CD3 and anti-CD28 antibodies; CD4 (upper panels) and CD8 (lower panels) T cell proliferation was measured at day 4 by flow cytometry. We used PBMCs without any manipulation, PBMCs in which iGRAN have been depleted (iGRAN-dep PBMC), and iGRAN-dep PBMCs with addition of 10% sorted iGRANs. T cell proliferation (%) is relative to the highest proliferation, observed with iGRAN-dep PBMCs. One-way ANOVA, Tukey’s multiple comparison. *P < 0.05; **P < 0.01; ***P < 0.001; ****P < 0.0001.
Figure 4
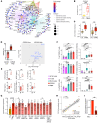
Figure 4. iGRANs are clonal, proinflammatory granulocytes.
(A) VAF of indicated somatic variants detected by whole exome sequencing of sorted monocytes (left) and iGRANs (right) in 3 CMML patients (WES numbers: 16, 4, 10). (B) May-Grünwald-Giemsa staining of iGRAN sorted from a control donor (CTL) and a CMML patient sample. Original magnification, ×1,000. (CG) Bulk RNA-Seq of sorted iGRANs collected from 7 healthy donors (CTRL) and 10 CMML patients; PCA of regularized logarithm (rlog) transformed data based on the top 500 varying genes using plotPCA function of the DESeq2 package (C). MA plot of differentially expressed genes between iGRANs collected from control and CMML patients (D). GSEA of indicated hallmark pathways enriched in CMML versus control (E). Top10 nominal enrichment score of pathways involving upregulated genes in CMML versus control cells according to GO molecular function (F). GSEA of indicated hallmark pathways enriched in CMML versus control (G). Adjusted P and q values are indicated on the graphs.
Figure 5
Figure 5. CXCL8 is one of the main cytokines released by CMML patient iGRANs.
(A and B) Bulk RNA-Seq of sorted iGRAN collected from healthy donors (CTL) and CMML patients. Gene-concept network representation of enriched genes of 4 pathways (chemokine activity, chemokine receptor binding, cytokine activity, cytokine receptor binding). Dot color, log2foldchange. Size of beige central dots, number of core enriched genes (A). CXCL8 mRNA expression (normalized counts) in control cells (n = 7) and CMML iGRAN (n =10) (B). Mann-Whitney U test. (C) CXCL8 mRNA expression assessed by RT-qPCR in healthy donor and CMML; left panels, samples used for RNA-Seq; right panel, independent cohort of iGRANs collected from 17 control and 18 CMML. Ct values normalized to GAPDH, RPL32, and GUS genes. Mann-Whitney U test. (D) Volcano plot of cytokine and chemokine levels (n = 44) measured in circulating plasma of 23 iGRAN-low compared with 26 iGRAN-high CMML (threshold ≥14%, iGRAN fraction in box plot for each group on the left panel). (E) Indicated proteins were quantified in the supernatant of iGRANs (S), using culture medium (M) as a control. Mann-Whitney U test. (F) Intracellular cytokine production by B/NK cells, T cells, monocytes, iGRAN, and neutrophils (PMN) in fresh PB samples collected from CMML patients. Left panels, fraction of cells expressing the studied cytokine; right panels, median fluorescence intensity for CXCL8 (n = 12), IL-16 (n = 12), or MCP2 (n = 9) in cells expressing the cytokine. One-way ANOVA, Tukey’s multiple comparison. (G) CXCL8 mRNA expression (RT-qPCR) in iGRAN of 17 healthy donors and 32 CMML, according to WT and mutated (Mut) status of indicated genes. Mann-Whitney U test. (H) Spearman’s correlation between CXCL8 normalized expression and gene set variation analysis (GSVA) score for the hallmark “TNFA_SIGNALING_VIA_NFKB”. Each dot represents iGRAN sample from TET2-mutated patients (n = 8), TET2-WT patients (n = 2), and controls (n = 7). (I) CXCL8 mRNA expression after 24 hours of iGRAN culture with 0.5 μM Bay 11-7082, normalized to RPL32, HPRT, and PPIA genes. Fold change compared with DMSO-treated iGRANs. Paired t test. *P < 0.05; **P < 0.01; ***P < 0.001; ****P < 0.0001.
Figure 6
Figure 6. CXCL8 specifically inhibits the growth of WT CD34+ cells.
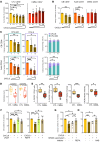
(A) Cell output of CMML CD34+ cells in liquid culture for 3 days in the presence of indicated doses of CXCL8 (ng/ml); ratio to untreated samples. Data are represented as means ± SD. n = 5 per group. One-way ANOVA, Dunnett’s multiple comparison. (B) Total colony output of CD34+ cells cultured in methylcellulose in the presence of indicated doses of CXCL8 (ng/ml) for 14 days. CB, cord blood (n = 6). Adult, healthy donor bone marrow CD34+ cells (n = 5) or CMML samples (n = 7); ratio to untreated samples. Data are represented as means ± SD. One-way ANOVA, Dunnett’s multiple comparison. (C) Cord blood (n = 6 upper panels) and healthy donor bone marrow (n = 5 lower panels) CD34+ cells were cultured in methylcellulose for 14 days to generate CFU-GM (left panel) and CFU-E (middle panel) colonies in the absence or presence of indicated concentrations of CXCL8. Output of treated relative to untreated cells. Right panel, fractions of CFU-GM and CFU-E were represented together. Data are represented as means ± SD. One-way ANOVA, Dunnett’s multiple comparison. (D) CXCR1 and CXCR2 mRNA expression assessed by RNA-Seq of CD34+ cells sorted from healthy donors (n = 7) and CMML patient (n = 12) bone marrow. Mann-Whitney U test. (E) Flow cytometry analysis of CXCR1 and CXCR2 at the surface of healthy donor (CTL, n = 5) and CMML patient (n = 18) CD34+ cells. Left panels, fraction of cells expressing the studied receptors; right panels, within positive cells, mean fluorescence intensity of each receptor. Mann-Whitney U test. (F) Cell output of healthy donor CD34+ in liquid culture in the absence or presence of 10 ng/mL CXCL8, 10 μM ladarixin (LADA), or 10 μM reparixin (REPA). Data are represented as means ± SD. n = 8. One-way ANOVA, Tukey’s multiple comparison. (G) Total colony output of healthy donor CD34+ cultured in methylcellulose in the absence or presence of CXCL8 (10 ng/mL), iGRAN supernatant, or reparixin (10 μM); ratio related to untreated samples. n = 6. Data are represented as means ± SD. One-way ANOVA, Tukey’s multiple comparison. (H) The same experiment was performed by using a CXCL8 neutralizing antibody (NAB, 5 μg/mL). n = 5. Data are represented as means ± SD. One-way ANOVA, Tukey’s multiple comparison.*P < 0.05; **P < 0.01; ***P < 0.001.

References

    1. Solary E, Itzykson R. How I treat chronic myelomonocytic leukemia. Blood. 2017;130(2):126–136. doi: 10.1182/blood-2017-04-736421. - DOI - PubMed
    1. Khoury JD, et al. The 5th edition of the World Health Organization classification of haematolymphoid tumours: myeloid and histiocytic/dendritic neoplasms. Leukemia. 2022;36(7):1703–1719. doi: 10.1038/s41375-022-01613-1. - DOI - PMC - PubMed
    1. Merlevede J, et al. Mutation allele burden remains unchanged in chronic myelomonocytic leukaemia responding to hypomethylating agents. Nat Commun. 2016;7:10767. doi: 10.1038/ncomms10767. - DOI - PMC - PubMed
    1. Cervera N, et al. Gene mutations differently impact the prognosis of the myelodysplastic and myeloproliferative classes of chronic myelomonocytic leukemia. Am J Hematol. 2014;89(6):604–609. doi: 10.1002/ajh.23702. - DOI - PubMed
    1. Guru Murthy GS, et al. Incidence and survival outcomes of chronic myelomonocytic leukemia in the United States. Leuk Lymphoma. 2017;58(7):1648–1654. doi: 10.1080/10428194.2016.1258700. - DOI - PubMed

MeSH terms