. 2024 Nov 15;134(22):e183366.
doi: 10.1172/JCI183366.

Insulin-like growth factor 2 drives fibroblast-mediated tumor immunoevasion and confers resistance to immunotherapy

Affiliations

Insulin-like growth factor 2 drives fibroblast-mediated tumor immunoevasion and confers resistance to immunotherapy

Daqiang Song et al. J Clin Invest. .

Abstract

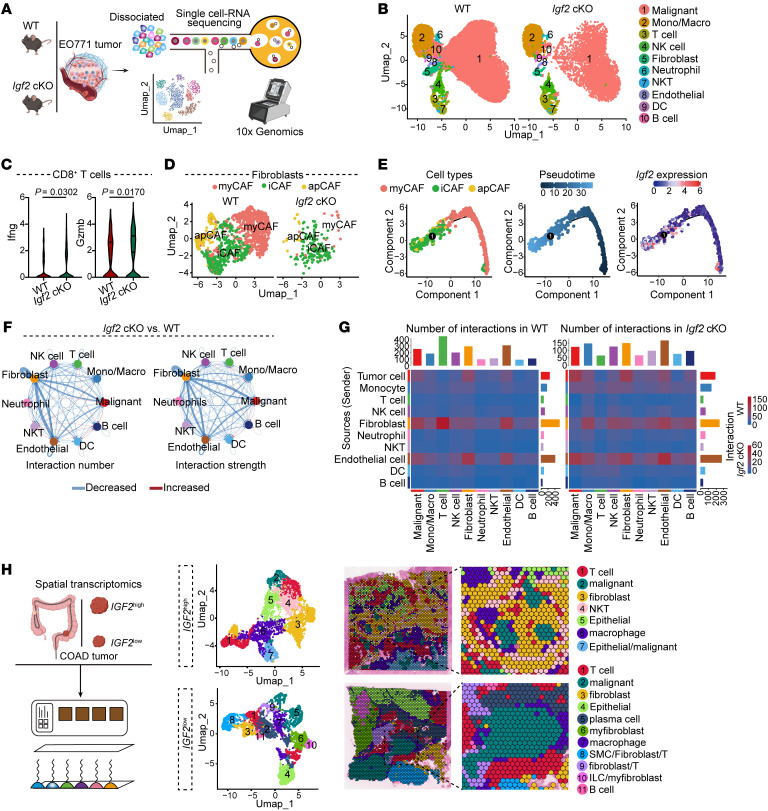
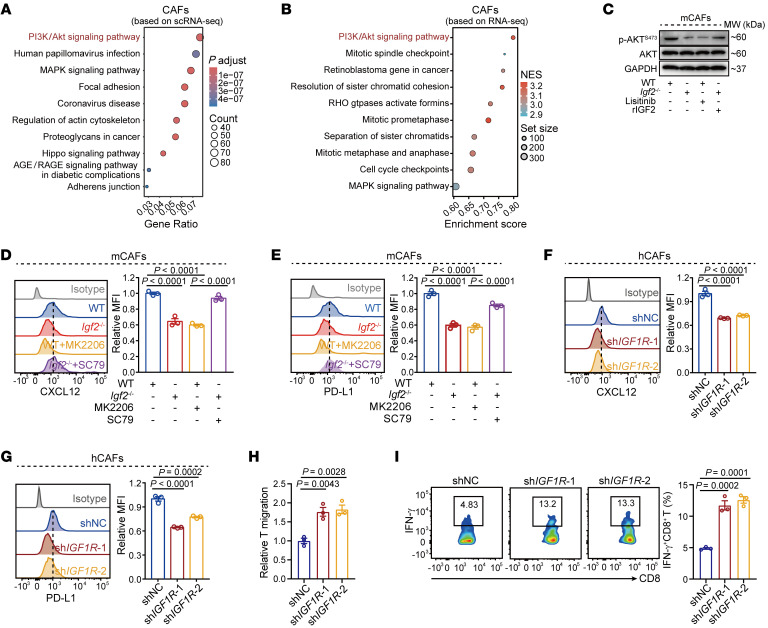
T cell exclusion is crucial in enabling tumor immune evasion and immunotherapy resistance. However, the key genes driving this process remain unclear. We uncovered a notable increase of insulin-like growth factor 2 (IGF2) in immune-excluded tumors, predominantly secreted by cancer-associated fibroblasts (CAFs). Using mice with systemic or fibroblast-specific deletion of IGF2, we demonstrated that IGF2 deficiency enhanced the infiltration and cytotoxic activity of CD8+ T cells, leading to a reduction in tumor burden. Integration of spatial and single-cell transcriptomics revealed that IGF2 promoted interaction between CAFs and T cells via CXCL12 and programmed death ligand 1 (PD-L1). Mechanistically, autocrine IGF2 activated PI3K/AKT signaling by binding to the IGF1 receptor (IGF1R) on CAFs, which was required for the immunosuppressive functions of CAFs. Furthermore, genetic ablation of IGF2 or targeted inhibition of the IGF2/IGF1R axis with the inhibitor linsitinib markedly boosted the response to immune checkpoint blockade. Clinically, elevated levels of IGF2 in tumors or plasma correlated with an adverse prognosis and reduced efficacy of anti-programmed death 1 treatment. Together, these results highlight the pivotal role of IGF2 in promoting CAF-mediated immunoevasion, indicating its potential as a biomarker and therapeutic target in immunotherapy.

Keywords: Cancer immunotherapy; Oncology.


Figures

Figure 1
Figure 1. IGF2 correlates with T cell exclusion and is highly expressed in CAFs.
(A) Experimental schematics of analysis of RNA-Seq. The schematic in A was created with BioRender.com (agreement no. WO27B3A3JY). (B) Rank of differential genes and shared genes from human TNBC and COAD. The tumor samples were categorized into immune-inflamed and immune-excluded groups according to CD3 staining. (C) Scatter plot of 9-quadrant association analyses of mRNA levels from log2 FC in both TCGA TNBC and our TNBC cohorts. (D) Plasma IGF2 levels from patients with TNBC with immune-inflamed (n = 20) or immune-excluded tumors (n = 30). (E) Enrichment score of stromal cells in the TME of human TNBC and COAD based on IGF2 expression. (F) The uniform manifold approximation and projection (UMAP) plot illustrating the distribution of cell clusters within the BRCA (GSE114727) TME based on high or low IGF2 expression. Different cell clusters are represented by distinct colors in the plot. (G) Expression levels of Igf2 in the cell clusters in the TME of mammary EO771 tumors based on scRNA-Seq analysis. (H) scRNA-Seq analysis presenting the expression of IGF2 in the cell clusters in the TME of BRCA (GEO GSE176078). PVL, perivascular-like cells. (I) Violin plot showing IGF2 expression in the cell clusters within the immune-inflamed and immune-excluded BRCA (GSE114727) or COAD (GSE179784) tumors. (J) Flow cytometric analysis showing IGF2 expression in the CAFs, CD45+ immune cells, and malignant cells in the TME of TNBC or COAD tumors (n = 5). (K) Representative immunofluorescence microscopy images for α–smooth muscle actin (α-SMA) (green) and IGF2 (red) in human COAD tissues. Scale bars: 50 μm. Data indicate the mean ± SEM (D, E, and J). Significance was determined by 2-tailed, unpaired Student’s t test (D and I), 2-way ANOVA (E), and 1-way ANOVA (J). Pearson’s correlation coefficient was calculated for C. Mono, monocytes; Macro, macrophages.
Figure 2
Figure 2. IGF2 deficiency significantly enhances T cell antitumor immunity.
(AD) Number of infiltrating CD8+ T cells, tumor growth, and tumor weight in EO771 tumors (A and C) or MC38 tumors (B and D) from WT, Igf2–/–, or Igf2-cKO mice (n = 5 mice per group). (E) Growth of MC38 tumors with the indicated treatment. CD8+ T cells were depleted by an anti-CD8α antibody (10 mg/kg) (n = 6–7 mice per group). (F and G) Percentage of IFN-γ+ or TNF-α+ CD8+ T cells in EO771 (F) or MC38 (G) tumors from WT or Igf2-cKO mice (n = 5 mice per group). (H) Plot of t-distributed stochastic neighbor embedding (tSNE) of tumor-infiltrating leukocytes overlaid with color-coded clusters (left) and the percentage of cell clusters (right) in EO771 tumors from WT or Igf2-cKO mice. NKT, NK T cell; M-MDSC, monocytic myeloid-derived suppressor cell; M0 Mφ, M0-like macrophage; M1 Mφ, M1-like macrophage; M2 Mφ, M2-like macrophage; B, B cell. Data are presented as the mean ± SEM (AH). P values were determined by 2-way ANOVA (AH), 2-tailed, unpaired Student’s t test (AC), and 1-way ANOVA (D).
Figure 3
Figure 3. scRNA-Seq and stRNA-Seq analyses reveal the interaction between IGF2-educated CAFs and T cells.
(A) Experimental schematics of scRNA-Seq of EO771 tumors from WT or Igf2-cKO mice (n = 3 mice per group). (B) Cell clusters identified and visualized with distinct color schemes in EO771 tumors based on scRNA-Seq analysis. (C) Expression levels of Ifng and Gzmb on the CD8+ T cell cluster from EO771 tumors based on scRNA-Seq analysis. (D) Fibroblast clusters identified and visualized with distinct color schemes in EO771 tumors based on scRNA-Seq analysis. (E) Trajectory analysis of 3 fibroblast types. Cell types were assigned different colors and arranged by pseudotime (left). Blue colors were based on pseudotime (middle). The change in Igf2 expression in the cell types was based on pseudotime (right). (F and G) scRNA-Seq analysis showing the interaction among cell clusters in the TME of EO771 tumors from WT or Igf2-cKO mice (n = 3 mice per group). (H) Experimental schematics of stRNA-Seq analysis and unbiased clustering of spatial spots and definition of cell types in the COAD tissues. Some image parts in A and the process diagram in H were created with BioRender.com (agreement no. WO27B3A3JY). (A and H). Data are presented as the mean ± SEM. P values were determined by 2-tailed, unpaired Student’s t test (C).
Figure 4
Figure 4. IGF2 facilitates the interaction between CAFs and T cells through CXCL12 and PD-L1 signaling.
(A) Heatmap showing the transcripts of differentially expressed genes in WT and Igf2–/– CAFs (n = 5). (B) Volcano plot showing the expression of differentially expressed genes and violin plot representing the expression of Cxcl12 and Cd274 in a fibroblast cluster from EO771 tumors from WT or Igf2-cKO mice (n = 3 mice per group). (C) Expression changes of Cxcl12 and CD274 in the fibroblast subpopulations from EO771 tumors based on pseudotime analysis. (D) Network presenting CXCL signaling among cell clusters in EO771 tumors from WT or Igf2-cKO mice (n = 3 mice per group). The line thickness denotes the strength of the interactions. (E) stRNA-Seq analysis showing the CXCL signaling among cell clusters in the IGF2hi or IGF2lo COAD tissues. The line thickness denotes the strength of the interactions. SMC, smooth muscle cell. (F) Ligand-receptor interaction of CXCL12 with its receptors CXCR4 and ACKR3 in the indicated cell clusters in EO771 tumors from WT or Igf2-cKO mice (n = 3 mice per group). Commun., communication; Prob., probability; max, maximum; min, minimum. (G) Levels of serum CXCL12 in EO771 or MC38 tumor–bearing WT or Igf2-cKO mice were determined by ELISA (n = 5 mice per group). (H) PD-L1 expression on CAFs from EO771 or MC38 tumors was detected by flow cytometry (n = 5 mice per group). (I and J) Expression of CXCL12 (I) and PD-L1 (J) in the WT or Igf2–/– CAFs with or without linsitinib treatment (5 μM) or murine rIGF2 protein (10 μM) was detected by flow cytometry (n = 3). (K) Migration ratio of T cells cocultured with WT or Igf2–/– CAFs treated with anti-IgG or anti-CXCL12 neutralizing antibody (2 ng/mL). (L) Percentage of IFN-γ+ or TNF-α+ CD8+ T cells cocultured with WT or Igf2–/– CAFs treated with anti-IgG or anti–PD-L1 neutralizing antibody (0.2 μg/mL). Data are presented as the mean ± SEM (B and GL). P values were determined by 2-tailed, unpaired Student’s t test (B, G and H), 1-way ANOVA (I and J), or 2-way ANOVA (K and L).
Figure 5
Figure 5. Deficiency of IGF2 significantly reduces the expression levels of CXCL12 and PD-L1 through the inactivation of Akt signaling in CAFs.
(A) KEGG analysis of scRNA-Seq data showing the enriched signaling pathways in the fibroblasts from EO771 tumors of WT mice in comparison with those of Igf2-cKO mice (n = 3 mice per group). P adjust, adjusted P value. (B) KEGG analysis of RNA-Seq showing the enriched signaling pathways in WT CAFs compared with Igf2–/– CAFs. NES, normalized enrichment score. (C) Activation of the Akt pathway in WT or Igf2–/– CAFs treated with linsitinib (5 μM) or mouse rIGF2 protein (10 μM) was detected by Western blotting. (D and E) Expression levels of CXCL12 (D) and PD-L1 (E) on WT or Igf2–/– CAFs treated with MK2206 (10 μM) or SC79 (10 μM) were determined by flow cytometry (n = 3). (F and G) Expression levels of CXCL12 (F) and PD-L1 (G) on the negative control (shNC) or shIGF1R human CAFs were determined by flow cytometry (n = 3). (H) Migration changes of CD8+ T cells cocultured with shNC or shIGF1R human CAFs (n = 3). (I) The percentage of IFN-γ+ CD8+ T cells cocultured with shNC or shIGF1R human CAFs was determined by flow cytometry (n = 3). Data are presented as the mean ± SEM (DI). P values were determined by hypergeometric test (A) and 1-way ANOVA (DI).
Figure 6
Figure 6. IGF2 blockade synergistically enhances the therapeutic efficacy of ICB.
(A) IGF2 expression in the indicated cell clusters based on scRNA-Seq analysis of melanoma data (GSE115978) from the GEO database. (B) IGF2 expression in pretreatment tumors from patients with melanoma who had different treatment responses to anti–PD-1 (GSE115978). TPM, transcripts per million. (C) OS of patients with melanoma who received anti–PD-1 treatment (GSE115978) based on IGF2 expression in pretreatment tumors. (DG) Tumor growth (D), mouse survival (E), percentage of CD8+ T cells (F), and percentage of IFN-γ+ or TNF-α+ CD8+ T cells (G) in EO771 tumors from WT or Igf2-cKO mice treated with anti-IgG or anti–PD-1 (10 mg/kg) (n = 5 mice per group). (HJ) Tumor growth and mouse survival (H), serum CXCL12 levels and expression of PD-L1 on CAFs (I), and percentage of CD8+ T cell abundance and IFN-γ+ and TNF-α+ CD8+ T cells (J) in MC38 tumor–bearing WT mice after treated with linsitinib (10 mg/kg), anti–CTLA-4 (5 mg/kg), or their combination in WT mice (n = 5 mice per group). (K) Growth of MC38 tumors in WT or iDTRfl/fl S100a4CreERT mice treated with vehicle or linsitinib (10 mg/kg) (n = 5 mice per group). Data are presented as the mean ± SEM (B, F, G, and HJ). P values were determined by 2-tailed, unpaired Student’s t test (I), 1-way ANOVA (B, F, G, and J), 2-way ANOVA (A, D, H, and K), or log-rank test (C, E, and H). Veh., vehicle.
Figure 7
Figure 7. High levels of IGF2 are positively correlated with an unfavorable prognosis and resistance to immunotherapy in patients with cancer.
(A) Analysis of collagen deposition by Picrosirius red staining in IGF2hi (n = 35) and IGF2lo (n = 30) human TNBC tissues. Scale bars: 200 μm. (B) IHC staining of CXCL12 in IGF2hi (n = 70) and IGF2lo (n = 67) human TNBC tumor tissues. Scale bars: 50 μm. Original magnification (insets), ×2 (A) and ×2.5 (B). (C) OS of patients with cancer with distinct infiltration levels of IGF2+ CAFs in TCGA cohort. (D) OS of patients with TNBC based on plasma IGF2 levels. (E) Plasma IGF2 levels in pretreatment blood collected from cancer patient groups with different responses to anti–PD-1 treatment. CR, 100% remission; PR, ≥30% remission; SD, <30% remission to <20% increase of tumor size; PD, ≥20% increase. (F) Waterfall plot depicting the responses to anti–PD-1 treatment in cancer patients with low levels (<30 ng/mL), medium levels (30–100 ng/mL), and high levels (>100 ng/mL) of plasma IGF2. (G) Assessment of the ORR and DCR among cancer patients with different plasma IGF2 levels (Fisher’s exact test). Data are presented as the mean ± SEM (A, B, and E). P values were determined by 2-tailed, unpaired Student’s t test (A and B) and 1-way ANOVA (E) and log-rank test (C and D).

Similar articles

Cited by

References

    1. Oliveira G, Wu CJ. Dynamics and specificities of T cells in cancer immunotherapy. Nat Rev Cancer. 2023;23(5):295–316. doi: 10.1038/s41568-023-00560-y. - DOI - PMC - PubMed
    1. Belfiore A, et al. IGF2: a role in metastasis and tumor evasion from immune surveillance? Biomedicines. 2023;11(1):229. doi: 10.3390/biomedicines11010229. - DOI - PMC - PubMed
    1. Bassez A, et al. A single-cell map of intratumoral changes during anti-PD1 treatment of patients with breast cancer. Nat Med. 2021;27(5):820–832. doi: 10.1038/s41591-021-01323-8. - DOI - PubMed
    1. Sharma P, et al. Immune checkpoint therapy-current perspectives and future directions. Cell. 2023;186(8):1652–1669. doi: 10.1016/j.cell.2023.03.006. - DOI - PubMed
    1. Morad G, et al. Hallmarks of response, resistance, and toxicity to immune checkpoint blockade. Cell. 2021;184(21):5309–5337. doi: 10.1016/j.cell.2021.09.020. - DOI - PMC - PubMed

MeSH terms