. 2024 Sep 23;25(6):bbae574.
doi: 10.1093/bib/bbae574.

Generating pregnant patient biological profiles by deconvoluting clinical records with electronic health record foundation models

Affiliations

Generating pregnant patient biological profiles by deconvoluting clinical records with electronic health record foundation models

David Seong et al. Brief Bioinform. .

Abstract

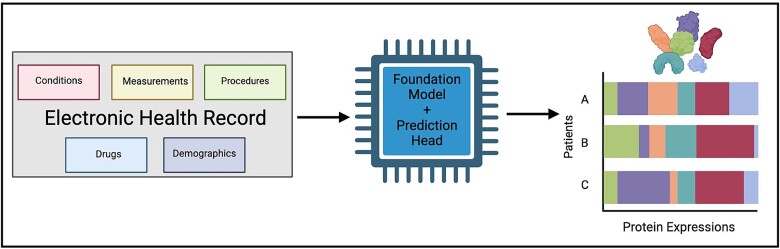
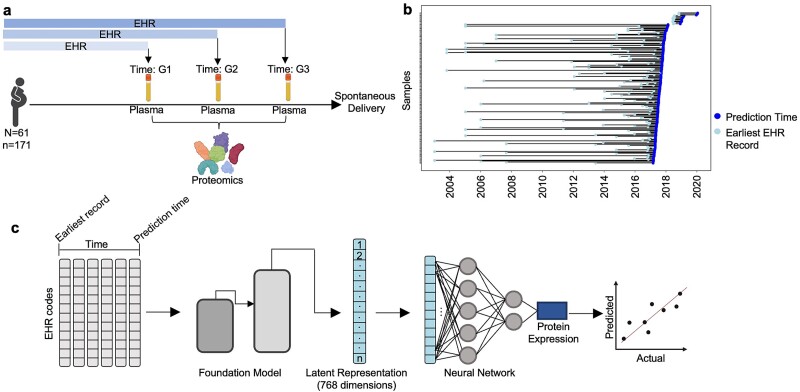
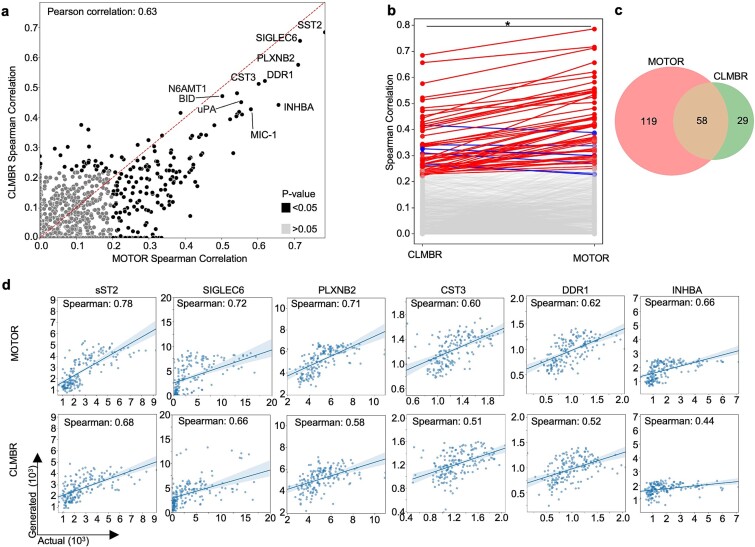
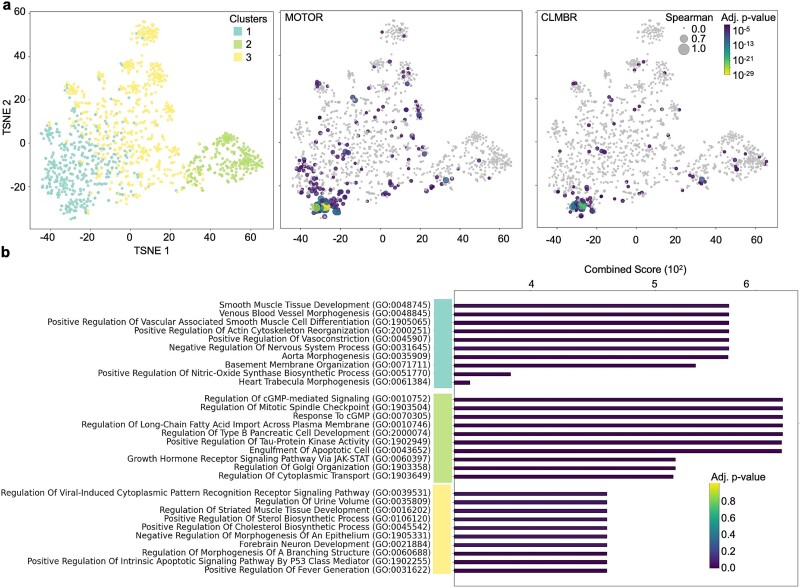
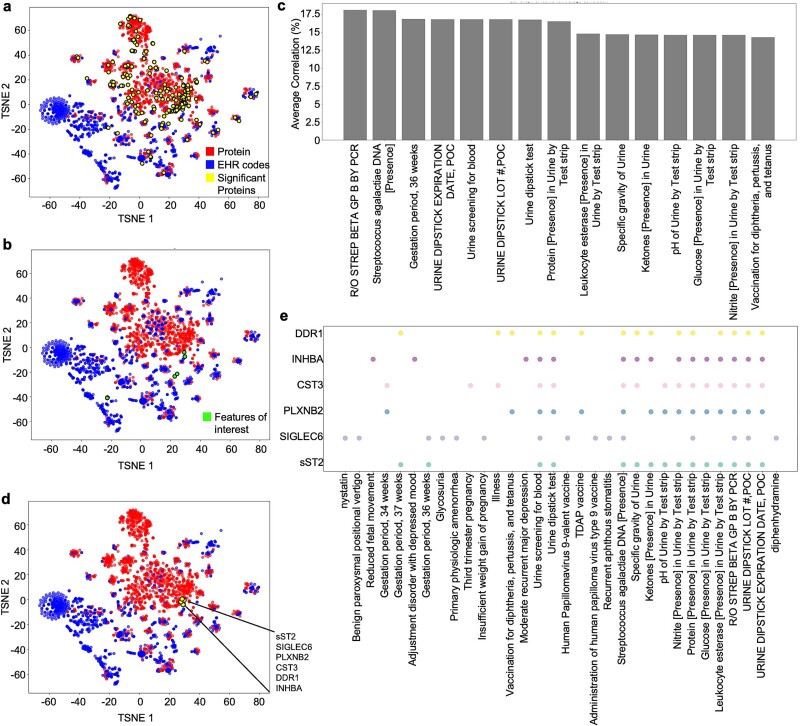
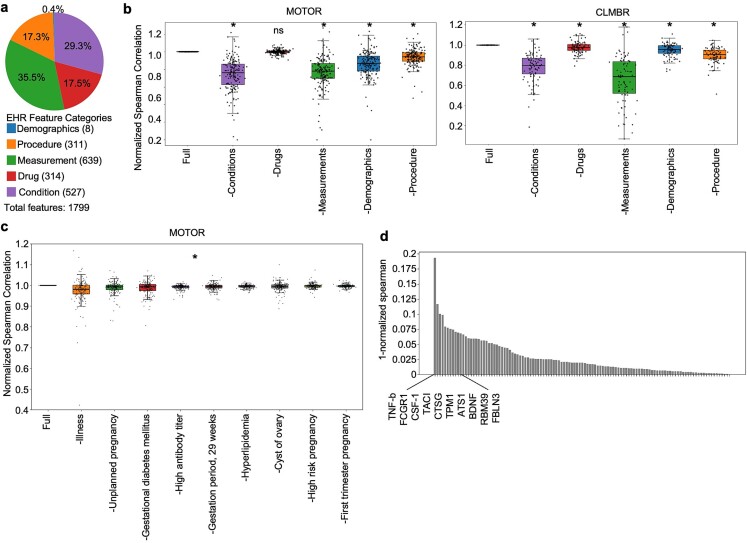
Translational biology posits a strong bi-directional link between clinical phenotypes and a patient's biological profile. By leveraging this bi-directional link, we can efficiently deconvolute pre-existing clinical information into biological profiles. However, traditional computational tools are limited in their ability to resolve this link because of the relatively small sizes of paired clinical-biological datasets for training and the high dimensionality/sparsity of tabular clinical data. Here, we use state-of-the-art foundation models (FMs) for electronic health record (EHR) data to generate proteomics profiles of pregnant patients, thereby deconvoluting pre-existing clinical information into biological profiles without the cost and effort of running large-scale traditional omics studies. We show that FM-derived representations of a patient's EHR data coupled with a fully connected neural network prediction head can generate 206 blood protein expression levels. Interestingly, these proteins were enriched for developmental pathways, while proteins not able to be generated from EHR data were enriched for metabolic pathways. Finally, we show a proteomic signature of gestational diabetes that includes proteins with established and novel links to gestational diabetes. These results showcase the power of FM-derived EHR representations in efficiently generating biological states of pregnant patients. This capability can revolutionize disease understanding and therapeutic development, offering a cost-effective, time-efficient, and less invasive alternative to traditional methods of generating proteomics.

Keywords: electronic health record; foundation model; machine learning; pregnancy; proteomics.


Figures

Graphical Abstract
Graphical Abstract
Figure 1
Figure 1
Integration of EHR and proteomics data of pregnant patients using electronic medical record–trained FMs. (a) To train a model capable of efficiently generating proteomics profiles from existing EHR records of pregnant patients, we collected paired EHR–proteomics samples. Proteomics data were collected for each patient from a minimum of one and a maximum of three plasma samples collected per patient. One thousand three hundred five proteins were measured per patient. Patient EHR records were obtained from the earliest EHR entry at Stanford to the sample collection date. Our final cohort had n = 171 samples from N = 61 unique individuals. G1, G2, and G3 represent various gestation time periods where plasma was sampled for proteomics (run on SomaLogic’s platform). (b) EHR records of samples encompassed a wide range of duration, spanning a minimum of 1 month to a maximum of 14.3 years with a median of 1.5 years. (c) Two state-of-the-art EHR foundation models were used to generate low-dimensional latent representations of EHR data for the generation of proteomics expression. EHR records encompassed five categories: demographics, drugs, conditions, procedures, and measurements. Preprocessed EHR data were fed into FMs MOTOR and CLMBR to generate a 768-dimensional vector representation of a sample’s EHR data up to and including the sample collection date. Representations and paired protein expression from proteomics data were used to train 1305 single-task neural networks consisting of two fully connected layers to generate protein expression values for 1305 proteins. Generative performance was assessed by calculating the Spearman correlation between actual and generated values of each protein with a P-value corrected for multiple hypothesis testing using the Benjamini–Hochberg method.
Figure 2
Figure 2
FM representations of EHR data generate proteomics expression values. (a) Scatterplot demonstrates that both MOTOR and CLMBR representations of EHR data are useful in generating protein expression values from EHR data. Axes plot Spearman coefficients between actual and generated values for each protein when generated using MOTOR (x-axis) and CLMBR (y-axis) representations. Select top proteins are labeled. Gray dots indicate proteins with adjusted P-value >.05 for both models. Dotted red line indicates theoretically equal performance by both models. Pearson correlation of the Spearman coefficients for proteins across MOTOR and CLMBR was calculated to assess the correlation of performance. P-value of the Pearson coefficient was 3.01e-147. (b) To determine if the choice of FM matters for proteomics generation, we directly compared the generative performance of MOTOR versus CLMBR. Line graph shows the change in Spearman correlation for each protein when generated using MOTOR versus CLMBR representations of EHR data. Gray lines are proteins with adjusted P-value >.05 for either model representation. Red lines indicate an increase in Spearman correlation for a given protein from CLMBR to MOTOR while blue lines indicate a decrease in Spearman correlation. * denotes significant adjusted P-value (P = 4.94e-10) using paired Wilcoxon test. (c): Venn diagram of the number of proteins with significant adjusted P-value (<.05) for each model shows MOTOR had approximately four times as many significant proteins compared to CLMBR. (d) Scatterplot showing actual (x-axis) and generated (y-axis) values for the top six proteins generated using MOTOR and CLMBR representations. Generated protein expression values for each patient sample are the average generated value of 10 bootstrap iterations. Line shows the line of best fit with a 95% confidence interval shaded. n = 171.
Figure 3
Figure 3
Significant proteins are enriched in development-related pathways. (a) To identify biological patterns in significant versus nonsignificant proteins, k-means clustering and tSNE dimensionality reduction for visualization were performed using protein expression correlations. Pearson correlation matrix was calculated using protein expressions of all proteins across all patient samples. (Left) Cluster number was determined using an elbow plot and piecewise regression. K-means clustering was performed on the correlation matrix. Significant proteins were concentrated in clusters 1 and 3. Nonsignificant proteins were concentrated in cluster 2. Dot sizes indicate Spearman correlation, and color indicates the adjusted P-value of the protein when generated using MOTOR (middle) or CLMBR (right) representations of EHR data. Gray dots are proteins with adjusted P-value >.05. (b): Proteins in each cluster were analyzed by gene set enrichment analysis. The top 10 results for each cluster ranked by combined score (a ranking metric that adjusts for varying lengths of gene sets in each GO developed by Enrichr) after filtering for significant (adjusted P-value <.05) GO pathways are shown. Cluster 1 and 3 proteins, which have the highest number of significant proteins, are enriched in developmental pathways while cluster 2, which has the lowest number of significant proteins, is enriched in metabolic pathways.
Figure 4
Figure 4
Correlation analysis reveals that immune and urine-related clinical features are most associated with significant proteins. (a) To identify EHR features most linearly associated with protein expression, tSNE dimensionality reduction of EHR–protein Pearson correlations was performed, revealing select features that clustered close to significant proteins. EHR count matrix was created by counting the number of times each code appeared in a patient’s record. Final EHR feature count matrix was concatenated with the true protein expression matrix for correlation calculation. Points were colored by category (protein or feature). Yellow proteins are all significantly predicted proteins using either MOTOR or CLMBR (206 proteins). (b) Top 15 EHR features with the highest average correlation across all 206 significantly predicted proteins are marked as green. (c) Average correlation of the top 15 EHR features (marked in green in Fig. 4b) with the highest average correlation across all 206 significantly predicted proteins were identified. Features include various gestation time points, urinalysis assays, and vaccinations. (d) Top proteins with the highest (>0.6) Spearman coefficients in the MOTOR model were identified on the tSNE to determine the top features that were most closely correlated to the proteins. (e) Top 15 features with the highest correlation for each protein. Dot represents the presence of a feature (x-axis) in the top 15 most correlated features list for a given protein (y-axis).
Figure 5
Figure 5
Dropout feature importance analysis reveals proteomic signature of gestational diabetes. (a) In addition to simple linear associations, machine learning models can capture complex nonlinear relationships between features and output. To identify such complex biological relationships useful in proteomics generation, dropout feature importance was performed to identify EHR features most helpful in generating proteomics expressions. A total of 1799 unique EHR records that were recorded for at least one sample are grouped into the five EHR categories as shown. (b) Each category of EHR information in Fig. 5a was dropped one at a time before creating FM-derived representations of EHR data for a dropout feature importance analysis. These five dropout representations were used as input to models for each protein trained on the full EHR representation created in Fig. 2. Dropout model performance was compared to the full model’s performance by comparing normalized Spearman correlations to the full model (Spearman correlation of dropout EHR representation/Spearman correlation of full EHR representation) for each protein. X-axis labels are formatted as follows: −X where X is the EHR category removed when creating FM representations. * denotes adjusted P-value statistical significance up to four decimal places using paired Wilcoxon test with multiple hypothesis correction using the Benjamini–Hochberg method. Condition codes were most important for MOTOR representations, while drugs were least important. (c) To identify which specific condition codes were most important in generative performance, a dropout experiment for individual condition codes was conducted similar to Fig. 5b using MOTOR representations. Only MOTOR-significant proteins (177 proteins) were used for analysis. *All conditions shown have normalized Spearman correlation significantly different from that of the full model (paired Wilcoxon test with Benjamini–Hochberg correction for multiple hypothesis testing). See Supplementary Table S2 for a full list. (d) Out of the top conditions shown in Fig. 5c, gestational diabetes was particularly interesting due to its specificity. To determine a proteomic signature for gestational diabetes, we identified all proteins with a decrease in generative performance when the gestational diabetes code was removed from their EHR. One hundred fifteen proteins had decreased Spearman coefficients when compared to Spearman coefficients generated with the full model, indicating a link between them and gestational diabetes. The top 10 are highlighted here. For a full list, see Supplementary Table S3. Proteins with established and novel links to gestational diabetes were identified.

Similar articles

Cited by

  • A machine learning approach to leveraging electronic health records for enhanced omics analysis.
    Mataraso SJ, Espinosa CA, Seong D, Reincke SM, Berson E, Reiss JD, Kim Y, Ghanem M, Shu CH, James T, Tan Y, Shome S, Stelzer IA, Feyaerts D, Wong RJ, Shaw GM, Angst MS, Gaudilliere B, Stevenson DK, Aghaeepour N. Mataraso SJ, et al. Nat Mach Intell. 2025;7(2):293-306. doi: 10.1038/s42256-024-00974-9. Epub 2025 Jan 16. Nat Mach Intell. 2025. PMID: 40008295 Free PMC article.
  • AI-guided precision parenteral nutrition for neonatal intensive care units.
    Phongpreecha T, Ghanem M, Reiss JD, Oskotsky TT, Mataraso SJ, De Francesco D, Reincke SM, Espinosa C, Chung P, Ng T, Costello JM, Sequoia JA, Razdan S, Xie F, Berson E, Kim Y, Seong D, Szeto MY, Myers F, Gu H, Feister J, Verscaj CP, Rose LA, Sin LWY, Oskotsky B, Roger J, Shu CH, Shome S, Yang LK, Tan Y, Levitte S, Wong RJ, Gaudillière B, Angst MS, Montine TJ, Kerner JA, Keller RL, Shaw GM, Sylvester KG, Fuerch J, Chock V, Gaskari S, Stevenson DK, Sirota M, Prince LS, Aghaeepour N. Phongpreecha T, et al. Nat Med. 2025 Jun;31(6):1882-1894. doi: 10.1038/s41591-025-03601-1. Epub 2025 Mar 25. Nat Med. 2025. PMID: 40133525 Free PMC article.
  • Advancing neonatal health: the promise and challenges of universal genome sequencing in newborn screening.
    Stevenson DK, Wong RJ, Reiss JD, Shaw GM, Aghaeepour N, Mahzarnia A, Marić I. Stevenson DK, et al. Pediatr Res. 2025 Mar;97(4):1258-1260. doi: 10.1038/s41390-025-03874-9. Epub 2025 Jan 20. Pediatr Res. 2025. PMID: 39833347 No abstract available.

References

    1. Wolf J, Rasmussen DK, Sun YJ. et al. . Liquid-biopsy proteomics combined with AI identifies cellular drivers of eye aging and disease in vivo. Cell 2023;186:4868–4884.e12. 10.1016/j.cell.2023.09.012 - DOI - PMC - PubMed
    1. Espinosa CA, Khan W, Khanam R. et al. . Multiomic signals associated with maternal epidemiological factors contributing to preterm birth in low- and middle-income countries. Sci Adv 2023;9:eade7692. - PMC - PubMed
    1. Buergel T, Steinfeldt J, Ruyoga G. et al. . Metabolomic profiles predict individual multidisease outcomes. Nat Med 2022;28:2309–20. 10.1038/s41591-022-01980-3 - DOI - PMC - PubMed
    1. Carrasco-Zanini J, Pietzner M, Davitte J. et al. . Proteomic signatures improve risk prediction for common and rare diseases. Nat Med 2024;30:2489–98. 10.1038/s41591-024-03142-z - DOI - PMC - PubMed
    1. Carrasco-Zanini J, Pietzner M, Koprulu M. et al. . Proteomic prediction of diverse incident diseases: a machine learning-guided biomarker discovery study using data from a prospective cohort study. Lancet Digit Health 2024;6:e470–9. 10.1016/S2589-7500(24)00087-6 - DOI - PubMed