. 2024 Nov 15:13:RP95672.
doi: 10.7554/eLife.95672.

Targeting resident astrocytes attenuates neuropathic pain after spinal cord injury

Affiliations

Targeting resident astrocytes attenuates neuropathic pain after spinal cord injury

Qing Zhao et al. Elife. .

Abstract

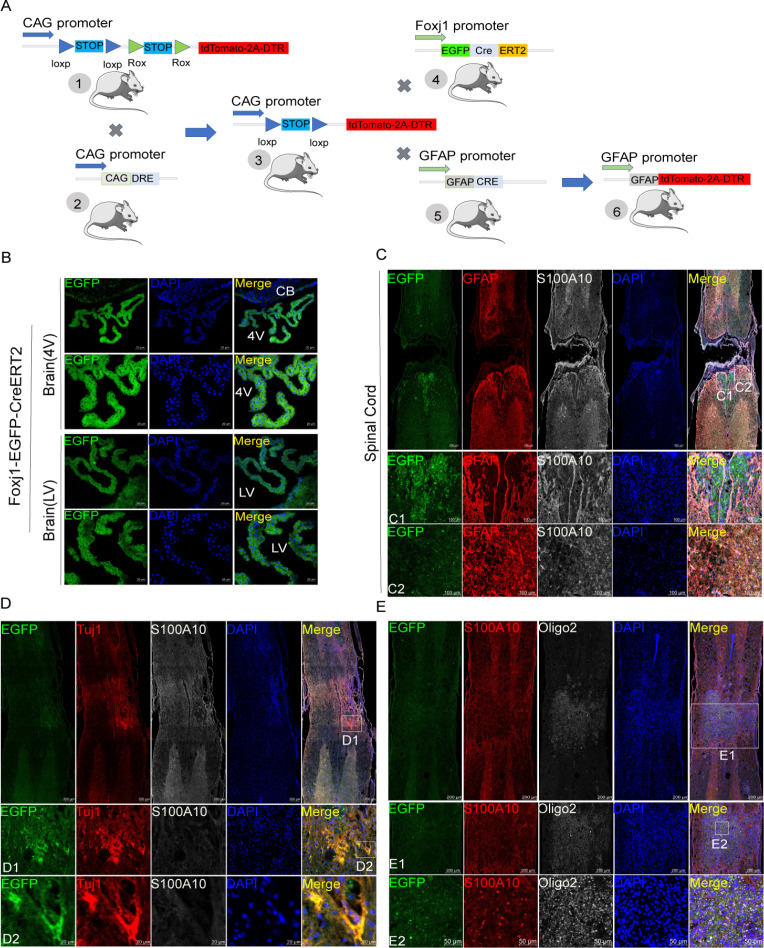
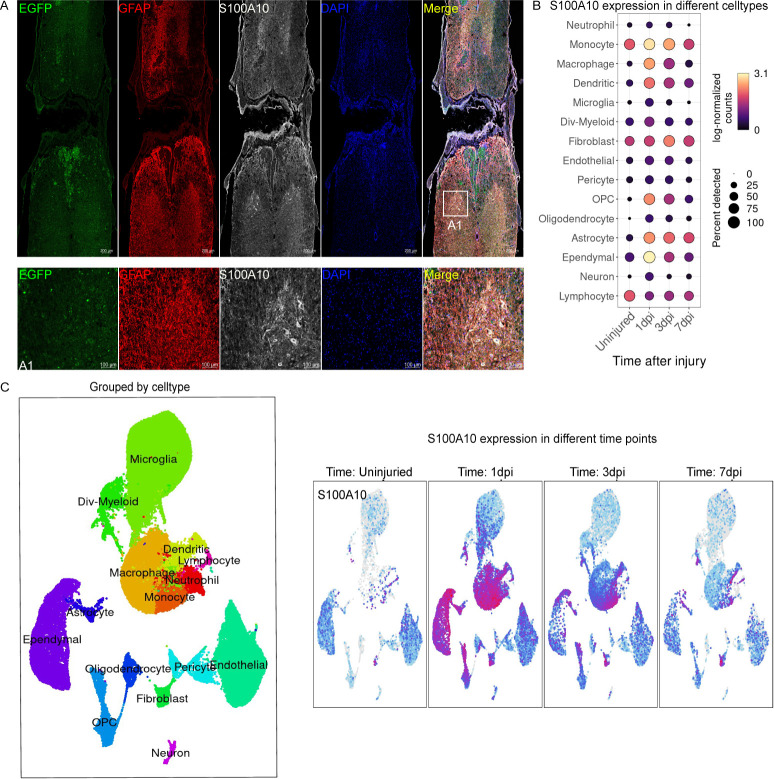
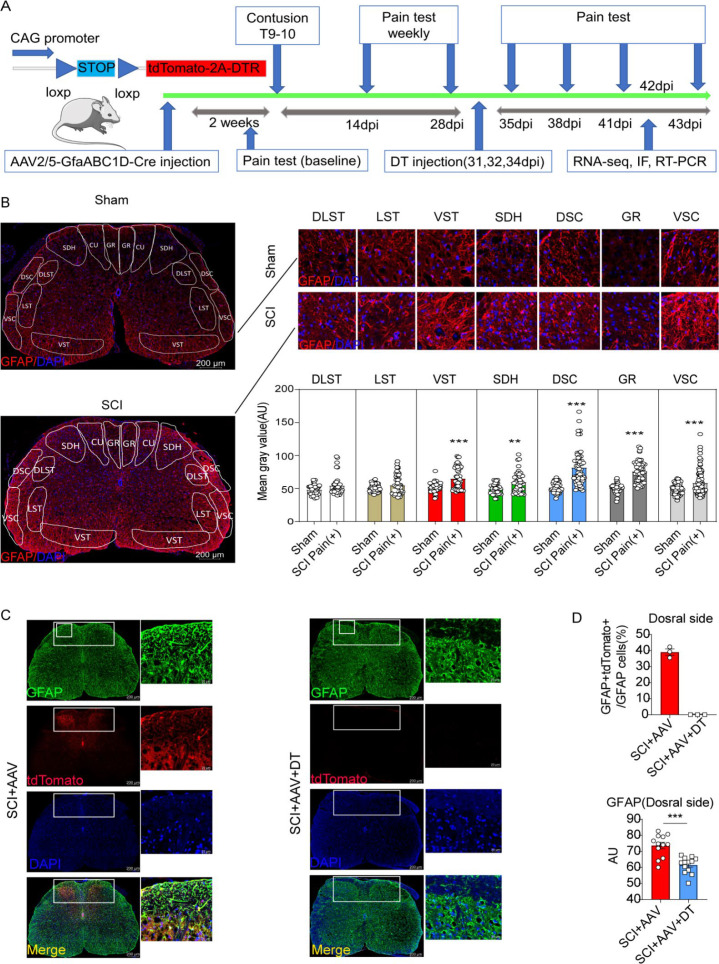
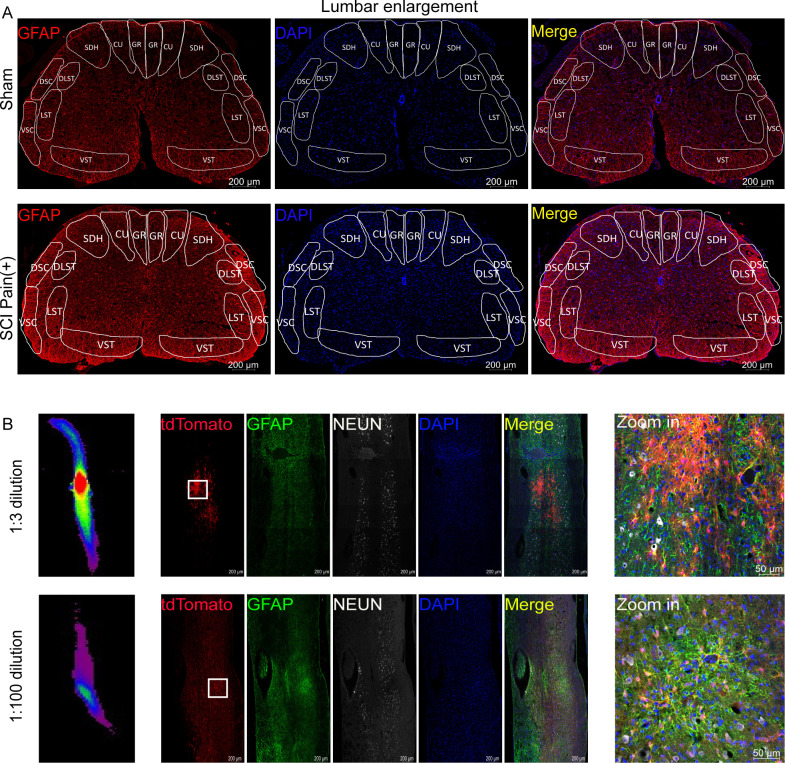
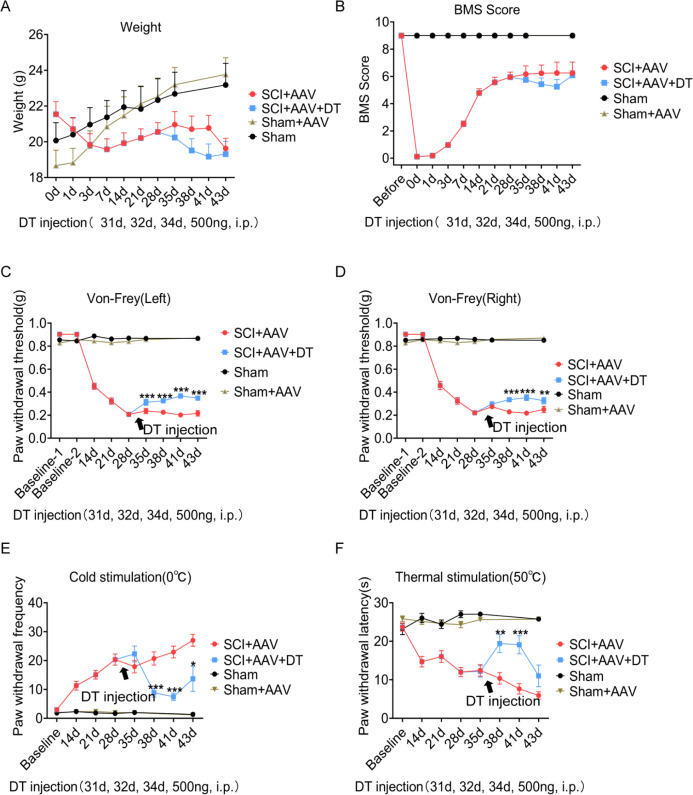
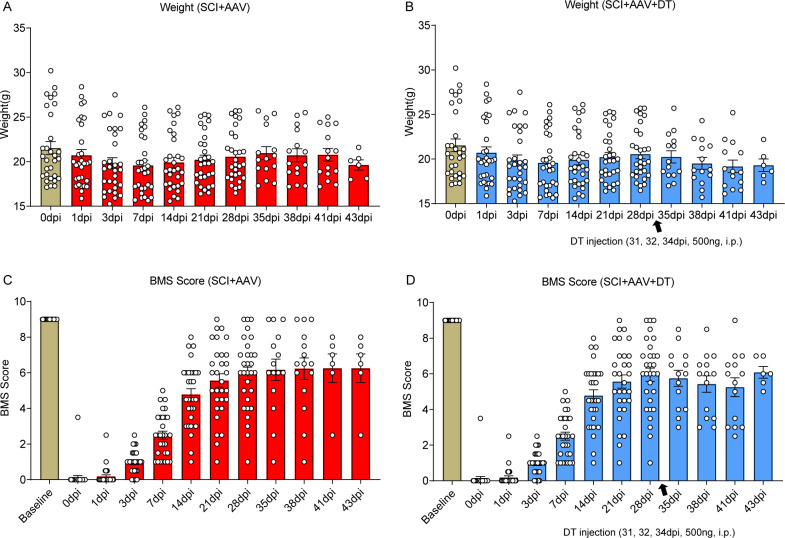
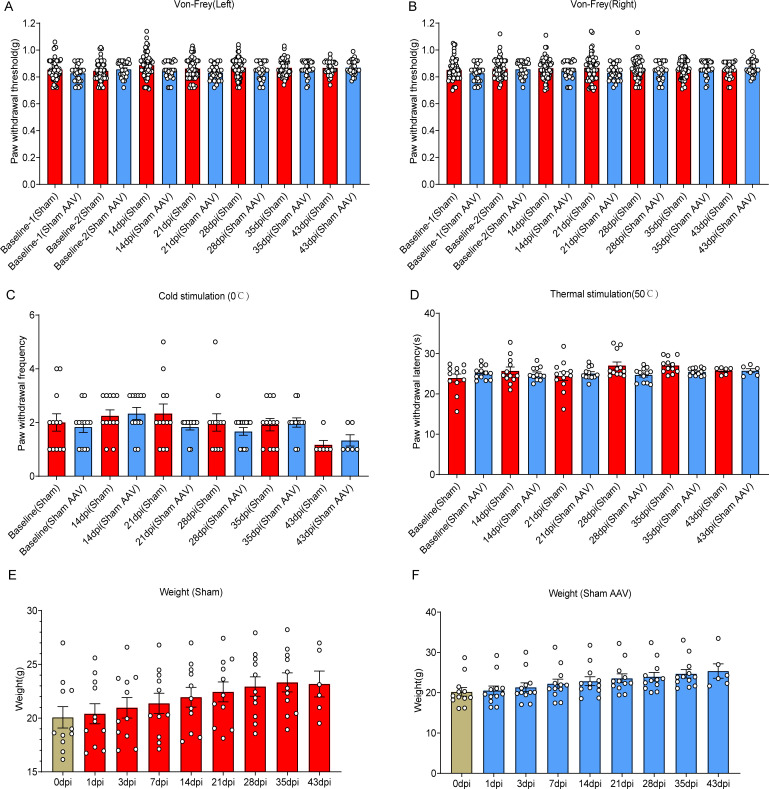
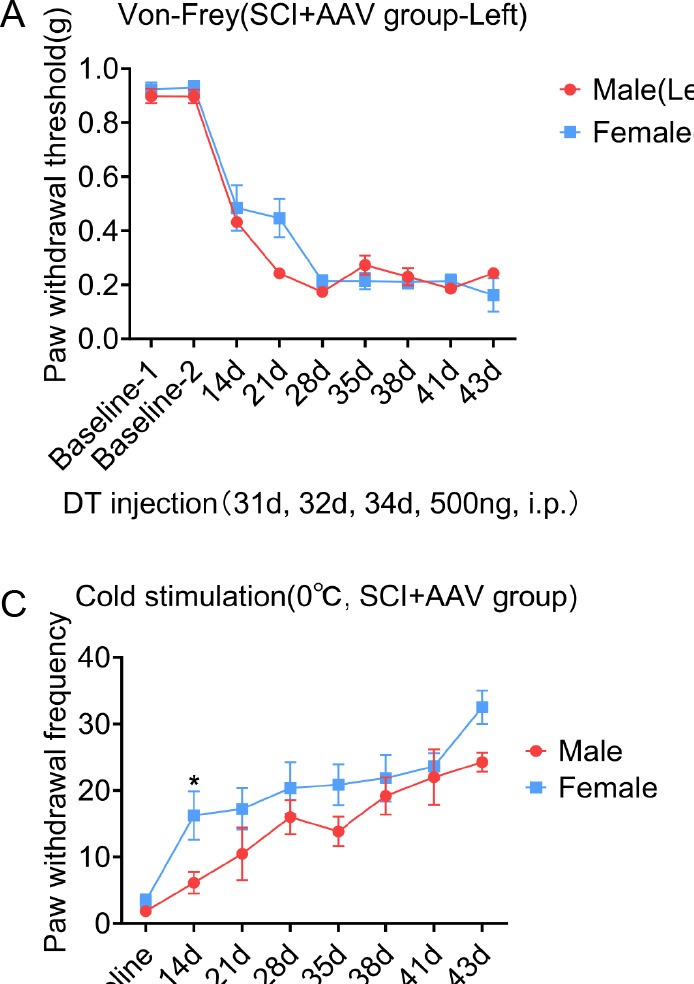
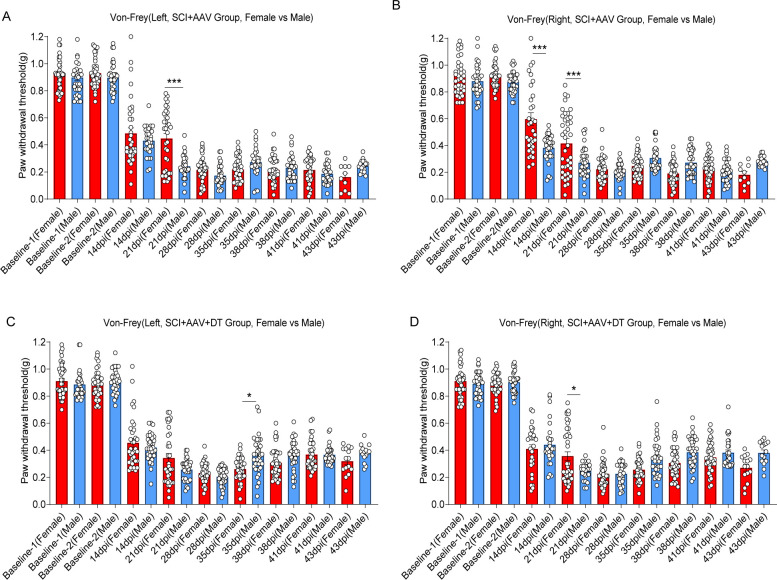
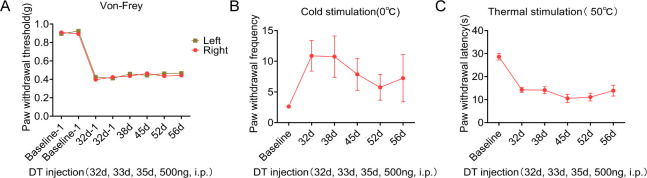
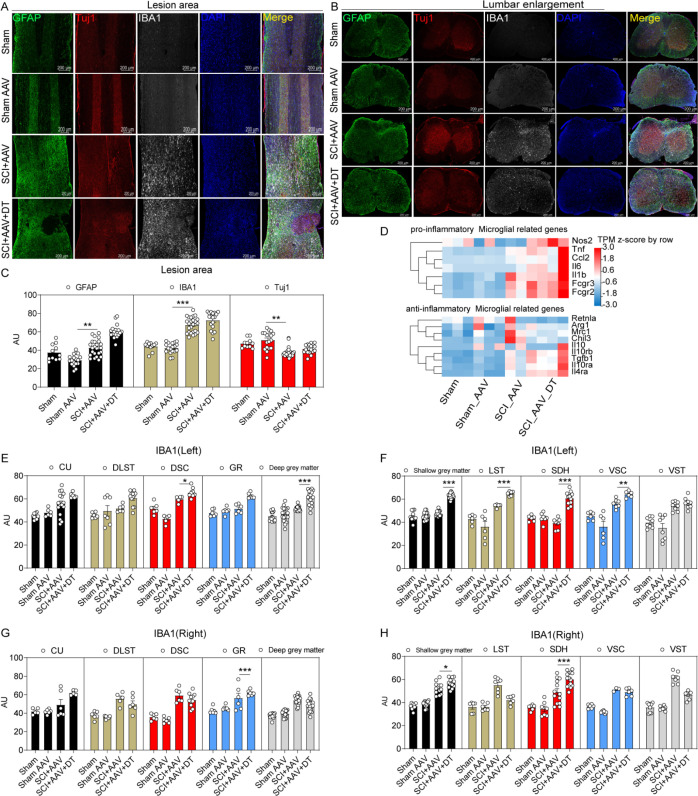
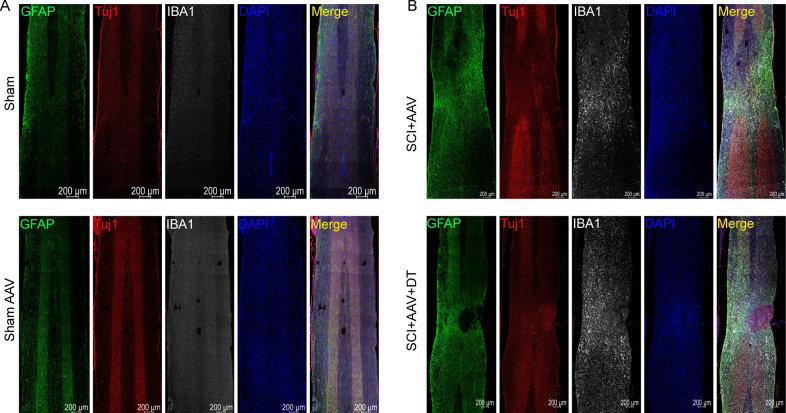
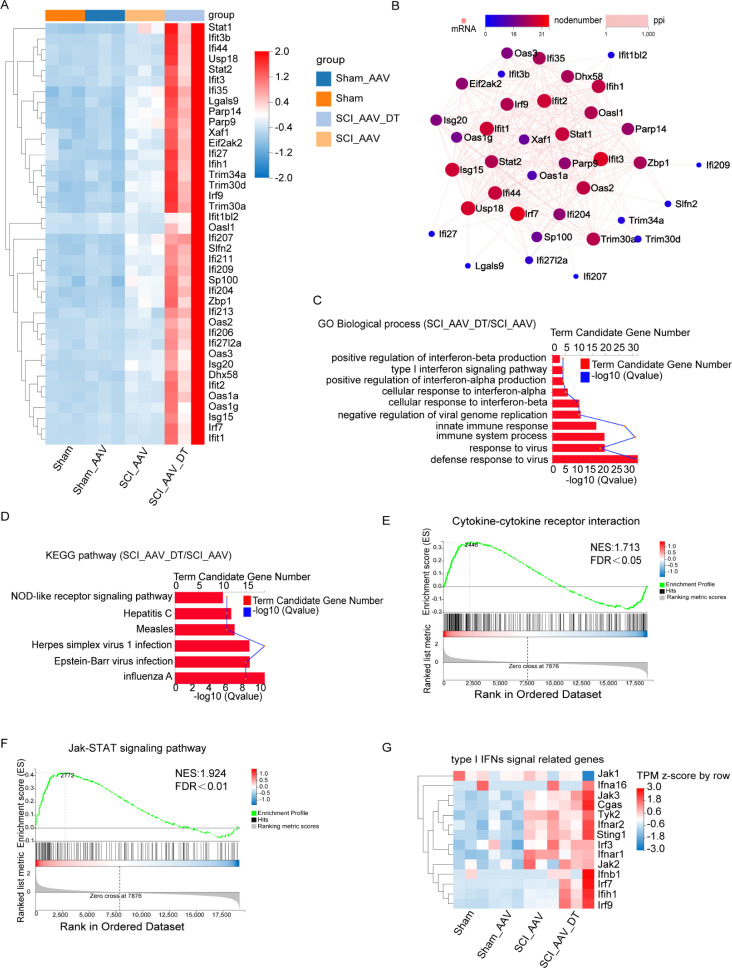
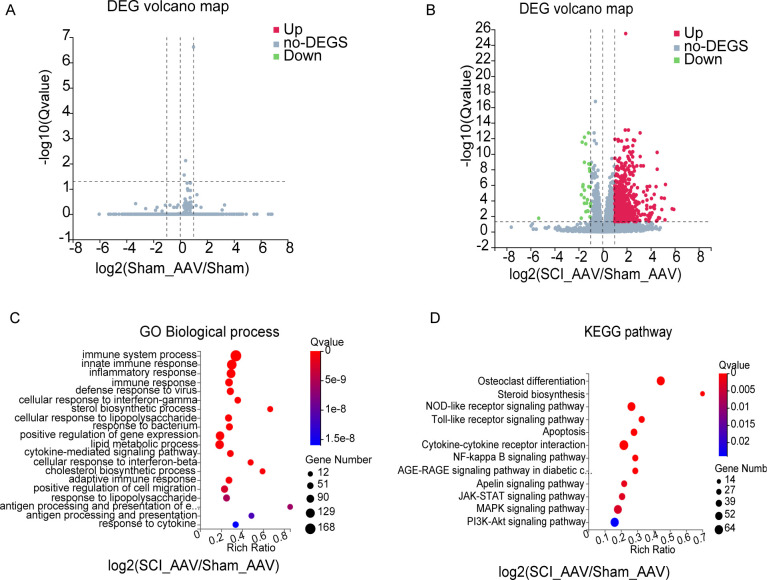
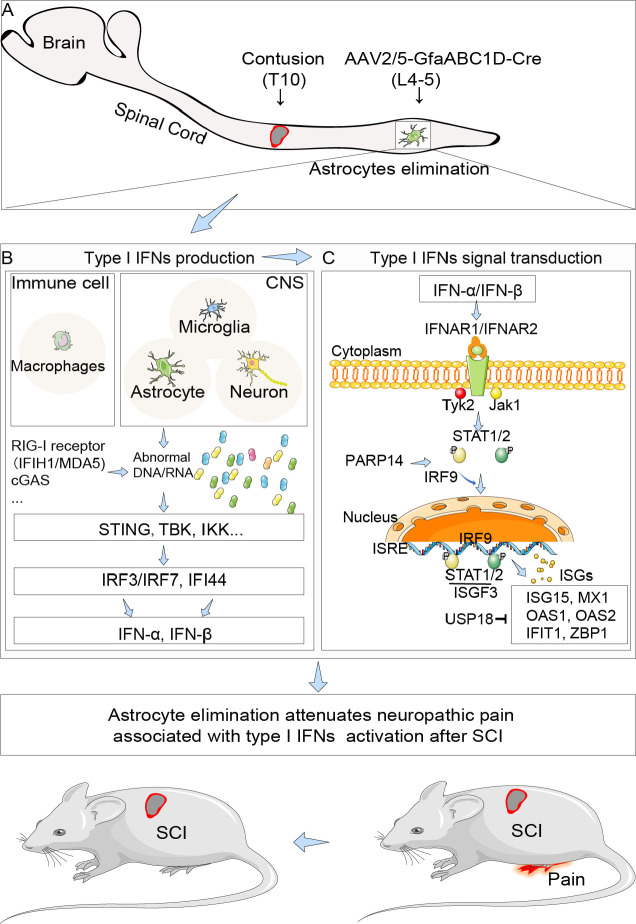
Astrocytes derive from different lineages and play a critical role in neuropathic pain after spinal cord injury (SCI). Whether selectively eliminating these main origins of astrocytes in lumbar enlargement could attenuate SCI-induced neuropathic pain remains unclear. Through transgenic mice injected with an adeno-associated virus vector and diphtheria toxin, astrocytes in lumbar enlargement were lineage traced, targeted, and selectively eliminated. Pain-related behaviors were measured with an electronic von Frey apparatus and a cold/hot plate after SCI. RNA sequencing, bioinformatics analysis, molecular experiment, and immunohistochemistry were used to explore the potential mechanisms after astrocyte elimination. Lineage tracing revealed that the resident astrocytes but not ependymal cells were the main origins of astrocytes-induced neuropathic pain. SCI-induced mice to obtain significant pain symptoms and astrocyte activation in lumbar enlargement. Selective resident astrocyte elimination in lumbar enlargement could attenuate neuropathic pain and activate microglia. Interestingly, the type I interferons (IFNs) signal was significantly activated after astrocytes elimination, and the most activated Gene Ontology terms and pathways were associated with the type I IFNs signal which was mainly activated in microglia and further verified in vitro and in vivo. Furthermore, different concentrations of interferon and Stimulator of interferon genes (STING) agonist could activate the type I IFNs signal in microglia. These results elucidate that selectively eliminating resident astrocytes attenuated neuropathic pain associated with type I IFNs signal activation in microglia. Targeting type I IFNs signals is proven to be an effective strategy for neuropathic pain treatment after SCI.

Keywords: Type I interferon; astrocyte; mouse; neuropathic pain; neuroscience; origins; spinal cord injury.


Conflict of interest statement

QZ, YZ, YR, LZ, JZ, SY, HN, RZ, LC, NX No competing interests declared

Figures

Figure 1.
Figure 1.. Ependymal cells did not transform into astrocytes in our transgenic mice.
(A) Construction strategies of transgenic mice. (B) Ependymal cells both in the fourth ventricle (4 V) and lateral ventricle (LV) had been labeled by reporter gene eGFP (green). n=6 biological repeats. (C) Ependymal cells did not produce astrocytes in the lesion area. n=3 biological repeats. (D–E) Ependymal cells were observed to produce offspring of neurons (Tuj1+, red), Oligo2 (white) negative, and S100A10 (white in D or red in E) positive cells in the epicenter. n=3 biological repeats. 4V=fourth ventricle, LV = lateral ventricle, CB = Cerebellum. Scale bars had been indicated in pictures.
Figure 1—figure supplement 1.
Figure 1—figure supplement 1.. S100 family protein p11 (S100A10) is expressed by various cell types.
(A) S100A10 is expressed in astrocytes and neuronal-like cells of gray matter. Glial fibrillary acidic protein (GFAP) (red, marker of astrocytes), eGFP (green), S100A10 (white). n=3 biological repeats. Scale bars had been indicated in pictures. (B–C) S100A10 is expressed by various cell types at different times after spinal cord injury (SCI). Figures were analyzed and downloaded through online data from injured mouse spinal cords (https://jaeleelab.shinyapps.io/sci_singlecell/).
Figure 2.
Figure 2.. Resident astrocytes in lumbar enlargement were selectively targeted and eliminated.
(A) The experiment flowchart. (B) The histogram and statistical results of glial fibrillary acidic protein (GFAP) fluorescence intensity. The location of the three largest ascending tracts of lumbar enlargements, including (1) CU, GR; (2) LST, DLST, VST; (3) DSC, VSC, along with SDH and gray matter. CU = cuneate fasciculus, GR = gracile fasciculus, LST = lateral spinothalamic tract, DLST = dorsolateral spinothalamic tract, VST = ventral spinothalamic tract, DSC = dorsal spinocerebellar tract, VSC = ventral spinocerebellar tract, SDH = superficial dorsal horn. n=3 biological repeats. Scale bar, 200 μm. Values are the mean ± SEM. Statistical significance was determined by two-way ANOVA followed by the Student Newman–Keuls post hoc test. **p<0.01, ***p<0.001, Sham group vs. spinal cord injury (SCI) Pain positive (+) group. (C), AAV2/5-GfaABC1D-Cre targeted astrocytes were mainly on the dorsal side and reflected by tdTomato and GFAP double-positive cells in the SCI + AAV group, no tdTomato, and GFAP double-positive cells were found in the SCI + AAV + DT group. n=3 biological repeats. Scale bars had been indicated in pictures. (D), the efficiency of astrocyte labeling and elimination in the dorsal side of spinal cord. Immunofluorescence analysis results of the GFAP after selective astrocyte elimination. Values are the mean ± SEM. Statistical significance was determined by two-way ANOVA followed by the Student Newman–Keuls post hoc test. n=3 biological repeats. TdTomato-positive cells indicated AAV. 2/5-GfaABC1D-Cre targeted astrocytes. ***p<0.001.
Figure 2—figure supplement 1.
Figure 2—figure supplement 1.. Astrocytes activation in the lumbar enlargement of neuropathic pain mice.
The results of AAV2/5-GfaABC1D-Cre targeted astrocytes in the lumbar enlargement. (A) Images of immunofluorescent staining using glial fibrillary acidic protein (GFAP) (red) as a marker of astrocytes. The location of the three largest ascending tracts of lumbar enlargements, including (1) CU, GR; (2) LST, DLST, VST; (3) DSC, VSC, along with SDH and gray matter. CU = cuneate fasciculus, GR = gracile fasciculus, LST = lateral spinothalamic tract, DLST = dorsolateral spinothalamic tract, VST = ventral spinothalamic tract, DSC = dorsal spinocerebellar tract, VSC = ventral spinocerebellar tract, SDH = superficial dorsal horn. Scale bar, 200 μm. (B) Targeting astrocyte in lumbar enlargement with AAV2/5-GfaABC1D-Cre. 1:3 dilution, ≥0.33E+13 V.G/ml; 1:100 dilution, ≥1E+11 V.G/ml. Images of immunofluorescent staining using GFAP (green) and neuronal nuclear antigen (NEUN) (white) as characteristic markers of neurons and astrocytes. n=3 biological repeats. Scale bars had been indicated in pictures.
Figure 3.
Figure 3.. Selective astrocyte elimination in lumbar enlargement attenuated neuropathic pain.
Change of weight (A) BMS scores (B), mechanical allodynia (C–D), cold hyperalgesia (E), and thermal hyperalgesia (F) in mice after astrocyte elimination. Sham group, n=30; sham + AAV group, n=30; SCI + AAV group, n=36; SCI + AAV + DT group, n=36. Arrow, 500 ng DT injection was performed on 31, 32, and 34 dpi (days post-injury). Left, left hindlimbs; right, right hindlimbs. i.p., intraperitoneal injection. Values are the mean ± SEM. Statistical significance was determined by two-way ANOVA followed by the Student Newman–Keuls post hoc test. *p<0.05, **p<0.01, ***p<0.001, SCI + AAV + DT group vs. SCI + AAV group.
Figure 3—figure supplement 1.
Figure 3—figure supplement 1.. Selective astrocyte elimination in lumbar enlargement attenuated neuropathic pain.
Change of weight (A-B) Basso Mouse Scale (BMS) scores (C-D) in mice after astrocyte elimination. Sham group, n=30; sham + AAV group, n=30; SCI + AAV group, n=36; SCI + AAV + DT group, n=36. Arrow, 500 ng Diphtheria toxin (DT) injection was performed on 31, 32, and 34 dpi (days post-injury).
Figure 3—figure supplement 2.
Figure 3—figure supplement 2.. Selective astrocyte elimination in lumbar enlargement attenuated neuropathic pain.
Change of mechanical allodynia (A-B), cold hyperalgesia (C), and thermal hyperalgesia (D) in mice after astrocyte elimination. SCI + AAV group, n=36; SCI + AAV + DT group, n=36. Arrow, 500 ng Diphtheria toxin (DT) injection was performed on 31, 32, and 34 dpi (days post-injury). Left, left hindlimbs; right, right hindlimbs. i.p., intraperitoneal injection. Statistical significance was determined by two-way ANOVA followed by the Student Newman–Keuls post hoc test. **p<0.01, ***p<0.001, SCI + AAV + DT group vs. SCI + AAV group.
Figure 3—figure supplement 3.
Figure 3—figure supplement 3.. Selective astrocyte elimination in lumbar enlargement attenuated neuropathic pain.
Change of mechanical allodynia (A-B), cold hyperalgesia (C), and thermal hyperalgesia (D), weight (E-F) in mice of the sham group and sham + AAV group. Left, left hindlimbs; right, right hindlimbs.
Figure 3—figure supplement 4.
Figure 3—figure supplement 4.. No differences in neuropathic pain were observed between male and female mice.
(A–H) Change of mechanical allodynia (A–B, E–F), cold hyperalgesia (C, G), and thermal hyperalgesia (D, H) in mice of SCI + AAV group (n=36) and SCI + AAV + DT group (n=36). Arrow, 500 ng Diphtheria toxin (DT) injection was performed on 31, 32, and 34 dpi (days post-injury). Left, left hindlimbs; right, right hindlimbs. Values are the mean ± SEM. Statistical significance was determined by one-way ANOVA followed by the Student Newman–Keuls post hoc test. *p<0.05.
Figure 3—figure supplement 5.
Figure 3—figure supplement 5.. No significant differences in neuropathic pain were observed between male and female mice.
Change of mechanical allodynia (A-D) in mice of SCI + AAV group and SCI + AAV + DT group after astrocyte elimination. SCI + AAV group, n=36; SCI + AAV + DT group, n=36. Left, left hindlimbs; right, right hindlimbs. Statistical significance was determined by one-way ANOVA followed by the Student Newman–Keuls post hoc test. *p<0.05, ***p<0.001, Female mice vs. male mice.
Figure 3—figure supplement 6.
Figure 3—figure supplement 6.. No significant differences in neuropathic pain were observed between male and female mice.
Change of cold hyperalgesia (A-B) and thermal hyperalgesia (C-D) in mice of SCI + AAV group and SCI + AAV + DT group after astrocyte elimination.
Figure 3—figure supplement 7.
Figure 3—figure supplement 7.. Pain symptoms were similar in wild-type mice with or without Diphtheria toxin (DT) injection.
Mechanical allodynia (A), cold (B), and thermal (C) hypersensitivity test results after DT injection in wild-type mice. n=8 biological repeats. Values are the mean ± SEM. Statistical significance was determined by two-way ANOVA was performed followed by the Student Newman–Keuls post hoc test.
Figure 4.
Figure 4.. Microglia in lumbar enlargement were activated after selective astrocyte elimination.
(A–B) Images of immunofluorescent staining using glial fibrillary acidic protein (GFAP) (green), Tuj1 (red), and IBA1 (white) as characteristic markers of astrocyte, neuron, and microglia, respectively. n=3 biological repeats. Scale bar, 200 μm. (C) The histogram and statistical results of GFAP, IBA1, and Tuj1 fluorescence intensity in the lesion area. (D) The heatmap showed that the transcripts of pro-inflammatory and anti-inflammatory microglial marker genes. n=3 biological repeats. (E–H) The histogram and statistical results of IBA1 fluorescence intensity in lumbar enlargement. CU = cuneate fasciculus, GR = gracile fasciculus, LST = lateral spinothalamic tract, DLST = dorsolateral spinothalamic tract, VST = ventral spinothalamic tract, DSC = dorsal spinocerebellar tract, VSC = ventral spinocerebellar tract, SDH = superficial dorsal horn. Values are the mean ± SEM. Statistical significance was determined by two-way ANOVA followed by the Student Newman–Keuls post hoc test. *p<0.05, **p<0.01, ***p<0.001, SCI + AAV + DT group vs. SCI + AAV group.
Figure 4—figure supplement 1.
Figure 4—figure supplement 1.. Full fluorescence images of the lesion area.
(A–B) The full fluorescence images of the lesion area. Images of immunofluorescent staining using glial fibrillary acidic protein (GFAP) (green), Tuj1 (red), and IBA1 (white) as characteristic markers of astrocyte, neuron, and microglia, respectively. n=3 biological repeats. Scale bar, 200 μm.
Figure 5.
Figure 5.. Selective astrocyte elimination activated Type I interferons (IFNs) signal.
(A) The heatmap showed the differentially expressed genes (DEGs) between the SCI + AAV + DT group and the SCI + AAV group. (B) Protein-protein interaction (PPI) network analysis showed the interaction of the DEGs between the SCI + AAV + DT group and the SCI + AAV group. (C) Gene ontology (GO) enrichment analysis revealed the dominant biological process of DEGs between the SCI + AAV + DT group and the SCI + AAV group. (D), Kyoto Encyclopedia of Genes and Genomes (KEGG) pathway showed dysregulated signaling pathways between the SCI + AAV + DT group and the SCI + AAV group. (E–F) Gene set enrichment analysis (GSEA) analysis showed the dysregulated signaling pathways between the SCI + AAV + DT group and the SCI + AAV group. (G) The heatmap showed that the critical gene expression involved in type I IFNs signal. n=3 biological repeats.
Figure 5—figure supplement 1.
Figure 5—figure supplement 1.. RNA-seq analysis results between the SCI + AAV group and sham adeno-associated virus (AAV) group.
(A–B) Volcano maps showed the differentially expressed genes (DEGs) between groups. (C–D) The gene ontology (GO) enrichment and Kyoto Encyclopedia of Genes and Genomes (KEGG) pathway analysis between the SCI + AAV group and the sham AAV group. n=3 biological repeats.
Figure 6.
Figure 6.. The type I interferons (IFNs) signal was activated in microglia after selective resident astrocyte elimination.
(A–B) RT-PCR identified the effects of selective astrocyte elimination and Diphtheria toxin (DT) injection alone on mRNA expression of type I IFNs signal genes. n=3 biological repeats. *p<0.05, **p<0.01, ***p<0.001. (C–D) Images of immunofluorescent staining and statistical results using IRF7, ISG15, and STAT1 as critical proteins of type I IFNs signal and microglia marker IBA1. Scale bar, 200 μm. n=3 biological repeats. *p<0.05, **p<0.01, ***p<0.001, SCI + AAV + DT group vs. SCI + AAV group. (E) Images of immunofluorescent staining using IRF7, ISG15, and IBA1. Scale bar, 200 μm. n=3 biological repeats. (F–G) The mRNA expression of pro- and anti-inflammatory microglial markers and type I IFNs signal critical genes after 0.2 μg/mL lipopolysaccharides (LPS) stimulation. n=3 biological repeats. *p<0.05, **p<0.01, ***p<0.001, Control group vs. LPS 0.2 μg group. All values are the mean ± SEM. Statistical significance was determined by two-way ANOVA followed by the Student Newman–Keuls post hoc test.
Figure 7.
Figure 7.. Interferon agonist (Ploy:IC) and an STING agonist (ADU-S100 and DMXAA) significantly activated the type I interferons (IFNs) signal in microglia.
(A-F) The mRNA expression levels of Irf7, Irf7, Ifnb, Stat2, Isg15, Stat1, and Irf9 after stimulating with different concentrations of Ploy:IC, ADU-S100, and DMXAA. n=3 biological repeats. *p<0.05, **p<0.01, ***p<0.001, treatment group vs. control group. All values are the mean ± SEM. Statistical significance was determined by two-way ANOVA followed by the Student Newman–Keuls post hoc test.
Figure 7—figure supplement 1.
Figure 7—figure supplement 1.. The potential schematic diagram of selective resident astrocytes elimination attenuated neuropathic pain after spinal cord injury (SCI).
(A) Astrocytes in lumbar enlargement were targeted and selectively eliminated through transgenic mice injected with an adeno-associated virus vector (AAV2/5-GfaABC1D-Cre) and diphtheria toxin. Selective astrocyte elimination in lumbar enlargement could attenuate neuropathic pain after SCI, which was associated with type I interferons (IFNs) signal and microglia activation. (B) The production of type I IFNs. Type I IFNs production is mainly caused by the contact of innate immune cells (mainly macrophages, microglia, and astrocytes in CNS) surface or internal receptors (RIG-I receptor Ifih1/Mda5, Cgas, etc.) with virus-specific antigenic substances (DNA, RNA), then through intracellular signal molecule transmission (Sting, Tbk, Ikk, etc.), and finally activate the transcription factor IRF3/7 to promote the expression of type I IFNs, including IFN-α and IFN-β. (C) The signal transduction of type I IFNs. Type I IFNs bind to the same two membrane-spanning polypeptide chains type I IFNs receptor 1/2 (IFNAR1/2) (Borden et al., 2007; Owens et al., 2014) and lead to cross phosphorylation and activation of Tyk2/JaK1. Activation of Tyk2 and JAK1 phosphorylate STAT1/2 to form a heterodimer, which then translocates to the nucleus and associates with IRF9 to further form the heterotrimeric transcription factor complex IFN-stimulated gene factor-3 (ISGF3). Finally, ISGF3 translocates to the nucleus and binds to specific IFN-response elements (ISREs) to control the expression of IFNs-stimulated genes (ISGs) (Rothhammer et al., 2016), including Isg15, Mx1, Oas1, Oas2, Ifit1, Zbp1.

Update of

  • doi: 10.1101/2024.01.23.576887
  • doi: 10.7554/eLife.95672.1
  • doi: 10.7554/eLife.95672.2

Similar articles

References

    1. Allnoch L, Baumgärtner W, Hansmann F. Impact of astrocyte depletion upon inflammation and demyelination in a murine animal model of multiple sclerosis. International Journal of Molecular Sciences. 2019;20:3922. doi: 10.3390/ijms20163922. - DOI - PMC - PubMed
    1. Anderson MA, Burda JE, Ren Y, Ao Y, O’Shea TM, Kawaguchi R, Coppola G, Khakh BS, Deming TJ, Sofroniew MV. Astrocyte scar formation aids central nervous system axon regeneration. Nature. 2016;532:195–200. doi: 10.1038/nature17623. - DOI - PMC - PubMed
    1. Barnabé-Heider F, Göritz C, Sabelström H, Takebayashi H, Pfrieger FW, Meletis K, Frisén J. Origin of new glial cells in intact and injured adult spinal cord. Cell Stem Cell. 2010;7:470–482. doi: 10.1016/j.stem.2010.07.014. - DOI - PubMed
    1. Barrat FJ, Crow MK, Ivashkiv LB. Interferon target-gene expression and epigenomic signatures in health and disease. Nature Immunology. 2019;20:1574–1583. doi: 10.1038/s41590-019-0466-2. - DOI - PMC - PubMed
    1. Basso DM, Fisher LC, Anderson AJ, Jakeman LB, McTigue DM, Popovich PG. Basso Mouse Scale for locomotion detects differences in recovery after spinal cord injury in five common mouse strains. Journal of Neurotrauma. 2006;23:635–659. doi: 10.1089/neu.2006.23.635. - DOI - PubMed

Substances