. 2024 Dec 20;19(12):2580-2592.
doi: 10.1021/acschembio.4c00687. Epub 2024 Nov 15.

Mycobacterium tuberculosis Mce3R TetR-like Repressor Forms an Asymmetric Four-Helix Bundle and Binds a Nonpalindrome Sequence†

Affiliations

Mycobacterium tuberculosis Mce3R TetR-like Repressor Forms an Asymmetric Four-Helix Bundle and Binds a Nonpalindrome Sequence†

Navanjalee T Panagoda et al. ACS Chem Biol. .

Abstract

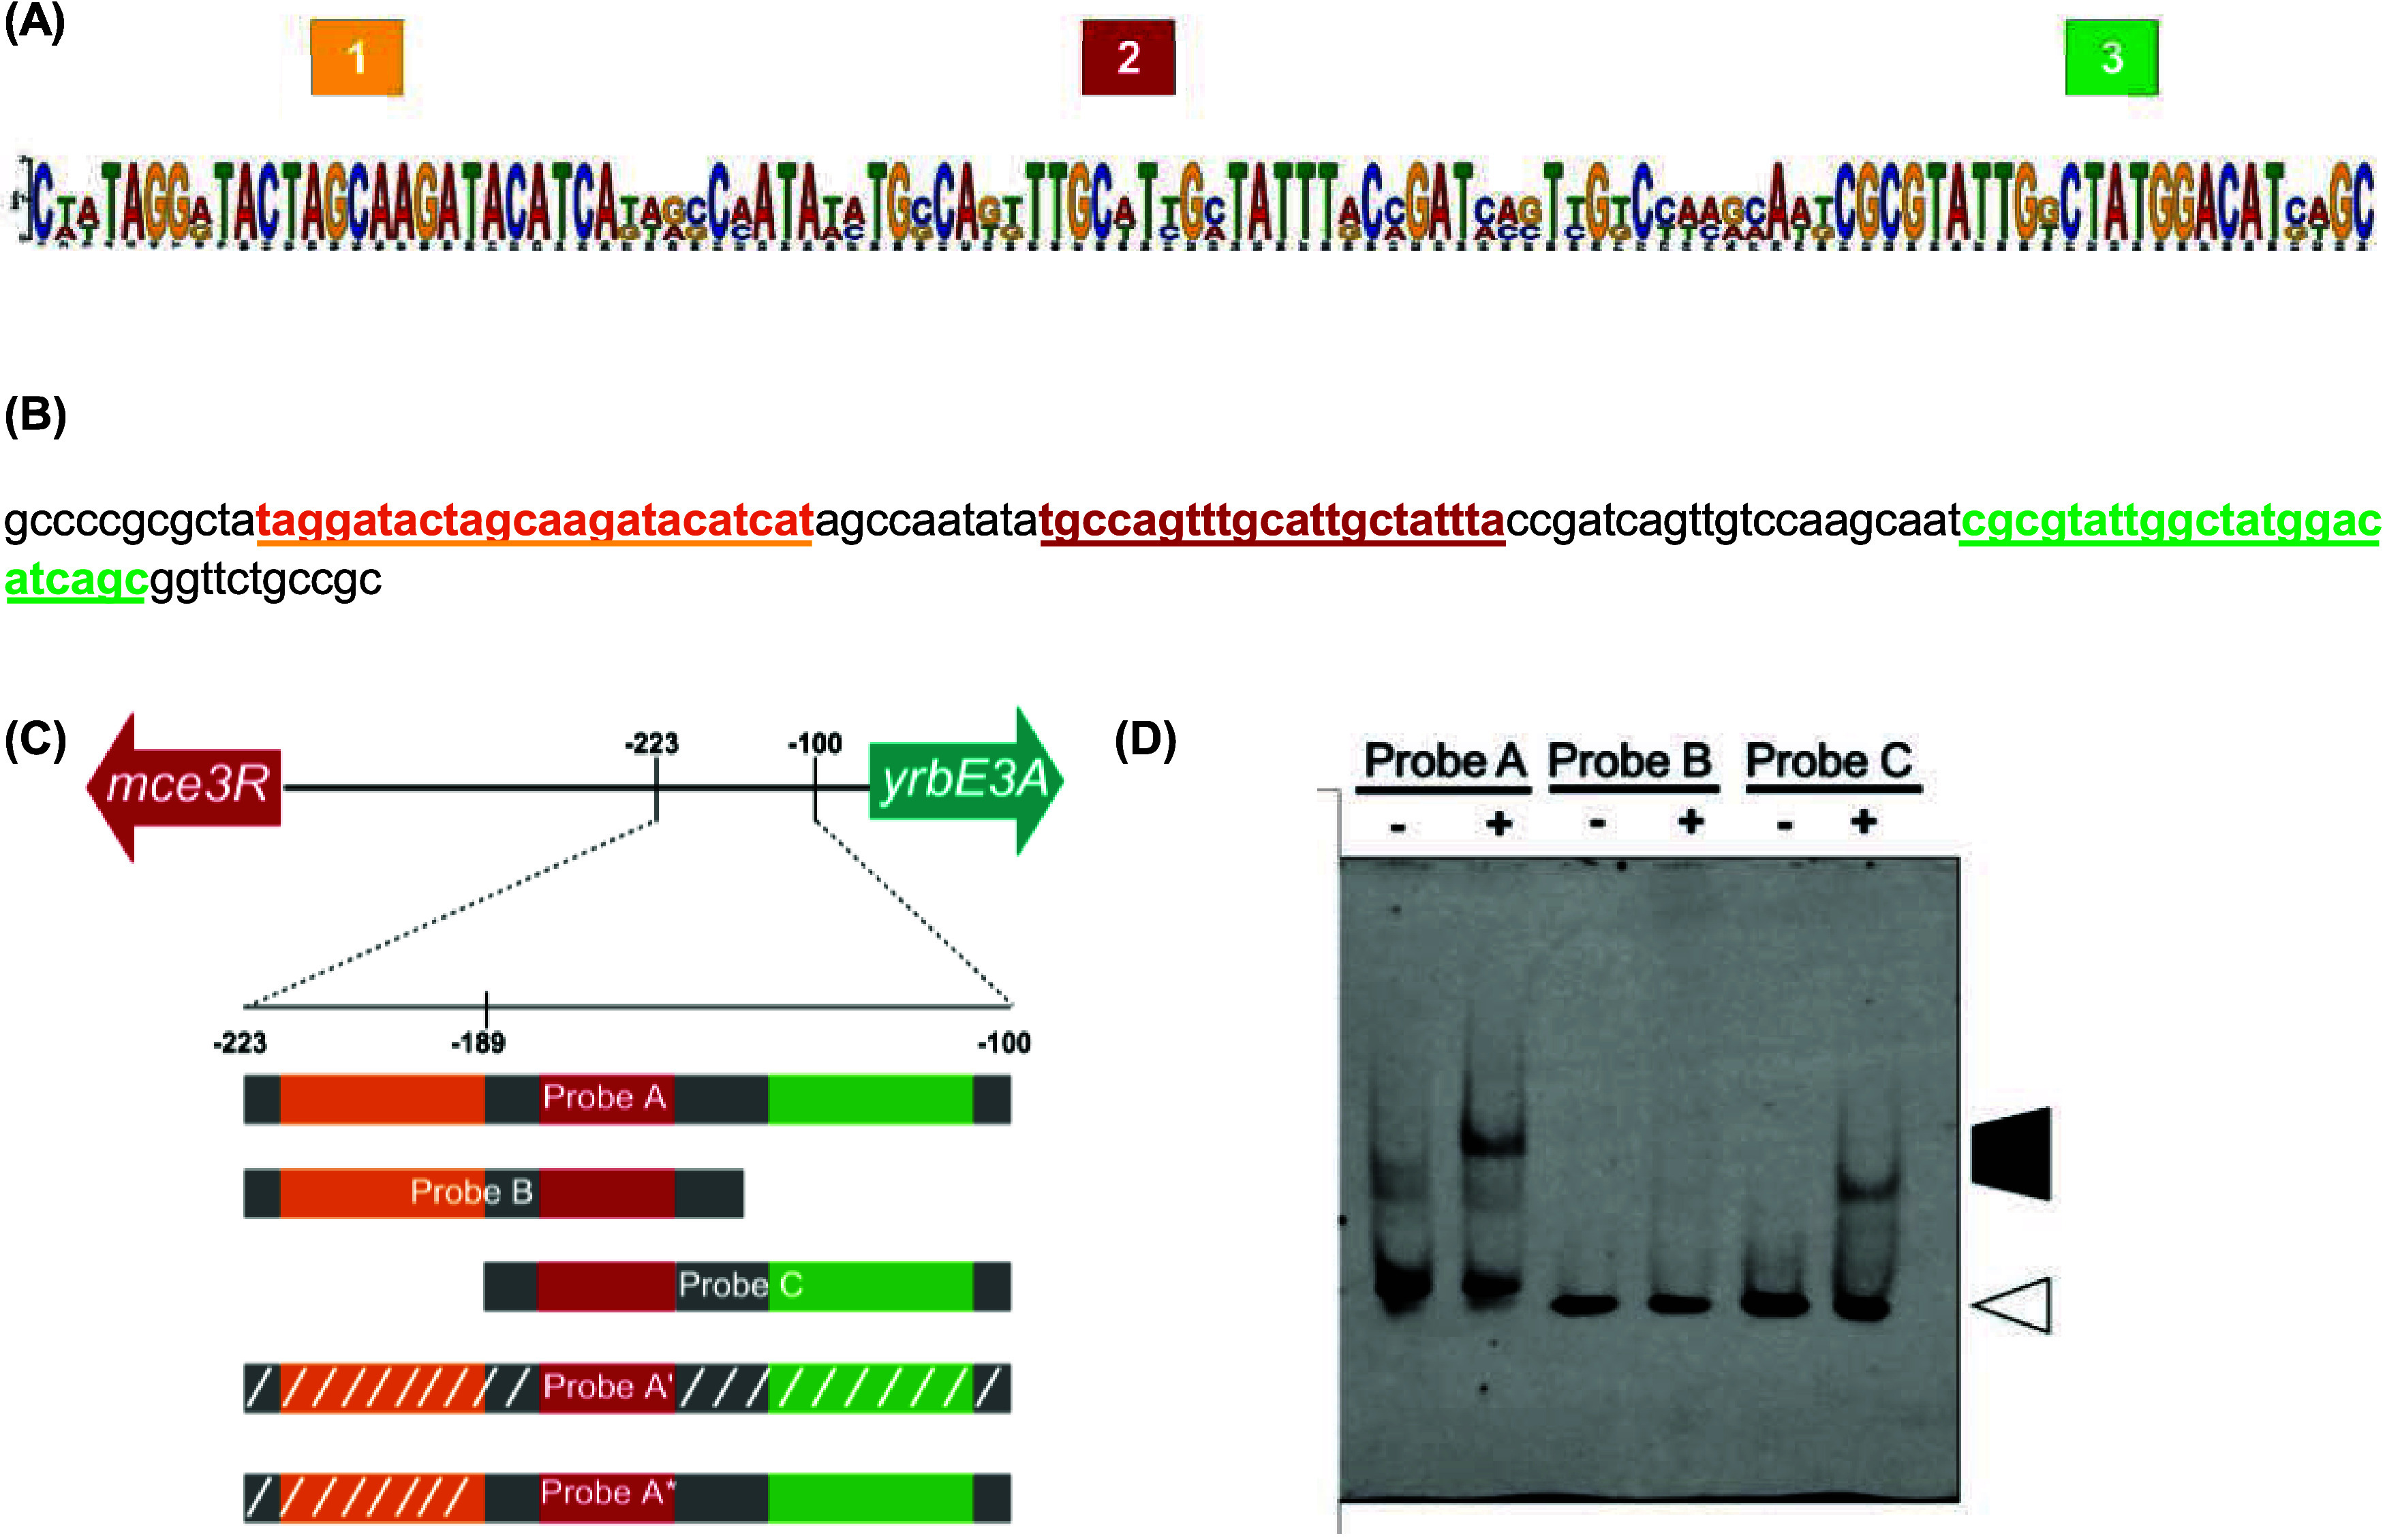
Mycobacterium tuberculosis (Mtb), the causative agent of tuberculosis, is a major global health concern. TetR family repressors (TFRs) are important for Mtb's adaptation to the human host environment. Our study focuses on one notable Mtb repressor, Mce3R, composed of an unusual double TFR motif. Mce3R-regulated genes encode enzymes implicated in cholesterol metabolism, resistance against reactive oxygen species, and lipid transport activities important for Mtb survival and persistence in the host and for the cellular activity of a 6-azasteroid derivative. Here, we present the structure of Mce3R bound to its DNA operator, unveiling a unique asymmetric assembly previously unreported. We obtained a candidate DNA-binding motif through MEME motif analysis, comparing intergenic regions of mce3R orthologues and identifying nonpalindromic regions conserved between orthologues. Using an electrophoretic mobility shift assay (EMSA), we confirmed that Mce3R binds to a 123-bp sequence that includes the predicted motif. Using scrambled DNA and DNA oligonucleotides of varying lengths with sequences from the upstream region of the yrbE3A (mce3) operon, we elucidated the operator region to be composed of two Mce3R binding sites, each a 25-bp asymmetric sequence separated by 53 bp. Mce3R binds with a higher affinity to the downstream site with a Kd of 2.4 ± 0.7 nM. The cryo-EM structure of Mce3R bound to the 123-bp sequence was refined to a resolution of 2.51 Å. Each Mce3R monomer comprises 21 α-helices (α1-α21) folded into an asymmetric TFR-like structure with a core asymmetric four-helix bundle. This complex has two nonidentical HTH motifs and a single ligand-binding domain. The two nonidentical HTHs from each TFR bind within the high-affinity, nonpalindromic operator motif, with Arg53 and Lys262 inserted into the major groove. Site-directed mutagenesis of Arg53 to alanine abrogated DNA binding, validating the Mce3R/DNA structure obtained. Among 811,645 particles, 63% were Mce3R homodimer bound to two duplex oligonucleotides. Mce3R homodimerizes primarily through α15, and each monomer binds to an identical site in the DNA duplex oligonucleotide.


Conflict of interest statement

The authors declare no competing financial interest.

Figures

Figure 1
Figure 1
Typical TFR tertiary structure compared to the Mce3R polypeptide sequence. (A) A typical TFR homodimer structure (TetR-family transcriptional regulator Rha06780 from Rhodococcus sp. Rha1, a figure created using PDB 2NX4 coordinates from the Protein Data Bank), in which each protomer is composed of nine α-helices. The ligand-binding domain (LBD, blue) is formed through a four-helix bundle with two helices contributed by each protomer. There are two helix-turn-helix (HTH, orange) motifs, one from each protomer. (B) The primary polypeptide structure of Mce3R illustrates the two TFR fragments: M1 (1–205 amino acids, blue) and M2 (206–406 amino acids, red). There are two HTH motifs (amino acids from 36–55, orange, and 240–259, orange-red) within this single polypeptide. (C) Possible asymmetric assembly of M1 and M2 monomer. (D) Possible symmetric assembly of M1 and M2 as a Mce3R homodimer. Upon binding to the substrate or inducer, the Mce3R will go from a repressed state to a derepressed state, which does not bind to DNA.
Figure 2
Figure 2
Sequence analysis of Mce3R. Schematic illustration of the Mce3R primary sequence, HTH motifs (yellow, amino acids 36–55 and 240–259). PHYRE2 threading used the M1 and M2 segments separately. Red lines indicate identical amino acids among the indicated proteins. Gray shading indicates no similarity among the indicated proteins. Percentages reported are percentages of amino acid identity. The multiple sequence alignment (MSA) analysis of Fad35R, Mce3R, and M1 or M2 revealed high identities in the DBDs compared to those in the LBDs. DBD amino acid identities: M1/Fad35R, 59%; M2/Fad35R, 48%; M1/KstR2, 33%; M2/KstR2, 33%. LBD amino acid identities: M1/Fad35R, 32%; M2/Fad35R, 18%; M1/KstR2, 15%; M2/KstR2, 21%.
Figure 3
Figure 3
yrbE3A (mce3) promoter region exhibits three motifs conserved among orthologues. (A) Sequence motifs identified using the MEME search tool. (B) Probe A sequence with regions 1, 2, and 3 underlined. Yellow, red, and green sequences correspond to regions 1, 2, and 3, respectively. (C) Schematic representations of duplex oligonucleotides synthesized for EMSA experiments. Probe A′ and A* contain scrambled sequences with the same percentage of A, G, C, and T as the corresponding native genomic Probe A sequence. The scrambled segments are indicated by hashing. (D) Fixed concentration EMSA experiments show that Mce3R binds to Probe A and Probe C. Mce3R (8 nM) and Cy3-Probe A, Probe B, or Probe C (10 nM) were analyzed on a 2.5% native polyacrylamide gel. Each binding assay contains 20 ng of polydI-dC. The dark trapezoid indicates the Mce3R-DNA complexes; the white arrow indicates free Cy3-DNA.
Figure 4
Figure 4
Mce3R-Probe A interaction is specific. (A) Specific and nonspecific competition of protein–DNA interactions. The formation of the retarded mobility complex observed with 8 nM Mce3R (Lane 2) is competitively inhibited upon the addition of a 200-fold excess of unlabeled Probe A, Probe B, or Probe C, but not by the addition of 0.5 or 1.0 μg of the nonspecific polydI-dC. (B) Mce3R does not make a complex with Probe A′ in the presence of 1 μg of polydI-dC. Mce3R concentrations ranged from 0 to 128.0 nM, whereas Cy3-Probe A′ was maintained at a constant concentration of 10 nM. The dark trapezoid indicates the Mce3R-DNA complexes, and the white arrow indicates the free Cy3-DNA-labeled DNA duplex.
Figure 5
Figure 5
EMSA determination of Mce3R affinity for selected oligonucleotides. (A) Mce3R with Probe A; (B) Mce3R with Probe B; (C) Mce3R with Probe C; and (D) Mce3R with Probe A*. (E) Mce3R was incubated with increasing concentrations of Cy3-labeled Probe A. The control lane contains 30 nM Mce3R and 10 nM Cy3-labeled Probe A. (F) EMSA analysis of M1 with Probe A. (G) EMSA analysis of the R53A_Mce3R mutant binding to Probe A. Each mixture was analyzed on a 2.5% native polyacrylamide gel. The dark trapezoid indicates the Mce3R-DNA complexes and the white arrow indicates the free Cy3-DNA-labeled DNA duplex. Cy3-labeled DNA (10 nM) was incubated with increasing concentrations of (A–D) Mce3R, (F) M1 (G) R53A_Mce3R variant (0–128.0 nM). (E) Mce3R (5 nM) was incubated with increasing concentrations of Cy3-labeled Probe A (0–18 nM). Representative gels are shown. Each experiment was performed in triplicate.
Figure 6
Figure 6
Cryo-EM Structure of Mce3R/Probe A Complex. (A) Mce3R/Probe A cryo-EM density map and the final Mce3R/Probe A model. (B) The Mce3R/Probe A complex displaying M1 and M2 in an asymmetric assembly, forming a homodimer. (C) A single Mce3R monomer oligonucleotide complex. The Mce3R monomer is bound to a 27-bp region of the Probe A DNA. (D) Helix cylinder representation of the Mce3R monomer. M1: helices 1–9, M2: helices 10–18. The distance shown is the span between the middle of the two HTHs.
Figure 7
Figure 7
Analysis of the DBD of the Mce3R/Probe A complex. (A) Insertion of the HTH motifs of Mce3R monomer in the 27-bp region of Probe A. Close-up view (B) of R53 in the major groove and (C) the corresponding electron density maps. (D) The nucleotides in the major groove that bind to the HTH motifs of Mce3R are shown in red.
Figure 8
Figure 8
Mce3R dimerization interface. (A) Mce3R dimerization interface comprised of α-helix-15 from each monomer. The buried surface between the two helices is shown. (B) A close-up view of the dimerization interface. Residues in stabilizing interactions are shown in ball and stick style.
Figure 9
Figure 9
Cartoon view of ligand-binding pocket. (A) Mce3R monomer with the two sides of the ligand-binding pocket highlighted in dark blue. (B) The M1 face of the binding pocket is composed of α5-α7. (C) The M2 face of the binding pocket is composed of α16-α18. Hydrophobic residues aligned in the binding cavity are shown.
Figure 10
Figure 10
Location of resistance mutations generated in mce3R upon treatment with 7-phenyl benzoxaboroles. (A) Location of W112 and C188 in the Mce3R monomer. (B) Close-up view of W112 and C188 located in α6 and α9 helices, respectively. H bonds and van der Waals interactions between (C) W112 and (D) C188 and residues within 3.5 and 4.5 Å, respectively. Mutated residues were reported by Korkegian et al.

Similar articles

References

    1. WHO . Global Tuberculosis Report 2023 2023www.who.inthttps://www.who.int/teams/global-tuberculosis-programme/tb-re.... (accessed July 4, 2024).
    1. Rohde K. H.; Veiga D. F. T.; Caldwell S.; Balázsi G.; Russell D. H. Linking the transcriptional profiles and the physiological states of Mycobacterium tuberculosis during an extended intracellular infection. PLoS Pathog. 2012, 8 (6), e100276910.1371/journal.ppat.1002769. - DOI - PMC - PubMed
    1. Balázsi G.; Heath A. P.; Shi L.; Gennaro M. L. The temporal response of the Mycobacterium tuberculosis gene regulatory network during growth arrest. Mol. Syst. Biol. 2008, 4 (1), 22510.1038/msb.2008.63. - DOI - PMC - PubMed
    1. Chauhan R.; Ravi J.; Datta P.; Chen T.; Schnappinger D.; Bassler K. E.; Balázsi G.; Gennaro M. L. Reconstruction and topological characterization of the sigma factor regulatory network of Mycobacterium tuberculosis. Nat. Commun. 2016, 7 (1), 1106210.1038/ncomms11062. - DOI - PMC - PubMed
    1. Anand S.; Singh V.; Singh A. K.; Mittal M.; Datt M.; Subramani B.; S K. Equilibrium binding and kinetic characterization of putative tetracycline repressor family transcription regulator Fad35R from Mycobacterium tuberculosis. FEBS J. 2012, 279 (17), 3214–3228. 10.1111/j.1742-4658.2012.08707.x. - DOI - PubMed

Publication types

MeSH terms

LinkOut - more resources