Randomized Controlled Trial
. 2025 Apr;19(4):1229-1243.
doi: 10.1002/1878-0261.13760. Epub 2024 Nov 15.

Gut microbiota diversity is prognostic and associated with benefit from chemo-immunotherapy in metastatic triple-negative breast cancer

Affiliations
Randomized Controlled Trial

Gut microbiota diversity is prognostic and associated with benefit from chemo-immunotherapy in metastatic triple-negative breast cancer

Andreas Ullern et al. Mol Oncol. 2025 Apr.

Abstract

The gut microbiota influences multiple aspects of human health and disease. Several studies have indicated an association between the gut microbiota and response to immune checkpoint inhibitors in various cancers, but there is scarce data from breast cancer. The randomized ALICE trial demonstrated improved progression-free survival (PFS) from adding the programmed cell death 1 ligand 1 (PD-L1) inhibitor atezolizumab (atezo) to immunomodulating chemotherapy (chemo) in metastatic triple-negative breast cancer (mTNBC), even for PD-L1negative disease. Herein, we investigated the microbiota composition and dynamics in the ALICE patients and their association with clinical outcome, by analyzing fecal samples collected at baseline and after 8 weeks. We applied 16S (V3-V4) rRNA sequencing to characterize the diversity and taxonomic composition. Kaplan-Meier and Cox proportional hazard models were used for time-to-event analyses. We found that high alpha diversity by Faith's phylogenetic diversity (PD) at baseline was associated with prolonged PFS in the total study population and in the atezo-chemo arm, but not in the placebo-chemo arm. Moreover, Faith's PD appeared to be predictive of benefit from atezolizumab. Patients with high Faith's PD exhibited a PFS hazard ratio of 0.34 (P = 0.018) in favor of the atezo-chemo arm, compared to 0.83 (P = 0.62) in the low Faith's PD group. Faith's PD was significantly reduced during treatment. At baseline, Bifidobacterium was significantly overrepresented in patients without clinical benefit in the atezo-chemo arm, but not in the placebo-chemo arm. These findings suggest that alpha diversity by Faith's PD should be further investigated as a prognostic and predictive biomarker in patients with mTNBC receiving chemo-immunotherapy.

Keywords: alpha diversity; biomarker; gut microbiota; immunotherapy; triple‐negative breast cancer.


Conflict of interest statement

J.A.K. has the last five years received research support from Bristol Myers Squibb, F. Hoffmann‐La Roche, NanoString and NEC OncoImmunity and has previously received advisory board/lecture honoraria from pharmaceutical companies, including Roche. JRH has received grants from Biogen and lecture honoraria from Amgen, Roche and Novartis. The other authors declare no conflicts of interest.

Figures

FIGURE 1
FIGURE 1
Patient enrollment and stool collection in the ALICE trial. Fecal samples were collected at baseline (before treatment initiation) and week 9 (after 8 weeks of treatment) in the placebo plus chemotherapy arm (placebo + chemo) and in the atezolizumab plus chemotherapy arm (atezo + chemo).
FIGURE 2
FIGURE 2
Progression‐free survival by baseline Faith's phylogenetic diversity. Kaplan–Meier plot in (A) all patients, (B) the atezo‐chemo and (C) the placebo‐chemo arm. Patients were classified into low and high diversity groups based on the median score of Faith's phylogenetic diversity. Hazard ratios and 95% confidence intervals were calculated using the Cox proportional hazards model. P values were calculated by the log‐rank method.
FIGURE 3
FIGURE 3
Progression‐free survival by baseline Faith's phylogenetic diversity‐optimized cut‐off. Kaplan–Meier plot in (A) all patients, (B) the atezo‐chemo and (C) the placebo‐chemo arm. Patients were classified into low and high diversity groups based on the optimized cut‐off score of Faith's phylogenetic diversity. Hazard ratios and 95% confidence intervals were calculated using the Cox proportional hazards model. P values were calculated by the log‐rank method.
FIGURE 4
FIGURE 4
Kaplan–Meier plots of progression‐free survival by treatment arm in low and high diversity patients. Kaplan–Meier plots of progression‐free survival in the atezo‐chemo arm compared to the placebo‐chemo arm in (A) patients with high Faith's phylogenetic diversity and (B) patients with low Faith's phylogenetic diversity. Patients were classified into low and high diversity groups based on the optimized cut‐off of Faith's phylogenetic diversity. Hazard ratios and 95% confidence intervals were calculated using the Cox proportional hazards model. P values were calculated by the log‐rank method.
FIGURE 5
FIGURE 5
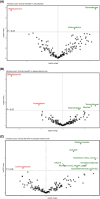
Differential abundance analysis (using ANCOM‐BC2) according to clinical benefit. Volcano plot on (A) all patients, (B) the atezo‐chemo and (C) the placebo‐chemo arm. The plot visualizes differentially abundant bacterial genera in patients with and without clinical benefit. X‐axis represents effect size and y‐axis represents P values. Taxa with P value <0.05 are presented above the horizontal dashed line. Taxa enriched in patients with clinical benefit are colored in green and taxa enriched in patients without clinical benefit are colored in red. The vertical dashed line illustrates log fold change of zero.
FIGURE 6
FIGURE 6
Immune‐related adverse events. (A) Alpha diversity by Faith's phylogenetic diversity in patients with and without immune‐related adverse events (irAEs) of any grade. P value calculated by Wilcoxon rank sum test. The box plot extends from the first to the third quartile. The middlle line represents the median and the whiskers to the most extreme point within 1.5 × IQR. (B) Volcano plot based on ANCOM‐BC2. The plot visualizes differentially abundant bacterial genera in patients with and without irAEs (any grade) in the atezo‐chemo arm. X‐axis represents effect size and y‐axis represents P values. Taxa with P value <0.05 are presented above the horizontal dashed line. Taxa enriched in patients with irAEs are colored in green and taxa enriched in patients without irAEs are colored in red. The vertical dashed line illustrates log fold change of zero. No taxa were statistically significant after correction for multiple testing in ANCOM‐BC2.
FIGURE 7
FIGURE 7
Alpha diversity during treatment in the two arms. Paired samples from patients that provided samples at baseline and week 9 demonstrated that alpha diversity decreased during treatment, both in the atezo‐chemo arm (left) and in the placebo‐chemo arm (right). P values were calculated using Wilcoxon signed‐rank test. The red point represents the mean alpha diveristy at each timepoint and the errorbars represent the standard error of the mean. The red line represents the change of the mean alpha diversity value from baseline to week 9.

References

    1. Fernandes MR, Aggarwal P, Costa RGF, Cole AM, Trinchieri G. Targeting the gut microbiota for cancer therapy. Nat Rev Cancer. 2022;22:703–722. 10.1038/s41568-022-00513-x - DOI - PubMed
    1. Lee KA, Thomas AM, Bolte LA, Björk JR, de Ruijter LK, Armanini F, et al. Cross‐cohort gut microbiome associations with immune checkpoint inhibitor response in advanced melanoma. Nat Med. 2022;28:535–544. 10.1038/s41591-022-01695-5 - DOI - PMC - PubMed
    1. McCulloch JA, Davar D, Rodrigues RR, Badger JH, Fang JR, Cole AM, et al. Intestinal microbiota signatures of clinical response and immune‐related adverse events in melanoma patients treated with anti‐PD‐1. Nat Med. 2022;28:545–556. 10.1038/s41591-022-01698-2 - DOI - PMC - PubMed
    1. Routy B, Le Chatelier E, Derosa L, Duong CPM, Alou MT, Daillere R, et al. Gut microbiome influences efficacy of PD‐1‐based immunotherapy against epithelial tumors. Science. 2018;359:91–97. 10.1126/science.aan3706 - DOI - PubMed
    1. Thomas AM, Fidelle M, Routy B, Kroemer G, Wargo JA, Segata N, et al. Gut OncoMicrobiome signatures (GOMS) as next‐generation biomarkers for cancer immunotherapy. Nat Rev Clin Oncol. 2023;20:583–603. 10.1038/s41571-023-00785-8 - DOI - PMC - PubMed

Publication types

MeSH terms

Substances