. 2024 Dec 2;221(12):e20240959.
doi: 10.1084/jem.20240959. Epub 2024 Nov 15.

MCRS1 sensitizes T cell-dependent immunotherapy by augmenting MHC-I expression in solid tumors

Affiliations

MCRS1 sensitizes T cell-dependent immunotherapy by augmenting MHC-I expression in solid tumors

Xue Li et al. J Exp Med. .

Abstract

Dampened antigen presentation underscores the resistance of pancreatic cancer to T cell-mediated anti-tumor immunity, rendering immunotherapy largely ineffective. By high-throughput CRISPR activation perturbation, we discovered that the transcriptional regulator MCRS1 significantly augmented the sensitivity of mouse pancreatic cancer cells to T cell immunity in vitro and in vivo. Mechanistically, MCRS1 interacted with the transcription factor and genome organizer YY1 to coordinately increase the chromatin accessibility and expression of MHC-I genes. Elevated MCRS1 subverted MHC-I suppression and activated anti-tumor T cells, which sensitized mouse pancreatic cancer to α-PD-1 therapy. Remarkably, high MCRS1 expression was associated with increased T cell infiltration and extended survival of patients with pancreatic cancer and was predictive of favorable responses to α-PD-1 therapy in patients with lung cancer. Together, our study uncovers that MCRS1 sensitizes cancer cells to T cell immunity by transcriptionally subverting MHC-I suppression, which enhances the effectiveness of α-PD-1 therapy in mice and humans, paving the way to further improve immunotherapy against solid tumors.


Conflict of interest statement

Disclosures: The authors declare no competing interests exist.

Figures
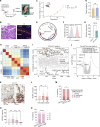
Figure S1.
Figure S1.
CRISPRa screening identifies Mcrs1 as a candidate immune-sensitizing factor. (A) Orthotopic tumor formation by implanting HT cells into the mouse pancreas. Arrows point to the tumor and normal tissues (N = 2 independent experiments). Scale bar = 1 cm. Illustration was created with https://BioRender.com with modifications. (B) Orthotopic HT tumors exhibiting clinical features, assessed by H&E staining and immunofluorescence (IF) staining of αSMA (red, stroma) and CD8α (green, T cells) (n = 6 for both groups). Scale bar in the left panel = 100 μm, scale bar in the right panel = 50 μm. (C) Tumor growth of HT cells subcutaneously inoculated in Tcrb−/− Tcrd−/− mice, with WT mice obtained from SLAC as control (n = 7, 6 for WT and Tcrb−/− Tcrd−/− mice, respectively; presented as means ± SEM; ns, not significant, P ≥ 0.05; two-way ANOVA; N = 2 independent experiments). Illustration was created with https://BioRender.com. (D) Tumor weights in WT and Tcrb−/− Tcrd−/− mice at the point of sacrifice (n = 7, 6 for WT and Tcrb−/− Tcrd−/− mice, respectively; presented as means ± SEM; ns, not significant, P ≥ 0.05; two-tailed unpaired t test; N = 2 independent experiments). (E) Vector design to express dCas9-VPR in the HT cell line, which allows bicistronic expression of dCas9-VPR and iRFP via an Internal Ribosome Entry Site element. Illustration was created with SnapGene. (F) Flow cytometry analysis of iRFP expression in HTdCas9VPR cells (N = 2 independent experiments). (G) CRISPRa activation of Leptin expression by Leptin-targeting sgRNAs in HTdCas9VPR cells (n = 3 for both groups; presented as means ± SEM; *, P < 0.05; two-tailed unpaired t test; N = 2 independent experiments). (H) Correlation of sgRNA profiles in the input, mock, and T cell–killing samples of CRISPRa screening (n = 3 for all groups). (I) MAGeCK analysis of CRISPRa screening. (J) ScreenProcessing analysis of CRISPRa screening. (K) Representative immunohistochemistry images showing high and low expression of MCRS1 (brown) in clinical samples of human PDAC patients (n = 350, 354 for MCRS1-low and MCRS1-high groups, respectively). Scale bar in the left panel = 100 μm, scale bar for the right panel = 10 μm. (L) Expression of MCRS1 in PDAC samples of different histological grades determined by IHC (n = 7, 496, 201 for Grade I, Grade II, and Grade III, respectively; presented as means ± SD; ns, not significant, P ≥ 0.05; *, P < 0.05; two-tailed unpaired t test). (M) Histological grades of PDAC patients with high and low MCRS1 levels (n = 350, 354 for MCRS1-low and MCRS1-high groups, respectively; *, P < 0.05; Chi-square test). (N) Expression of MCRS1 in PDAC samples of different T stages (n = 105, 402, 194, 40 for T1, T2, T3, and T4, respectively; presented as means ± SD; ns, not significant, P ≥ 0.05; ****, P < 0.0001; two-tailed unpaired t test). (O) T stages of PDAC patients with high and low MCRS1 levels (n = 350, 354 for MCRS1-low and MCRS1-high groups, respectively; ****, P < 0.0001; Chi-square test).
Figure 1.
Figure 1.
Focused CRISPRa screening identifies Mcrs1 as a potential immune-sensitizing factor. (A) Screening strategy. The mouse pancreatic cancer cell line HT was transduced with a CRISPRa library, followed by hgp100 antigen loading and incubation with Pmel-1 CD8+ effector T cells. sgRNAs in surviving cells after three rounds of T cell killing were profiled by deep sequencing (n = 3 biological replicates for all groups). Illustration was created with https://BioRender.com with modifications. (B) Overlapping genes identified by MAGeCK and ScreenProcessing analysis. (C) Log2 fold changes of sgRNAs for candidate genes between the killing condition and the mock condition. (D) Correlation between the expression of candidate genes and a predefined T cell activation signature in patient tumor samples from The Cancer Genome Atlas (TCGA). ACC, adrenocortical carcinoma; BLCA, bladder urothelial carcinoma; BRCA, breast invasive carcinoma; CESC, cervical squamous cell carcinoma and endocervical adenocarcinoma; CHOL, cholangio carcinoma; COAD, colon adenocarcinoma; DLBC, lymphoid neoplasm diffuse large b-cell lymphoma; ESCA, esophageal carcinoma; GBM, glioblastoma multiforme; HNSC, head and neck squamous cell carcinoma; KICH, kidney chromophobe; KIRC, kidney renal clear cell carcinoma; KIRP, kidney renal papillary cell carcinoma; LAML, acute myeloid leukemia; LGG, brain lower grade glioma; LIHC, liver hepatocellular carcinoma; LUAD, lung adenocarcinoma; LUSC, lung squamous cell carcinoma; MESO, mesothelioma; OV, ovarian serous cystadenocarcinoma; PAAD, pancreatic adenocarcinoma; PCPG, pheochromocytoma and paraganglioma; PRAD, prostate adenocarcinoma; READ, rectum adenocarcinoma; SARC, sarcoma; SKCM, skin cutaneous melanoma; STAD, stomach adenocarcinoma; TGCT, testicular germ cell tumors; THCA, thyroid carcinoma; THYM, thymoma; UCEC, uterine corpus endometrial carcinoma; UCS, uterine carcinosarcoma; UVM,uveal melanoma. (E) Representative images of immunofluorescence staining of MCRS1 (magenta) in human PDAC samples, together with DAPI (blue, DNA), CK8/18 (cyan, tumor), and CD8α (green, T cell). MCRS1 expression in PDAC cells was quantified and shown in the HALO tuning image (n = 5 for both groups). Scale bar = 100 μm. (F) CD8α+ T cell densities and frequencies in human PDAC samples (n = 142, 121 for the MCRS1-low and MCRS1-high groups, respectively; presented as means ± SDs; ***, P < 0.001; two-tailed unpaired t test). (G) The shortest distances between CD8α+ T cells and tumor cells in PDAC samples determined with HALO software. Left, representative image for analysis, scale bar = 50 μm. Right, the spatial distribution of CD8α+ T cells plotted for PDAC samples with high and low MCRS1 levels (n = 142, 121 for the MCRS1-low and MCRS1-high groups, respectively; ns, not significant, P ≥ 0.05; *, P < 0.05; **, P < 0.01; two-tailed unpaired t test). (H) Overall survival of PDAC patients with high and low MCRS1 levels (n = 350, 354 for the MCRS1-low and MCRS1-high groups, respectively; Kaplan–Meier test). (I) Progression-free survival of PDAC patients with high and low MCRS1 levels (n = 350, 354 for the MCRS1-low and MCRS1-high groups, respectively; Kaplan–Meier test).
Figure S2.
Figure S2.
Mcrs1 activates T cell–mediated anti-tumor immunity in vivo. (A) Expression of MCRS1 in the MCRS1-low and MCRS1-high groups of PAAD patients in TCGA (n = 151, 30 for the MCRS1-low and MCRS1-high groups, respectively; center line, median; box limits, upper and lower quartiles; whiskers, Tukey; points, outliers; ****, P < 0.0001; two-tailed unpaired test). (B) Increased Mcrs1 expression in HT cells by lentiviral transduction of the Mcrs1 ORF (n = 3 for both groups; presented as means ± SEM; ****, P < 0.0001; two-tailed unpaired t test; N = 3 independent experiments). (C) Elevated MCRS1 protein levels in Mcrs1-overexpressing (Mcrs1OX) cells (N = 3 independent experiments). (D) The proliferation of Mcrs1OX and vector control cells in vitro, measured with the CCK-8 assay (n = 3 for both groups; presented as means ± SEM; ns, not significant, P ≥ 0.05; two-way ANOVA; N = 2 independent experiments). (E) Cell cycle analysis of Mcrs1OX and vector control cells by flow cytometry, with representative histograms (left panel) and quantification (right panel) shown (n = 4 for both groups; presented as means ± SEM; ns, not significant, P ≥ 0.05; two-way ANOVA; N = 2 independent experiments). (F) Growth curve of subcutaneous Pcdh1OX and vector control tumors in WT mice (n = 5, 6 for control and Pcdh1OX, respectively; presented as means ± SEM; ns, not significant, P ≥ 0.05; two-way ANOVA; N = 2 independent experiments). (G) Spider plots showing tumor growth in individual mice as in F (N = 2 independent experiments). (H) Volcano plot showing differential gene expression between Mcrs1OX and vector control tumors (n = 4 for both groups). (I) Fractions of different immune cell populations in Mcrs1OX and vector control tumors estimated by CIBERSORTx. (J) Comparison of CIBERSORTx-estimated immune cell populations in Mcrs1OX and vector control tumors (n = 4 for both groups; presented as means ± SEM; *, P < 0.05; ***, P < 0.001; two-tailed unpaired t test). (K) The gating strategy for T cell analysis in subcutaneous tumors. (L) Flow cytometry analysis of CD4+ T cells in Mcrs1OX or vector control tumors (n = 4, 5 for vector control and Mcrs1OX, respectively; presented as means ± SEM; **, P < 0.01; two-tailed unpaired t test; N > 3 independent experiments). Source data are available for this figure: SourceData FS2.
Figure 2.
Figure 2.
Mcrs1 suppresses mouse pancreatic cancer growth in a T cell–dependent manner. (A) In vitro cytotoxicity assays for the mixed culture of vector control and Mcrs1OX cells. Mcrs1OX or vector control cells were differentially labeled with the CellTrace Violet dye and loaded with antigen peptides, followed by incubation with CD8+ effector T cells with cognate TCRs at different effector:target ratios. The ratio between live Mcrs1OX and vector control cells (7-AAD) after T cell killing was quantified by flow cytometry (n = 4, 5 for Pmel-1 and OT-I assays, respectively; presented as means ± SEM; ****, P < 0.0001; one-way ANOVA with Dunnett’s multiple comparisons test; N = 2 independent experiments). (B) In vitro cytotoxicity assays for vector control and Mcrs1OX cells cultured separately. Mcrs1OX or vector control cells were loaded with the antigen peptides and separately incubated with CD8+ effector T cells with cognate TCRs at different effector:target ratios. Live cells were determined by flow cytometry (7-AAD), quantified with CountBright beads, and normalized against the cancer cell-only group (effector:target = 0:1) (n = 3, 5 for Pmel-1 and OT-I assays, respectively; presented as means ± SEM; **, P < 0.01; ****, P < 0.0001; two-way ANOVA; N = 2 independent experiments). (C) IFN-γ concentrations in the supernatant of the in vitro cytotoxicity assays as described in B with an effector:target ratio of 0.25:1. (n = 3, 4 for Pmel-1 and OT-I assays, respectively; presented as means ± SEM; *, P < 0.05; **, P < 0.01; two-tailed unpaired t test; N = 2 independent experiments). (D) Growth of orthotopic tumors in WT mice by injecting Mcrs1OX and vector control cells into the pancreas. Shown are representative tumor images with arrowheads indicating tumor masses, H&E staining images, and quantification of tumor areas; scale bars = 5 mm (n = 8, 5 for vector control and Mcrs1OX, respectively; presented as means ± SEM; ****, P < 0.0001; two-tailed unpaired t test; N = 3 independent experiments). Illustration was created with https://BioRender.com. (E) The growth curve of subcutaneous Mcrs1OX and vector control tumors in WT mice (n = 11, 13 for vector control and Mcrs1OX, respectively; presented as means ± SEM; *, P < 0.05; ***, P < 0.001; ****, P < 0.0001; two-way ANOVA with Sidak’s multiple comparisons test; N > 3 independent experiments). Illustration was created with https://BioRender.com. (F) Spider plots showing the growth of individual Mcrs1OX and vector control tumors in WT mice as in E. (G) Tumor weights at the point of sacrifice with a representative image of the tumor masses; scale bar = 1 cm (n = 4, 5 for vector control and Mcrs1OX, respectively; presented as means ± SEM; ****, P < 0.0001; two-tailed unpaired t test; N > 3 independent experiments). (H) Flow cytometry analysis of CD8+ T cell frequencies in subcutaneous Mcrs1OX or vector control tumors (n = 4, 5 for vector control and Mcrs1OX, respectively; presented as means ± SEM; ***, P < 0.001; two-tailed unpaired t test; N > 3 independent experiments). (I) The growth curve of subcutaneous Mcrs1OX and vector control tumors in T cell–deficient Tcrb−/−;Tcrd−/− mice with WT mice obtained from SLAC as control (n = 6 for both groups; presented as means ± SEM; ns, not significant, P ≥ 0.05; two-way ANOVA, N = 2 independent experiments). Illustration was created with https://BioRender.com. (J) Spider plots showing the growth of individual subcutaneous Mcrs1OX and vector control tumors in Tcrb−/−;Tcrd−/− mice as in I.
Figure 3.
Figure 3.
Elevated Mcrs1 expression activates T cell–mediated anti-tumor immunity in vivo. (A) TILs (CD45+ CD90.2+) were isolated from subcutaneous Mcrs1OX and vector control tumors, multiplexed with hashtags, and subjected to scRNA-seq and scTCR-seq analysis. The UMAP embedding of various cell clusters is shown (samples were pooled from n = 3 mice for each group). NGS, next-generation sequencing. Illustration was created with https://BioRender.com with modifications. (B) Comparison of cell percentages of different cell clusters between Mcrs1OX or vector control tumors. Upward arrows indicate increases in the cell clusters. TRM, tissue-resident memory T cell; TReg, regulatory T cell; TMem, memory T cell. (C) Distribution of CD8+ T cells along the pseudotime trajectory. (D) Scatter plots showing the projected pseudo time (states) of CD8+ T cells in individual clusters (upper panel). The enrichment of effector CD8+ T cells in Mcrs1OX tumors is shown in the lower panel. (E) Frequencies of CD8+ effector T cells (TEff) in Mcrs1OX and vector control tumors assessed by IFN-γ expression, with representative flow plots (upper panel) and quantification (lower panel) shown (n = 4, 5 for vector control and Mcrs1OX, respectively; presented as means ± SEM; ***, P < 0.001; two-tailed unpaired t test; N > 3 independent experiments). (F) Frequencies of CD8+ TEff in Mcrs1OX and vector control tumors assessed by KLRG1 and CD127 expression, with representative flow plots (upper panel) and quantification (lower panel) shown (n = 8, 7 for vector control and Mcrs1OX, respectively; presented as means ± SEM; ns, not significant, P ≥ 0.05; **, P < 0.01; two-tailed unpaired t test; N > 3 independent experiments). (G) Fractions of CD8+ T cells showing clonal expansion (detected in >1 cell) in Mcrs1OX and vector control tumors revealed by scTCR-seq. The Gini Index of TCR clonotypes is calculated to reflect the extent of clonal expansion (unevenness of clonotype distribution). (H) Distribution of clonally expanded CD8+ T cells along the projected pseudo-time, showing CD8+ T cells expanding into the effector state in Mcrs1OX tumors.
Figure S3.
Figure S3.
scRNA-seq analysis of T cells in Mcrs1OX and vector control tumors. (A) UMAP embedding of all cell clusters captured by scRNA-seq analysis (n = 3 pooled for both groups). (B) Marker gene expression of different clusters of tumor-infiltrating lymphocytes. (C) Pseudo-bulk analysis of CD8+ and CD4+ T cells in Mcrs1OX and vector control tumors, showing upregulation of activation markers in both subsets. (D) Flow cytometry analysis of IFN-γ+ effector CD4+ T cells in Mcrs1OX and vector control tumors (n = 4, 5 for vector control and Mcrs1OX, respectively; presented as means ± SEM; ***, P < 0.001; two-tailed unpaired t test; N > 3 independent experiments).
Figure 4.
Figure 4.
Mcrs1 enhances MHC-I–mediated antigen presentation by binding to MHC-I loci. (A) RNA-seq analysis of differentially expressed genes between Mcrs1OX and vector control cells in vitro (x-axis, cell culture, n = 3 for each group) and in vivo (y-axis, tumor, n = 4 for each group). (B) GSEA analysis of pathways commonly regulated by Mcrs1 in vitro and in vivo. IRF, interferon regulatory factors; L1, L1-type cell adhesion molecules. (C) The growth curve of Mcrs1OX and vector control tumors in Ifnar1−/− mice (n = 7 for both groups; presented as means ± SEM; ***, P < 0.001; two-way ANOVA; N = 2 independent experiments). Illustration was created with https://BioRender.com. (D) Tumor suppression by Mcrs1 in WT (SLAC) and Ifnar1−/− mice, calculated as the volume reduction of Mcrs1OX tumors compared to vector control tumors as a fraction of control tumor volumes (n = 12, 7 for WT and Ifnar1−/−, respectively; presented as means ± SEM; ns, not significant, P ≥ 0.05; two-tailed unpaired t test; N = 2 independent experiments). (E) Representative histograms showing surface staining of MHC-I in Mcrs1OX and vector control cells (N > 3 independent experiments). (F) Summary of the MHC-I+ frequency and mean fluorescence intensity (MFI) of MHC-I in Mcrs1OX and vector control cells (n = 3 for both groups; presented as means ± SEM; ****, P < 0.0001; two-tailed unpaired t test; N > 3 independent experiments). (G) Expression of MHC-I genes (H2-K1, H2-D1, H2-Q4) in Mcrs1 knockout cells (sgMcrs1) (n = 4 for both groups; presented as means ± SEM; **, P < 0.01; ***, P < 0.001; two-tailed unpaired t test; N > 3 independent experiments). (H) Expression of MHC-I genes (H2-K1, H2-D1, H2-Q4) in Mcrs1OX cells when IFN-α/β and IFN-γ signaling were blocked by blocking antibodies against IFNAR1 and IFN-γ. Known ISGs, Isg15 and Oas2, were used as controls (n = 4, 3, 4, 4 for control, Mcrs1OX, α-IFNAR1, and α-IFN-γ, respectively; presented as means ± SEM; ns, not significant, P ≥ 0.05; *, P < 0.05; **, P < 0.01; ***, P < 0.001; ****, P < 0.0001; one-way ANOVA with Tukey’s multiple comparisons test; N = 2 independent experiments). (I) MCRS1 binding sites in the genome were profiled by ChIP-seq. MCRS1 binding intensities in expressed and non-expressed genes are plotted according to the distances to the transcription start sites (TSS) and transcription end site (TES) (n = 2 for both groups; N = 2 independent experiments). Illustration was created with https://BioRender.com. (J) Enrichment of MHC-I antigen presentation pathways in MCRS1-target genes revealed by GSEA analysis. (K) Representative genomic alignment of MCRS1 ChIP-seq and RNA-seq at the H2-K1, H2-D1, and H2-Q4 loci. (L) Presentation of the model antigen OVA by Mcrs1OX and vector control cells. Cells were transduced with OVA-encoding (OVAL) retrovirus, and the mRNA expression of OVAL and surface presentation of processed OVA antigen complexed with MHC-I were examined by qPCR and flow cytometry with the 25-D1.16 monoclonal antibody, respectively (n = 3 for all groups; presented as means ± SEM; ns, not significant, P ≥ 0.05; *, P < 0.05; two-tailed unpaired t test; N = 2 independent experiments). Illustration was created with https://BioRender.com with modifications. (M) T cell activation by presented OVA antigen in Mcrs1OX and vector control cells. OVA-expressing Mcrs1OX and vector control cells were incubated with CellTrace Violet (CTV) dye-loaded OT-I T cells. Antigen (OVA)-stimulated activation and proliferation of OT-I T cells were monitored by CTV dilution. Representative histograms of CTV dilution (left panel) and the calculated proliferation index are shown (n = 3 for all groups; presented as means ± SEM; *, P <0.05; two-tailed unpaired t test; N > 3 independent experiments). Illustration was created with https://BioRender.com with modifications.
Figure S4.
Figure S4.
MCRS1 regulates MHC-I expression by directly binding to the promoters. (A) Expression of interferons in Mcrs1OX and vector control cells (n = 4 for both groups; ns, not significant, P ≥ 0.05; ***, P < 0.001; two-tailed unpaired t test; N = 2 independent experiments). (B) Mcrs1 knockout confirmed by western blotting, representative images shown (N = 3 independent experiments). (C) Nlrc5 expression in Mcrs1OX and vector control cells determined by RNA-seq (n = 3 for both groups; presented as means ± SEM; *, P < 0.05; two-tailed unpaired t test). (D) Expression of ISGs and MHC-I genes in Mcrs1OX cells in the presence of a JAK inhibitor (n = 4 for all groups; presented as means ± SEM; **, P < 0.01; ****, P < 0.0001; one-way ANOVA with Tukey’s multiple comparisons test; N = 2 independent experiments). (E) Distribution of MCRS1 ChIP peaks across the genome. (F) Overlapping of MCRS1-bound and expressed genes in HT cells. (G) The cumulative distribution function (CDF) plot of absolute expression changes of MCRS1-bound and -unbound genes in Mcrs1OX and vector control cells. (H) Percentages of differentially expressed genes (DEG) in MCRS1-bound and -unbound genes. (I) Pathview analysis of differential expression of MCRS1-bound genes in the antigen presentation pathway in control and Mcrs1OX cells. (J) MCRS1 binding at the human MHC-I loci (HLA-A/B/C) in HepG2 cells (Runge et al., 2018). Source data are available for this figure: SourceData FS4.
Figure 5.
Figure 5.
MCRS1 upregulates MHC-I by interacting with YY1. (A) Identification of MCRS1-interacting proteins in mouse pancreatic cancer cells by IP-MS, with top hits shown (n = 1 for both groups). (B) STRING analysis of MCRS1-interacting proteins, with interaction detected between MCRS1 and YY1 and KAT8. (C) Expression of ISGs and MHC-I genes in Mcrs1OX cells that were deficient in Yy1 or Kat8 by CRISPR-mediated gene knockout (n = 4, 3, 4, 4 for control, Mcrs1OX, Mcrs1OX;sgYy1, and Mcrs1OX;sgKat8, respectively; presented as means ± SEM; ns, not significant, P ≥ 0.05; *, P < 0.05; **, P < 0.01; ***, P < 0.001; ****, P < 0.0001; one-way ANOVA with Tukey’s multiple comparisons test; N = 2 independent experiments). (D) Increased MCRS1–YY1 interaction in Mcrs1OX cells assessed by immunoprecipitation (N > 3 independent experiments). (E) De novo motif discovery of MCRS1-bound genomic regions, with the YY1 binding motif among the top enriched motifs. (F) Expression of ISGs and MHC-I genes in Yy1OX cells (n = 3 for both groups; presented as means ± SEM; *, P < 0.05; **, P < 0.01; ****, P < 0.0001; two-tailed unpaired t test; N = 2 independent experiments). Source data are available for this figure: SourceData F5.
Figure S5.
Figure S5.
MCRS1 regulates MHC-I through YY1. (A) YY1 protein levels in control, Mcrs1OX, and Mcrs1OX;sgYy1 tumors (N = 2 independent experiments). (B) Overexpression of Yy1 was confirmed at the mRNA and protein levels (n = 3 for both groups in qPCR; presented as means ± SEM; **, P < 0.01; two-tailed unpaired t test; N = 2 independent experiments). (C) Representative images of immunofluorescence staining of DAPI (blue, DNA), MCRS1 (magenta), YY1 (green), and CD8α (orange, T cell) in human PDAC samples. Scale bars = 100 μm. (D) Binding of MCRS1 and YY1 at the human MHC-I loci (HLA-A/B/C) in HepG2 cells. (E) Correlation between the changes of ATAC-seq signals and the changes of gene expression in control and Mcrs1OX cells. FC, fold change. (F) Integrative analysis of ATAC-seq profiles of vector;sgCtrl, Mcrs1OX;sgCtrl, and Mcrs1OX;sgYy1 cells, compared to the tumor development trajectory defined by ATAC-seq profiles of mouse primary pancreatic cancer at different tumorigenesis stages (Burdziak et al., 2023). (G) Total and effector CD4+ T cells in vector;sgCtrl, Mcrs1OX;sgCtrl, and Mcrs1OX;sgYy1 tumors (n = 8, 8, 7; presented as means ± SEM; ns, not significant, P ≥ 0.05; **, P < 0.01; ****, P < 0.0001; one-way ANOVA with Tukey’s multiple comparisons test; N = 3 independent experiments). Source data are available for this figure: SourceData FS5.
Figure 6.
Figure 6.
MCRS1 and YY1 coordinately regulate chromatin accessibility and immune sensitivity. (A) Metaplot and heatmap showing ATAC-seq signals around the TSS in control, Mcrs1OX, and Mcrs1OX;sgYy1 cells (n = 2 for both groups). (B) ATAC-seq profiles of genes that were bound by MCRS1 and differentially expressed in Mcrs1OX cells. Genes were clustered based on ATAC-seq profiles, with the mean ATAC signals for each cluster shown on the right. (C) Chromatin accessibility at the MHC-I loci determined by ATAC-seq, with the upper panel showing tracks of ATAC-seq signals and the lower panel showing quantification of peaks around the TSS or distal non-coding regions (n = 2 for both groups; presented as means ± SEM; *, P < 0.05; **, P < 0.01; ****, P < 0.0001; MAnorm test). (D) MCRS1-regulated genes identified by differential expression in Mcrs1OX cell and tumor (RNA-seq), direct binding by MCRS1 (ChIP-seq), and MCRS1/YY1-dependent chromatin accessibility change (ATAC-seq). A total of 39 genes met all these criteria, including the MHC-I genes. (E) The growth curves of control, Mcrs1OX, and Mcrs1OX;sgYy1 tumors in WT mice (n = 8, 8, 7 for control, Mcrs1OX, and Mcrs1OX;sgYy1, respectively; presented as Means ± SEM; ns, not significant, P ≥ 0.05; *, P < 0.05; two-way ANOVA with Tukey’s multiple comparisons test; N = 3 independent experiments). Illustration was created with https://BioRender.com. (F) Spider plots showing tumor volume changes in individual mice tumors as in E. (G) Tumor weights at the point of sacrifice (n = 8, 8, 7 for control, Mcrs1OX, and Mcrs1OX;sgYy1, respectively; presented as means ± SEM; ns, not significant, P ≥ 0.05; **, P < 0.01; ****, P < 0.0001; one-way ANOVA with Tukey’s multiple comparisons test; N = 3 independent experiments). (H) Analysis of CD8+ T cells in control, Mcrs1OX, and Mcrs1OX;sgYy1 tumors, analyzed by immunofluorescent staining (upper panel) and flow cytometry (lower panel) (n = 8, 8, 7 for control, Mcrs1OX, and Mcrs1OX;sgYy1, respectively; presented as means ± SEM; ns, not significant, P ≥ 0.05; *, P < 0.05; **, P < 0.01; ****, P < 0.0001; one-way ANOVA with Tukey’s multiple comparisons test; N = 3 independent experiments). Scale bar = 50 μm.
Figure 7.
Figure 7.
MCRS1 sensitizes α-PD-1 immunotherapy in mice and humans. (A) The tumor growth curve of control and Mcrs1OX tumors treated with an α-PD-1 antibody (n = 7 for all groups; presented as means ± SEM; ns, not significant, P ≥ 0.05; *, P < 0.05; **, P < 0.01; ***, P < 0.001; two-way ANOVA with Sidak’s multiple comparisons test; N = 2 independent experiments). Illustration was created with https://BioRender.com. (B) Spider plots showing tumor growth in individual mice as in A. (C) Tumor weights at the point of sacrifice (n = 7 for all groups; presented as means ± SEM; ns, not significant, P ≥ 0.05; *, P < 0.05; two-way ANOVA with Sidak’s multiple comparisons test; N = 2 independent experiments). (D) Tumor responses to NAC of PDAC patients with different MCRS1 levels, determined by histological evaluation (n = 40, 27 for MCRS1-low and MCRS1-high groups, respectively; ****, P < 0.0001; Chi-square test). (E) Overall survival (OS) of PDAC patients with different MCRS1 levels after NAC treatment (n = 40, 27 for MCRS1-low and MCRS1-high groups, respectively; Kaplan–Meier test). (F) Progression-free survival (PFS) of PDAC patients with different MCRS1 levels after NAC treatment (n = 40, 27 for MCRS1-low and MCRS1-high groups, respectively; Kaplan–Meier test). (G) Correlation between MCRS1 and MHC-I (HLA-A,B,C) expression in TCGA cancer types. (H) Representative IHC images showing high and low expression of MCRS1 (brown) in clinical samples of human NSCLC patients. Scale bars in the left panels = 100 μm; scale bars in the right panels = 20 μm. (I) Overall survival of NSCLC patients with different MCRS1 levels after α-PD-1 treatment (n = 60, 48 for MCRS1-low and MCRS1-high groups, respectively; Kaplan–Meier test). (J) Progression-free survival of NSCLC patients with different MCRS1 levels after α-PD-1 treatment (n = 65, 59 for MCRS1-low and MCRS1-high groups, respectively; Kaplan–Meier test). (K) Representative images showing MCRS1 levels in paired biopsies before and after α-PD-1 treatment (n = 25 for both groups). Scale bars = 50 μm. (L) MCRS1 expression in paired biopsies from the same patients before and after α-PD-1 treatment (n = 25 for both groups; *, P < 0.05; two-tailed paired t test).

Similar articles

Cited by

References

    1. Ascic, E., Åkerström F., Sreekumar Nair M., Rosa A., Kurochkin I., Zimmermannova O., Catena X., Rotankova N., Veser C., Rudnik M., et al. . 2024. In vivo dendritic cell reprogramming for cancer immunotherapy. Science. 386:eadn9083. 10.1126/science.adn9083 - DOI - PMC - PubMed
    1. Balachandran, V.P., Luksza M., Zhao J.N., Makarov V., Moral J.A., Remark R., Herbst B., Askan G., Bhanot U., Senbabaoglu Y., et al. . 2017. Identification of unique neoantigen qualities in long-term survivors of pancreatic cancer. Nature. 551:512–516. 10.1038/nature24462 - DOI - PMC - PubMed
    1. Burdziak, C., Alonso-Curbelo D., Walle T., Reyes J., Barriga F.M., Haviv D., Xie Y., Zhao Z., Zhao C.J., Chen H.A., et al. . 2023. Epigenetic plasticity cooperates with cell-cell interactions to direct pancreatic tumorigenesis. Science. 380:eadd5327. 10.1126/science.add5327 - DOI - PMC - PubMed
    1. Chavez, A., Scheiman J., Vora S., Pruitt B.W., Tuttle M., P R Iyer E., Lin S., Kiani S., Guzman C.D., Wiegand D.J., et al. . 2015. Highly efficient Cas9-mediated transcriptional programming. Nat. Methods. 12:326–328. 10.1038/nmeth.3312 - DOI - PMC - PubMed
    1. Chen, X., Lu Q., Zhou H., Liu J., Nadorp B., Lasry A., Sun Z., Lai B., Rona G., Zhang J., et al. . 2023. A membrane-associated MHC-I inhibitory axis for cancer immune evasion. Cell. 186:3903–3920.e21. 10.1016/j.cell.2023.07.016 - DOI - PMC - PubMed

MeSH terms

Substances